The same plot in 14 other libraries — JavaScript: Chart.js, D3.js, Highcharts, MUI X Charts; Python: Altair, Bokeh, lets-plot, Matplotlib, Plotly, plotnine, Pygal, Seaborn; R: ggplot2; Julia: Makie.jl. Compare all 15 side by side: Range Interval Chart in Python, R, Julia and JavaScript.
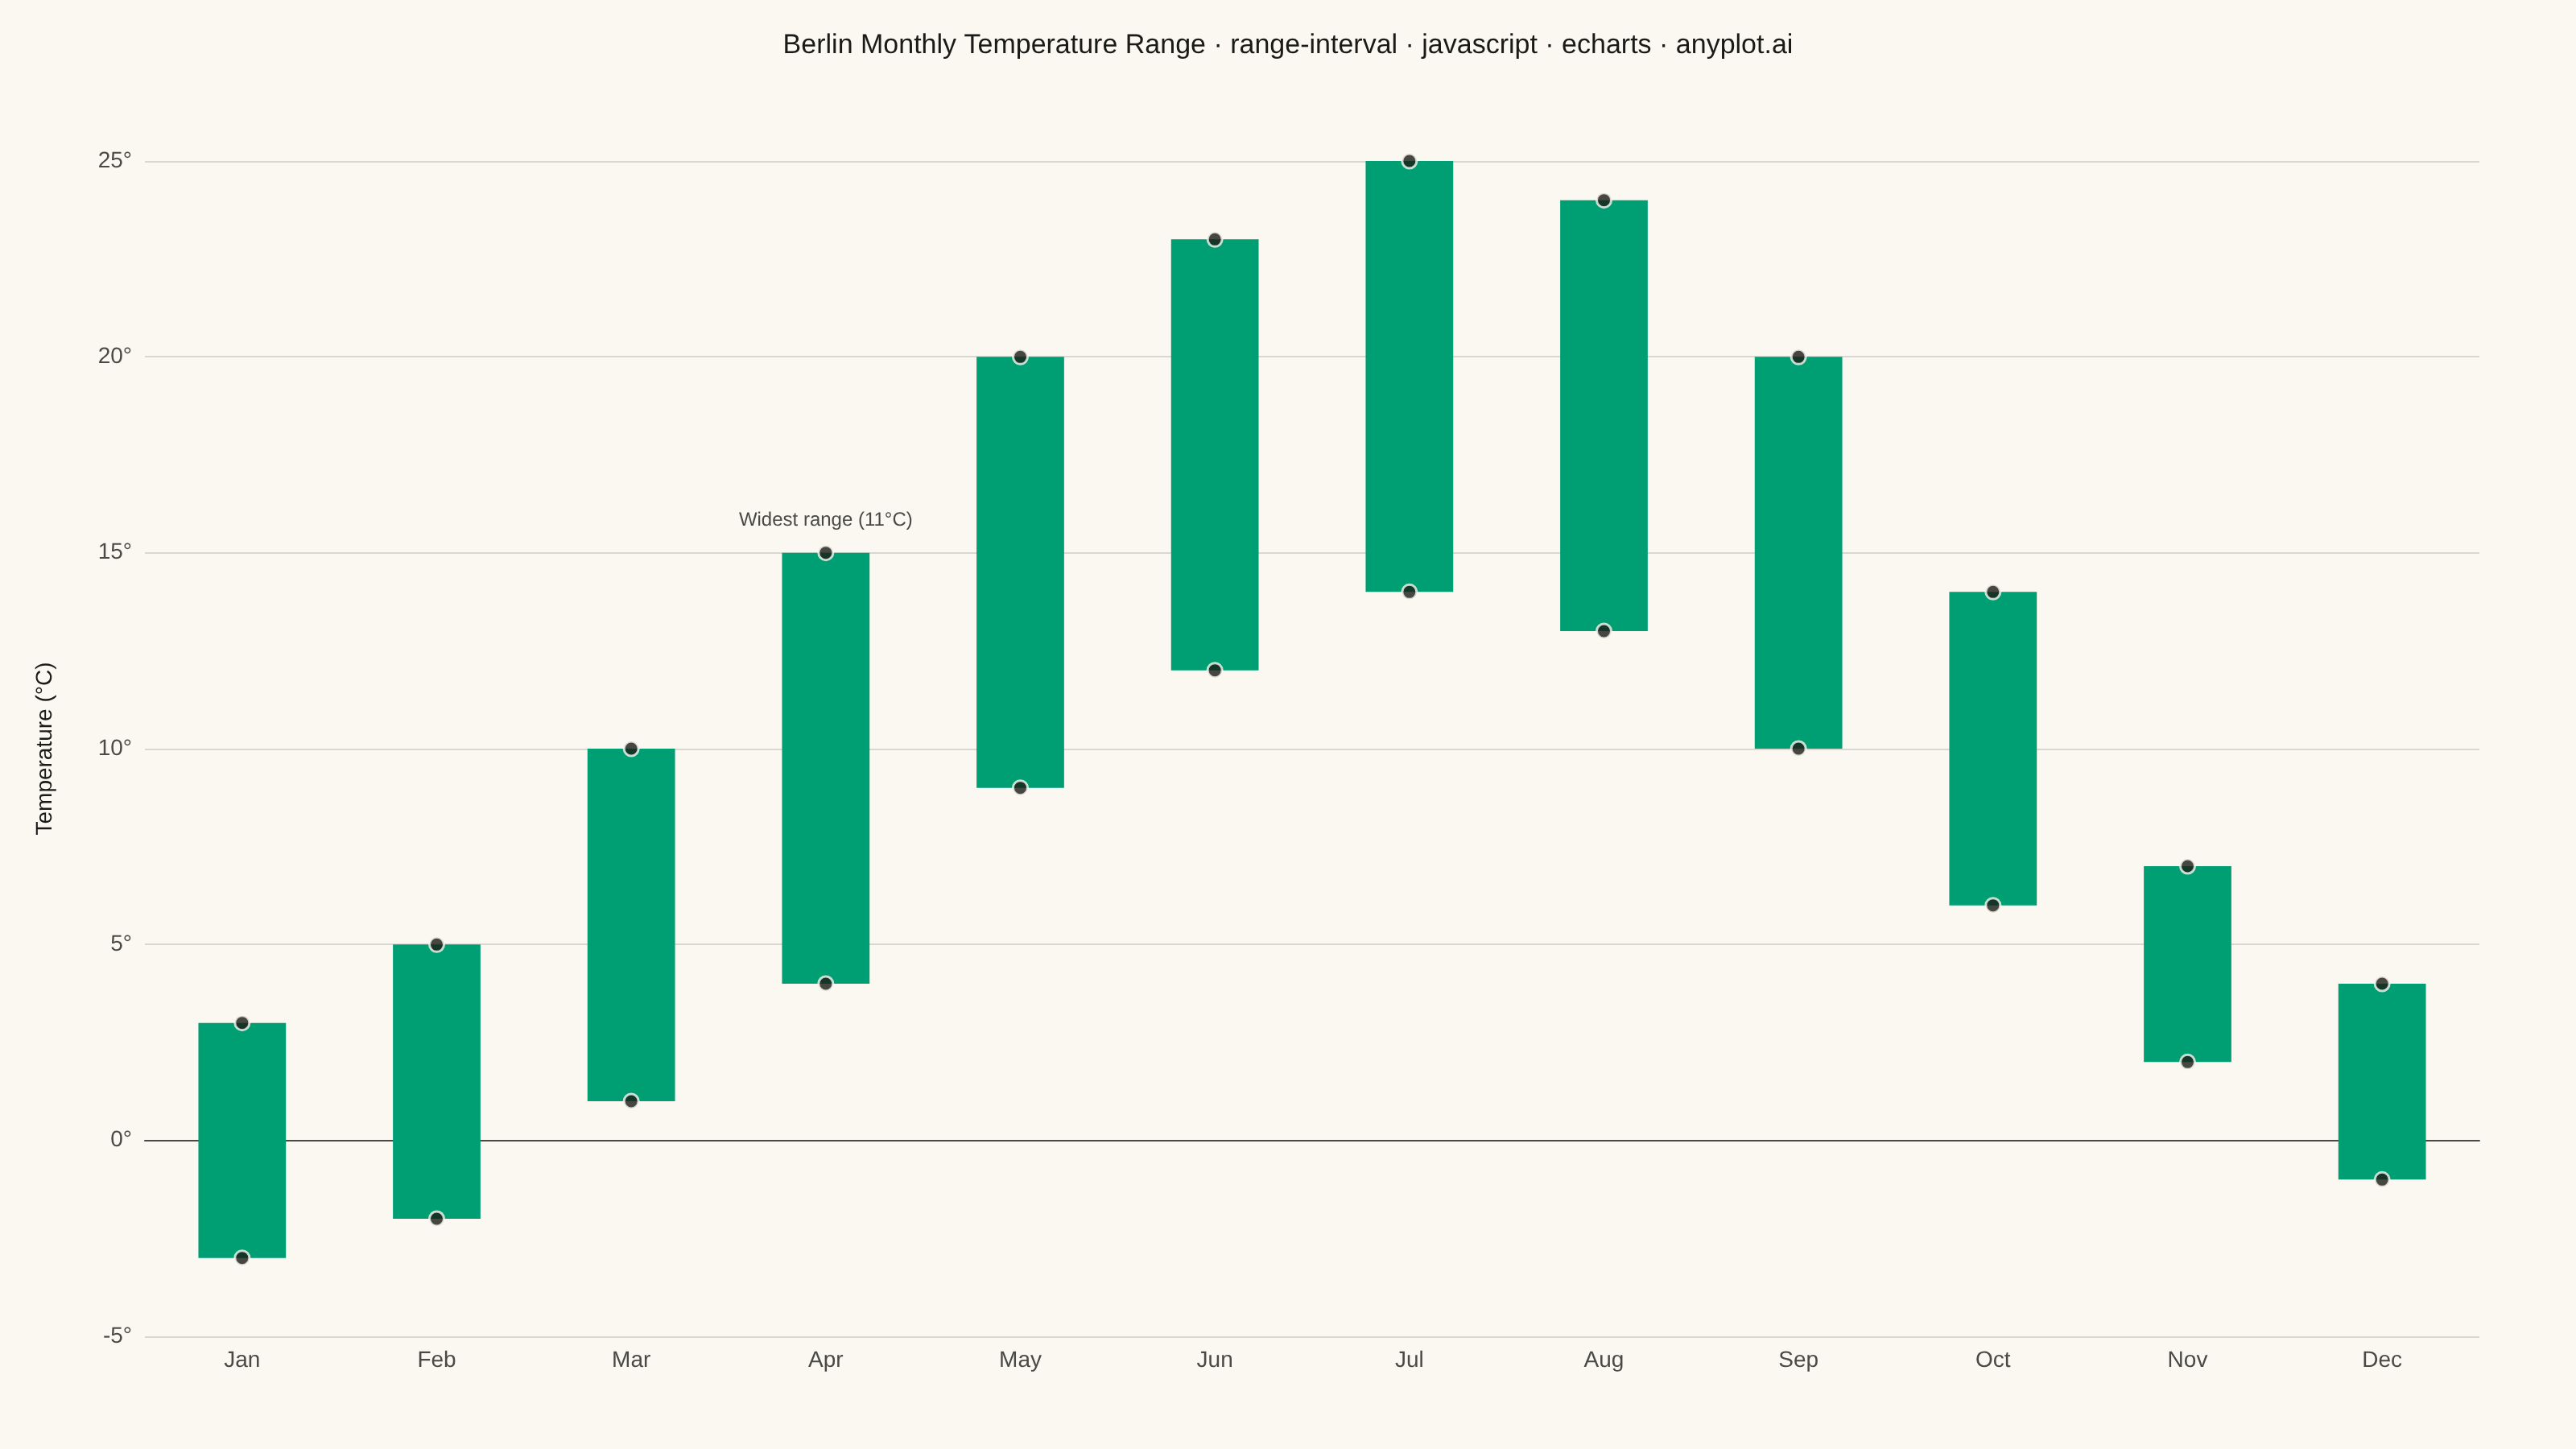
A range interval chart displays min-max ranges or intervals as vertical or horizontal bars/segments for each category, making it ideal for visualizing uncertainty bounds, confidence intervals, or value spreads. Unlike error bars which extend from a central data point, range intervals show the full span between two values as a filled bar or line segment, emphasizing the range itself rather than deviation from a center. This visualization excels at comparing ranges across multiple categories simultaneously.
// anyplot.ai
// range-interval: Range Interval Chart
// Library: echarts 6.1.0 | JavaScript 22.23.2
// Quality: 89/100 | Created: 2026-09-02

const t = window.ANYPLOT_TOKENS;

// --- Data (in-memory, deterministic): Berlin monthly temperature range (°C) -
const months = ["Jan", "Feb", "Mar", "Apr", "May", "Jun",
                "Jul", "Aug", "Sep", "Oct", "Nov", "Dec"];
const lowTemps = [-3, -2, 1, 4, 9, 12, 14, 13, 10, 6, 2, -1];
const highTemps = [3, 5, 10, 15, 20, 23, 25, 24, 20, 14, 7, 4];

// Widest low-to-high span gets a callout label — a focal point beyond plain
// chronological ordering.
const rangeWidths = months.map((_, i) => highTemps[i] - lowTemps[i]);
const widestIndex = rangeWidths.indexOf(Math.max(...rangeWidths));

// --- Init -------------------------------------------------------------------
const chart = echarts.init(document.getElementById("container"));

// --- Range bar geometry (custom renderItem — draws [low, high] directly) ----
// A stacked-bar "invisible base" trick breaks once low is negative, because
// ECharts accumulates positive and negative stack values separately instead
// of letting a negative base shift a positive bar downward. Drawing the rect
// explicitly from the low to the high coordinate avoids that edge case.
function renderRangeBar(params, api) {
  const categoryIndex = api.value(0);
  const low = api.coord([categoryIndex, api.value(1)]);
  const high = api.coord([categoryIndex, api.value(2)]);
  const halfWidth = api.size([1, 0])[0] * 0.225;
  const shape = echarts.graphic.clipRectByRect(
    { x: low[0] - halfWidth, y: high[1], width: halfWidth * 2, height: low[1] - high[1] },
    { x: params.coordSys.x, y: params.coordSys.y, width: params.coordSys.width, height: params.coordSys.height }
  );
  if (!shape) return;
  const rect = { type: "rect", shape, style: api.style() };
  if (params.dataIndex !== widestIndex) return rect;
  const label = {
    type: "text",
    style: {
      text: `Widest range (${rangeWidths[widestIndex]}°C)`,
      x: low[0],
      y: high[1] - 14,
      fill: t.inkSoft,
      fontSize: 12,
      align: "center",
      verticalAlign: "bottom",
    },
    z2: 10,
  };
  return { type: "group", children: [rect, label] };
}

// --- Option -------------------------------------------------------------------
chart.setOption({
  animation: false,
  color: t.palette,
  backgroundColor: "transparent",
  title: {
    text: "Berlin Monthly Temperature Range · range-interval · javascript · echarts · anyplot.ai",
    left: "center",
    textStyle: { color: t.ink, fontSize: 17, fontWeight: 500 },
  },
  grid: { left: 90, right: 60, top: 100, bottom: 70 },
  xAxis: {
    type: "category",
    data: months,
    axisLabel: { color: t.inkSoft, fontSize: 14 },
    axisLine: { lineStyle: { color: t.inkSoft } },
    axisTick: { show: false },
    splitLine: { show: false },
  },
  yAxis: {
    type: "value",
    name: "Temperature (°C)",
    nameLocation: "middle",
    nameGap: 55,
    nameTextStyle: { color: t.ink, fontSize: 14 },
    axisLabel: { color: t.inkSoft, fontSize: 14, formatter: "{value}°" },
    axisLine: { show: false },
    axisTick: { show: false },
    splitLine: { lineStyle: { color: t.grid } },
  },
  series: [
    {
      name: "Temperature range",
      type: "custom",
      renderItem: renderRangeBar,
      data: months.map((_, i) => [i, lowTemps[i], highTemps[i]]),
      itemStyle: { color: t.palette[0], borderRadius: 3 },
      z: 2,
    },
    {
      name: "Low / high",
      type: "scatter",
      data: months.flatMap((_, i) => [
        [i, lowTemps[i]],
        [i, highTemps[i]],
      ]),
      symbolSize: 9,
      itemStyle: { color: t.ink, borderColor: t.pageBg, borderWidth: 1.5 },
      z: 3,
    },
  ],
});
Runnable source as JSON, for any HTTP client: https://api.anyplot.ai/specs/range-interval/echarts/code. Any spec id and library id listed in llms-full.txt fit the same URL shape; every URL below is complete and callable.
{
  "spec_id": "range-interval",
  "language": "javascript",
  "library": "echarts",
  "page": "https://anyplot.ai/range-interval/javascript/echarts",
  "hub": "https://anyplot.ai/range-interval",
  "code_json": "https://api.anyplot.ai/specs/range-interval/echarts/code",
  "spec_json": "https://api.anyplot.ai/specs/range-interval",
  "render_light_png": "https://storage.googleapis.com/anyplot-images/plots/range-interval/javascript/echarts/plot-light.png",
  "render_dark_png": "https://storage.googleapis.com/anyplot-images/plots/range-interval/javascript/echarts/plot-dark.png",
  "interactive_light_html": "https://storage.googleapis.com/anyplot-images/plots/range-interval/javascript/echarts/plot-light.html",
  "interactive_dark_html": "https://storage.googleapis.com/anyplot-images/plots/range-interval/javascript/echarts/plot-dark.html",
  "quality_score": 89.0,
  "license": "MIT",
  "guide": "https://anyplot.ai/llms.txt"
}
Part of Range Interval Chart on anyplot.ai.