The same plot in 14 other libraries — JavaScript: Chart.js, D3.js, Apache ECharts, MUI X Charts; Python: Altair, Bokeh, lets-plot, Matplotlib, Plotly, plotnine, Pygal, Seaborn; R: ggplot2; Julia: Makie.jl. Compare all 15 side by side: Range Interval Chart in Python, R, Julia and JavaScript.
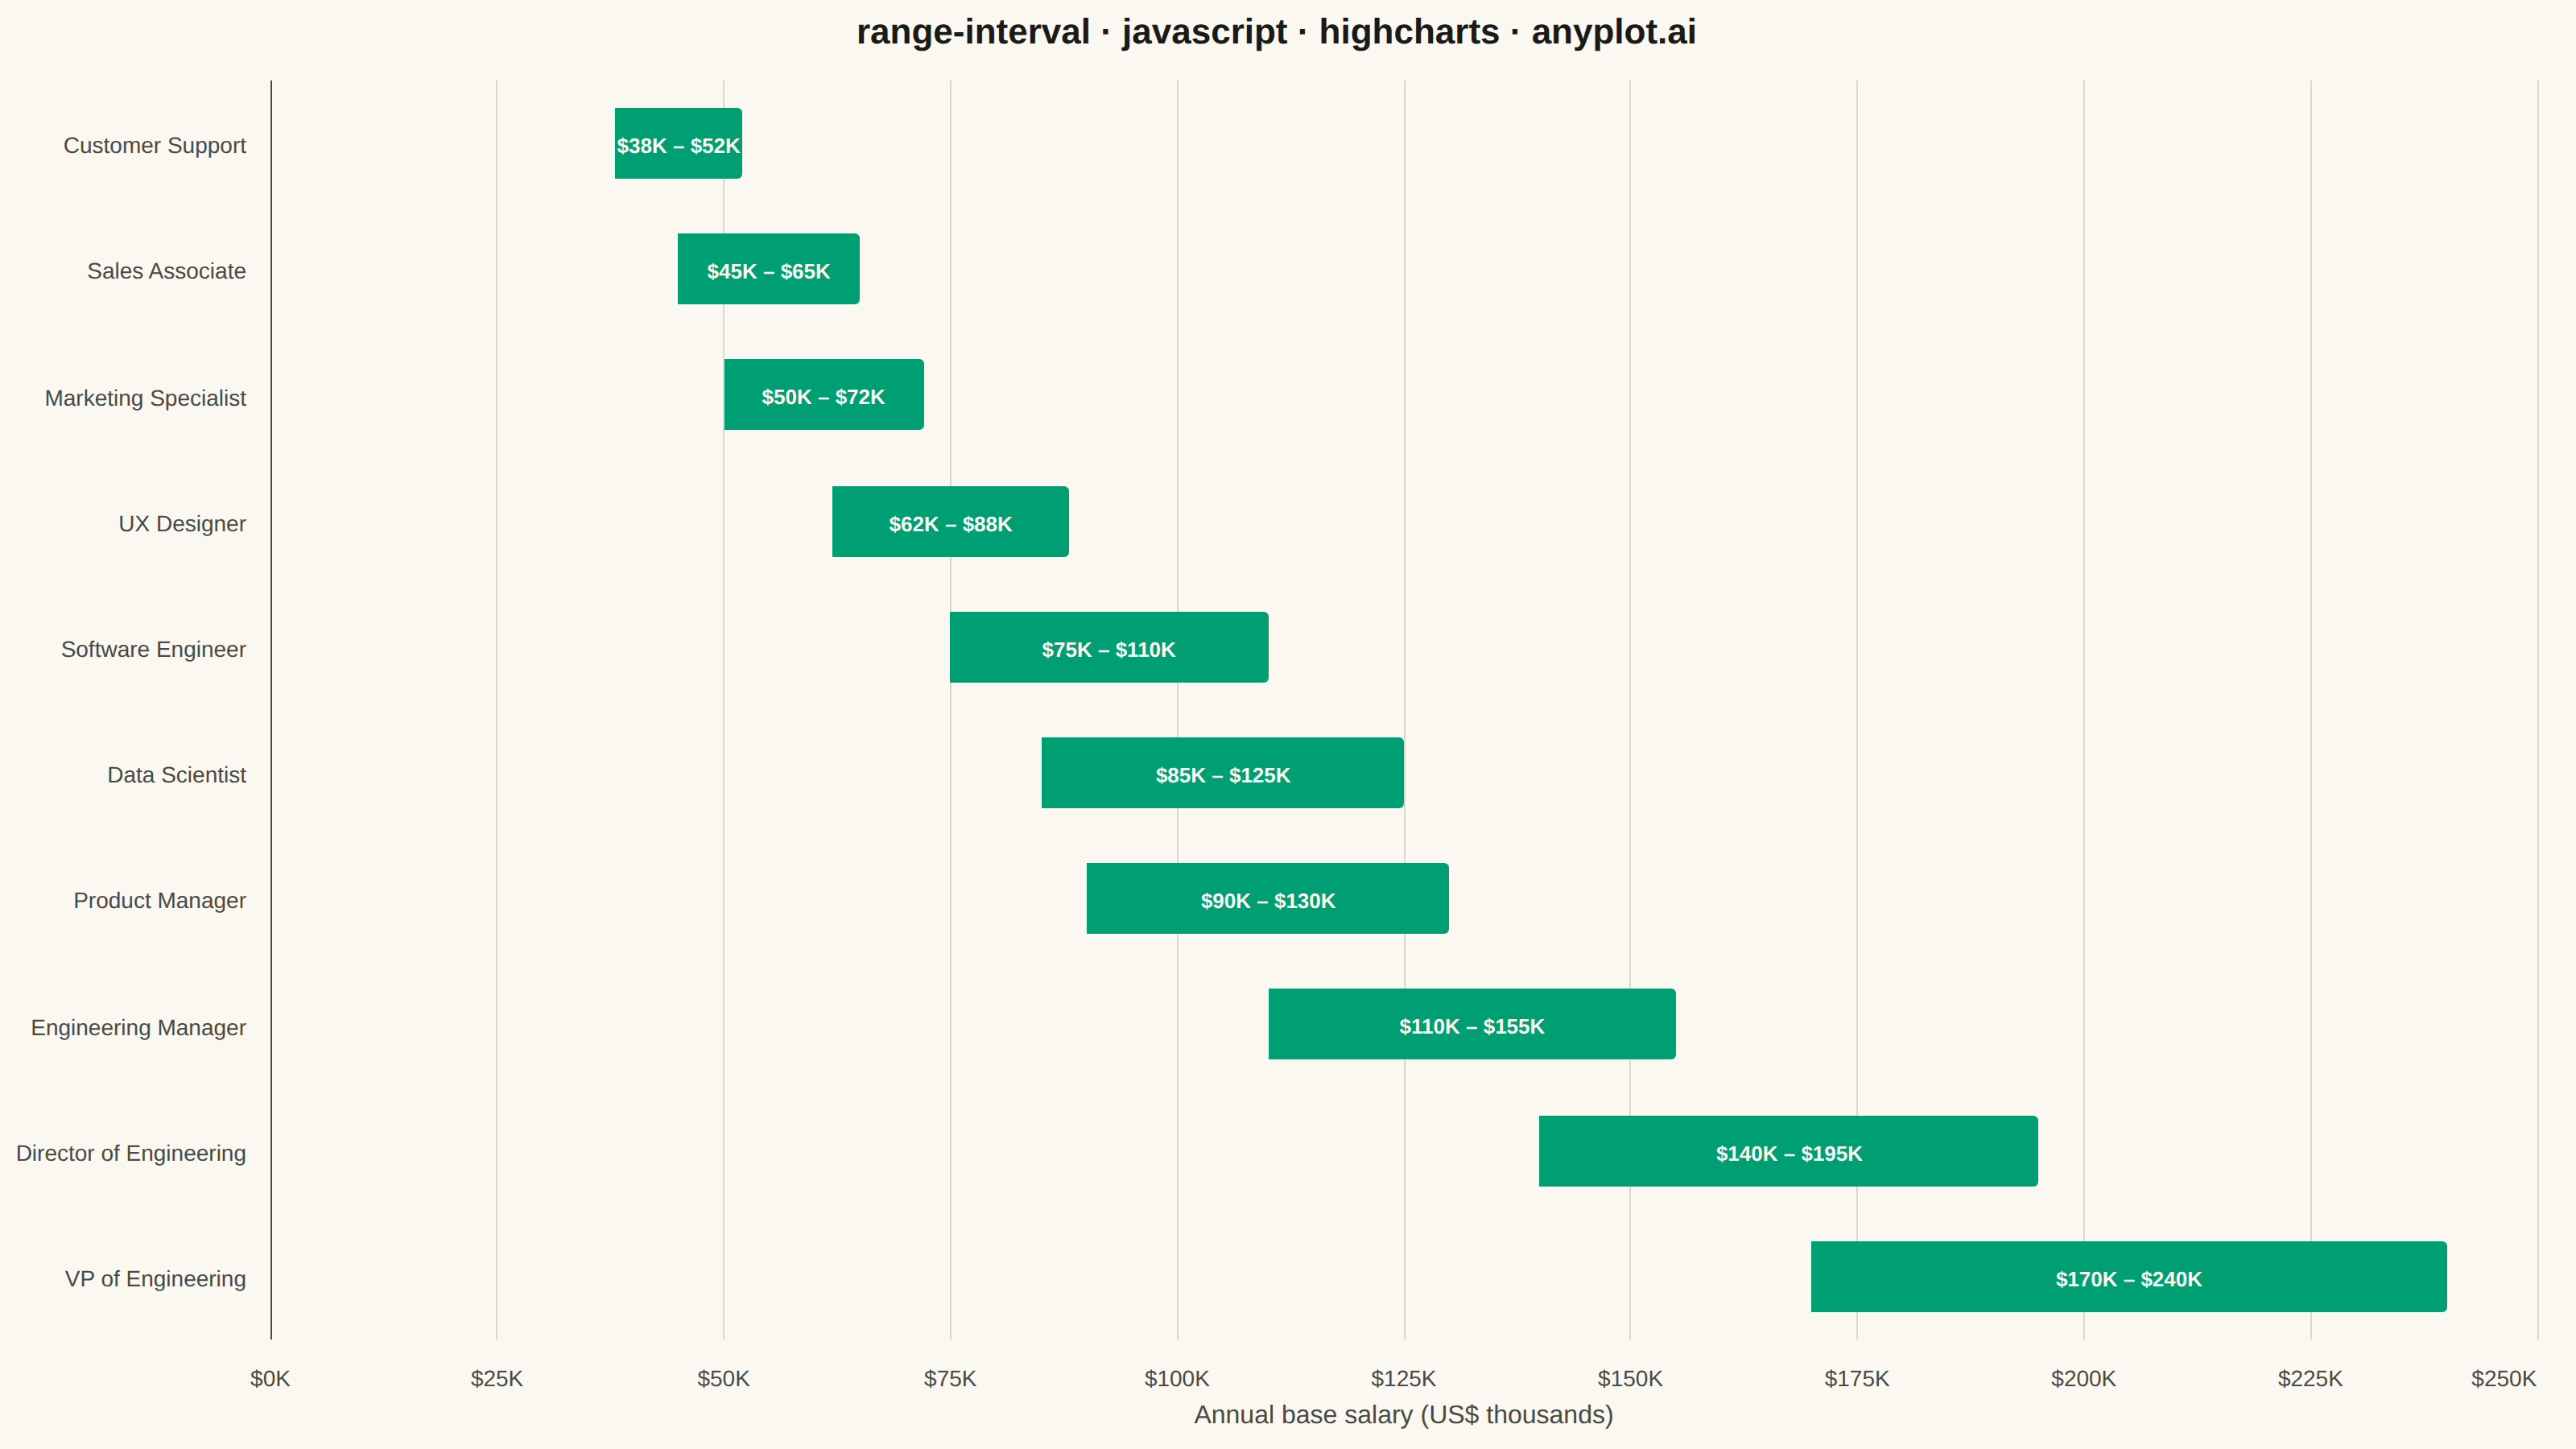
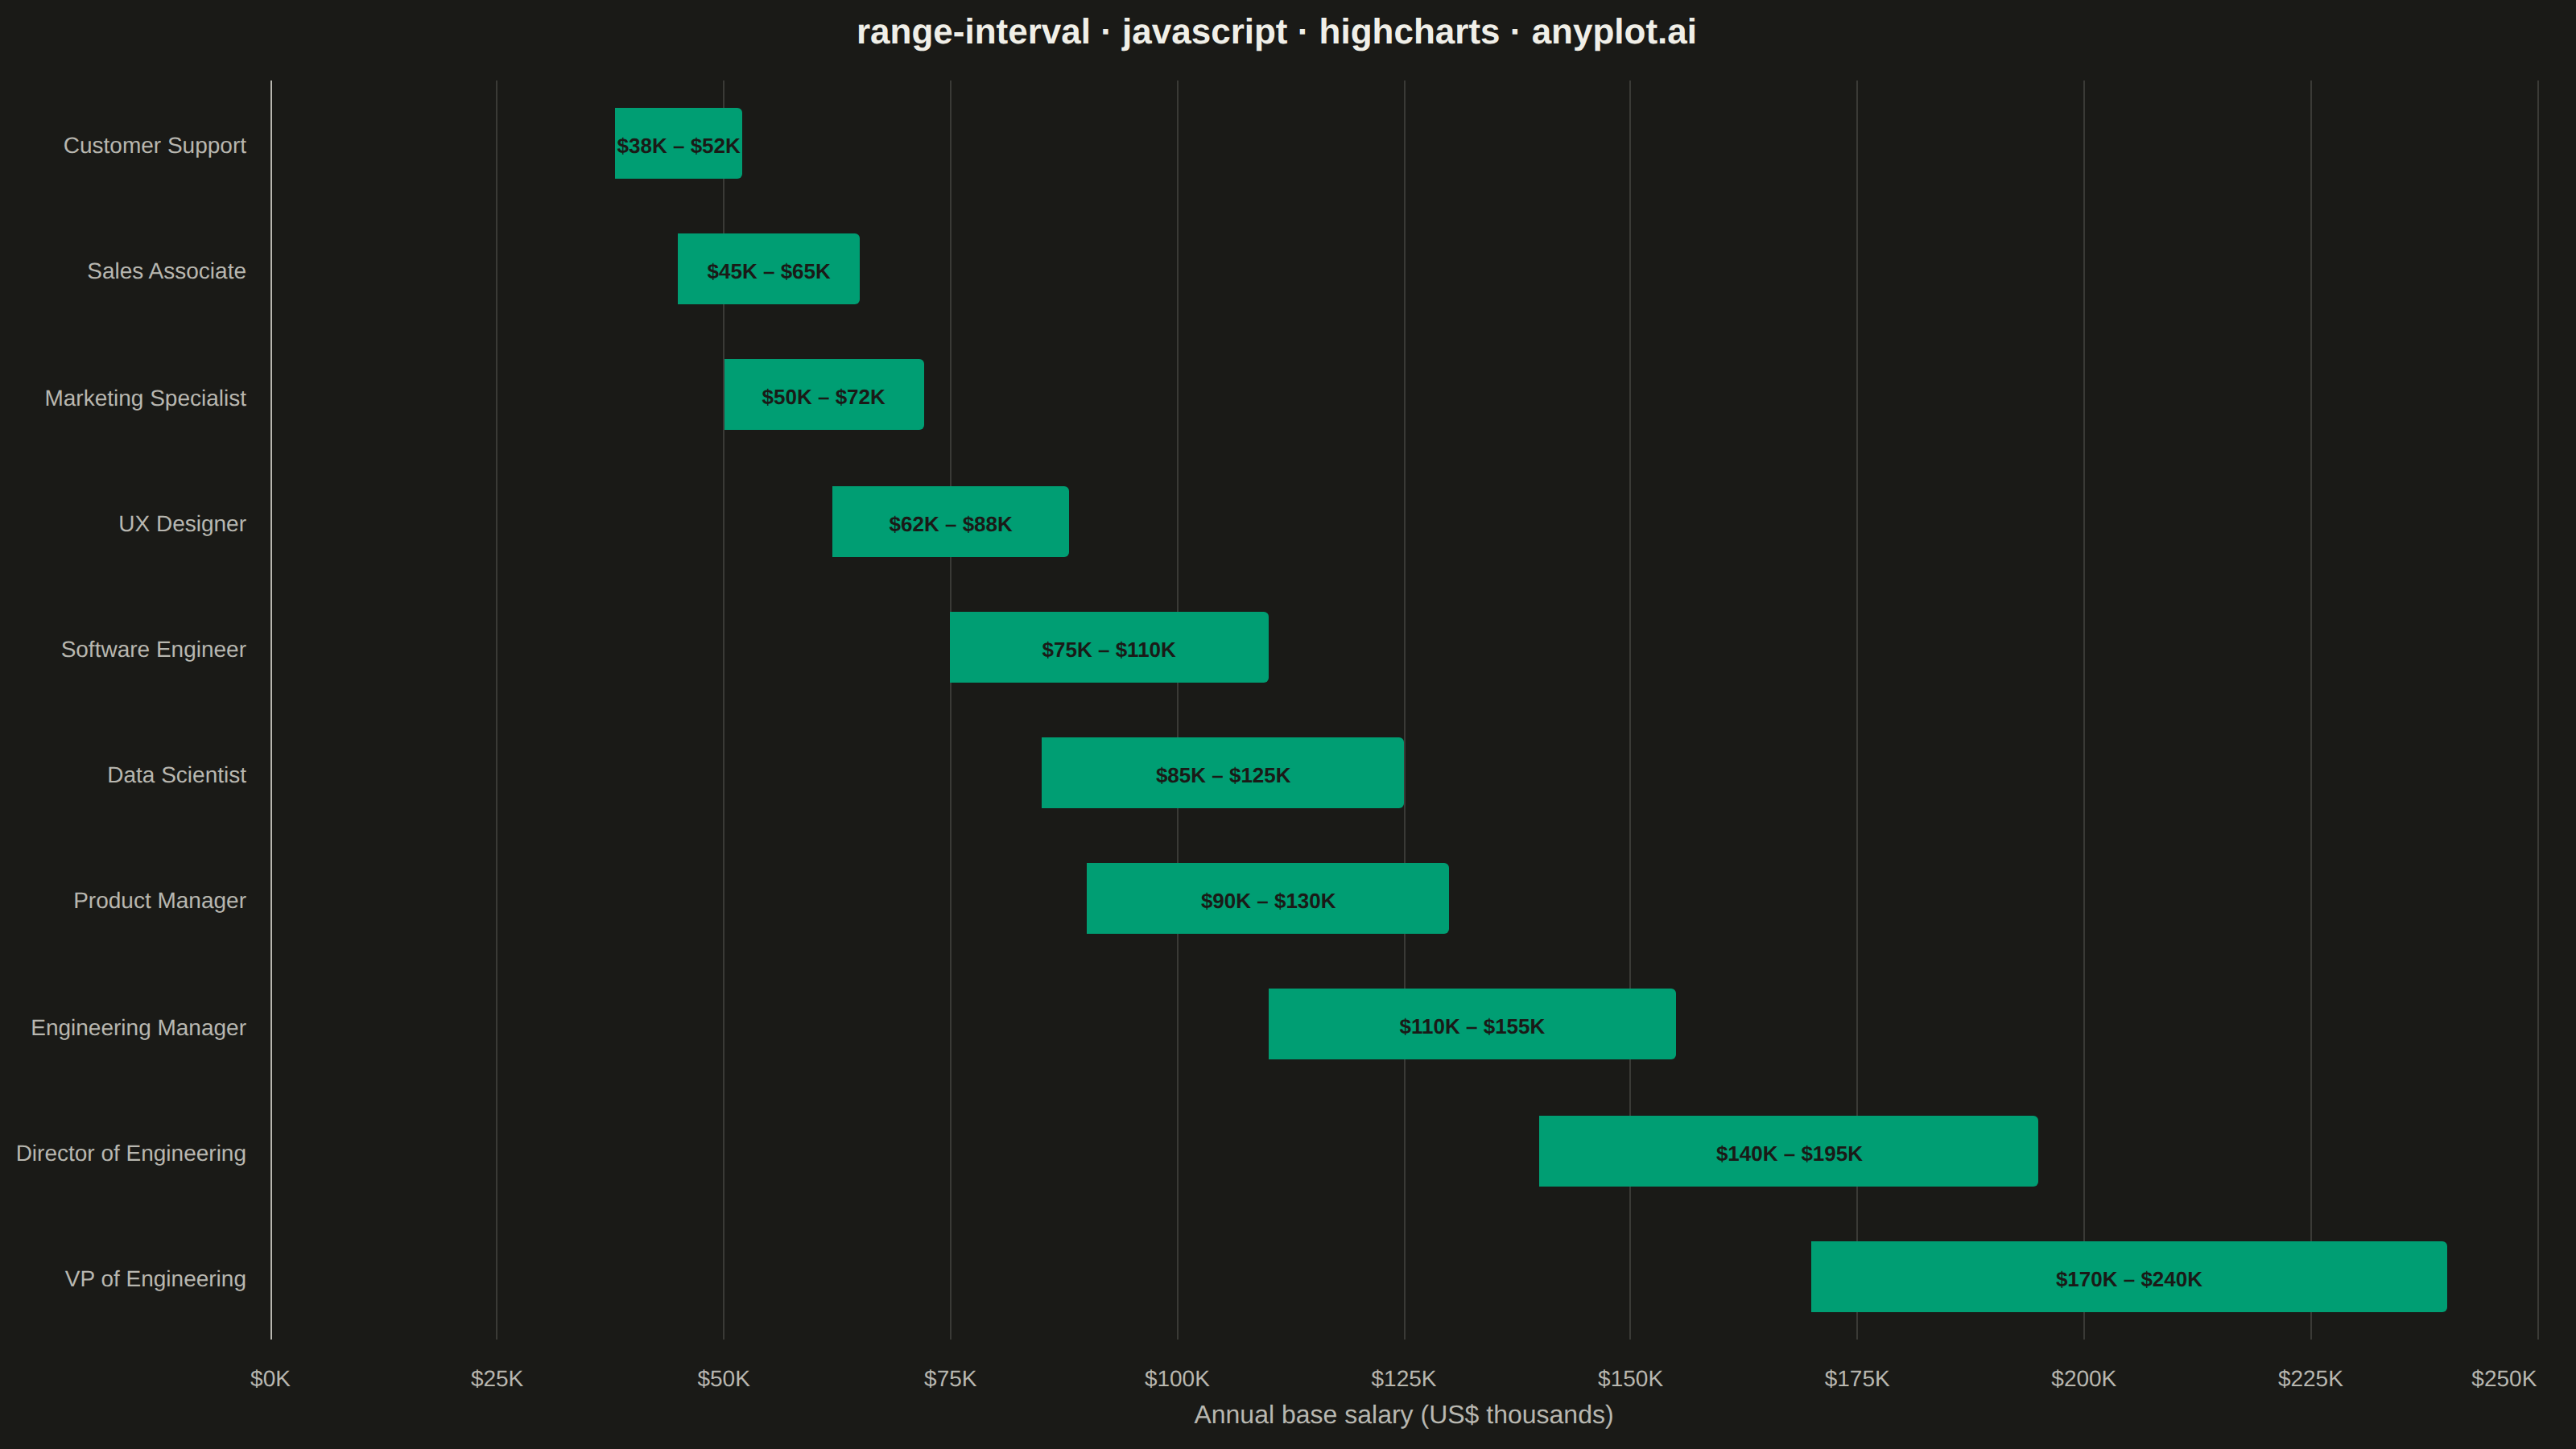
A range interval chart displays min-max ranges or intervals as vertical or horizontal bars/segments for each category, making it ideal for visualizing uncertainty bounds, confidence intervals, or value spreads. Unlike error bars which extend from a central data point, range intervals show the full span between two values as a filled bar or line segment, emphasizing the range itself rather than deviation from a center. This visualization excels at comparing ranges across multiple categories simultaneously.
// anyplot.ai
// range-interval: Range Interval Chart
// Library: highcharts 12.6.0 | JavaScript 22.23.2
// Quality: 86/100 | Created: 2026-09-02

const t = window.ANYPLOT_TOKENS;

// --- Data (in-memory, deterministic) ----------------------------------------
// Annual base salary range by role, sorted by seniority (low to high midpoint).
// Core Highcharts has no `columnrange` (that lives in the highcharts-more
// module, which isn't loaded) — so the range is built as a stacked bar: an
// invisible "floor" series holding each range's minimum, topped by a visible
// series holding the span (max - min). The stack lands exactly on [min, max].
// Highcharts renders stacked series in REVERSE array order by default (the
// last series in `series[]` sits closest to zero) — so the visible span
// series is declared FIRST and the invisible floor SECOND below, otherwise
// the floor stacks on top and every bar appears anchored at 0.
const roles = [
  "Customer Support",
  "Sales Associate",
  "Marketing Specialist",
  "UX Designer",
  "Software Engineer",
  "Data Scientist",
  "Product Manager",
  "Engineering Manager",
  "Director of Engineering",
  "VP of Engineering",
];
const minSalary = [38, 45, 50, 62, 75, 85, 90, 110, 140, 170];
const maxSalary = [52, 65, 72, 88, 110, 125, 130, 155, 195, 240];

// The range series data holds plain `y` numbers; the original min/max values
// are looked up by point index inside the dataLabels formatter below.
const rangeData = minSalary.map((low, i) => maxSalary[i] - low);

// --- Chart -------------------------------------------------------------------
Highcharts.chart("container", {
  chart: {
    type: "bar",
    backgroundColor: "transparent",
    animation: false,
    spacingRight: 24,
    style: { fontFamily: "inherit" },
  },
  credits: { enabled: false },
  colors: t.palette,
  title: {
    text: "range-interval · javascript · highcharts · anyplot.ai",
    style: { color: t.ink, fontSize: "22px", fontWeight: "600" },
  },
  xAxis: {
    categories: roles,
    lineColor: t.inkSoft,
    tickColor: t.inkSoft,
    labels: { style: { color: t.inkSoft, fontSize: "14px" } },
  },
  yAxis: {
    min: 0,
    max: 250,
    tickInterval: 25,
    endOnTick: false,
    title: {
      text: "Annual base salary (US$ thousands)",
      style: { color: t.inkSoft, fontSize: "16px" },
    },
    gridLineColor: t.grid,
    labels: {
      style: { color: t.inkSoft, fontSize: "14px" },
      formatter: function () {
        return "$" + this.value + "K";
      },
    },
  },
  legend: { enabled: false },
  tooltip: { enabled: false },
  plotOptions: {
    series: { animation: false, stacking: "normal" },
    bar: { borderWidth: 0, borderRadius: 3, pointPadding: 0.1, groupPadding: 0.15 },
  },
  series: [
    {
      name: "Base salary range",
      data: rangeData,
      color: t.palette[0],
      dataLabels: {
        enabled: true,
        inside: true,
        align: "center",
        verticalAlign: "middle",
        formatter: function () {
          const i = this.point.index;
          return "$" + minSalary[i] + "K – $" + maxSalary[i] + "K";
        },
        style: {
          color: t.pageBg,
          fontSize: "13px",
          fontWeight: "600",
          textOutline: "none",
        },
      },
    },
    {
      name: "Floor",
      data: minSalary,
      color: "transparent",
      enableMouseTracking: false,
      showInLegend: false,
      dataLabels: { enabled: false },
    },
  ],
});
Runnable source as JSON, for any HTTP client: https://api.anyplot.ai/specs/range-interval/highcharts/code. Any spec id and library id listed in llms-full.txt fit the same URL shape; every URL below is complete and callable.
{
  "spec_id": "range-interval",
  "language": "javascript",
  "library": "highcharts",
  "page": "https://anyplot.ai/range-interval/javascript/highcharts",
  "hub": "https://anyplot.ai/range-interval",
  "code_json": "https://api.anyplot.ai/specs/range-interval/highcharts/code",
  "spec_json": "https://api.anyplot.ai/specs/range-interval",
  "render_light_png": "https://storage.googleapis.com/anyplot-images/plots/range-interval/javascript/highcharts/plot-light.png",
  "render_dark_png": "https://storage.googleapis.com/anyplot-images/plots/range-interval/javascript/highcharts/plot-dark.png",
  "interactive_light_html": "https://storage.googleapis.com/anyplot-images/plots/range-interval/javascript/highcharts/plot-light.html",
  "interactive_dark_html": "https://storage.googleapis.com/anyplot-images/plots/range-interval/javascript/highcharts/plot-dark.html",
  "quality_score": 86.0,
  "license": "MIT",
  "guide": "https://anyplot.ai/llms.txt"
}
Part of Range Interval Chart on anyplot.ai.