The same plot in 14 other libraries — JavaScript: D3.js, Apache ECharts, Highcharts, MUI X Charts; Python: Altair, Bokeh, lets-plot, Matplotlib, Plotly, plotnine, Pygal, Seaborn; R: ggplot2; Julia: Makie.jl. Compare all 15 side by side: Chess Board with Pieces for Position Diagrams in Python, R, Julia and JavaScript.
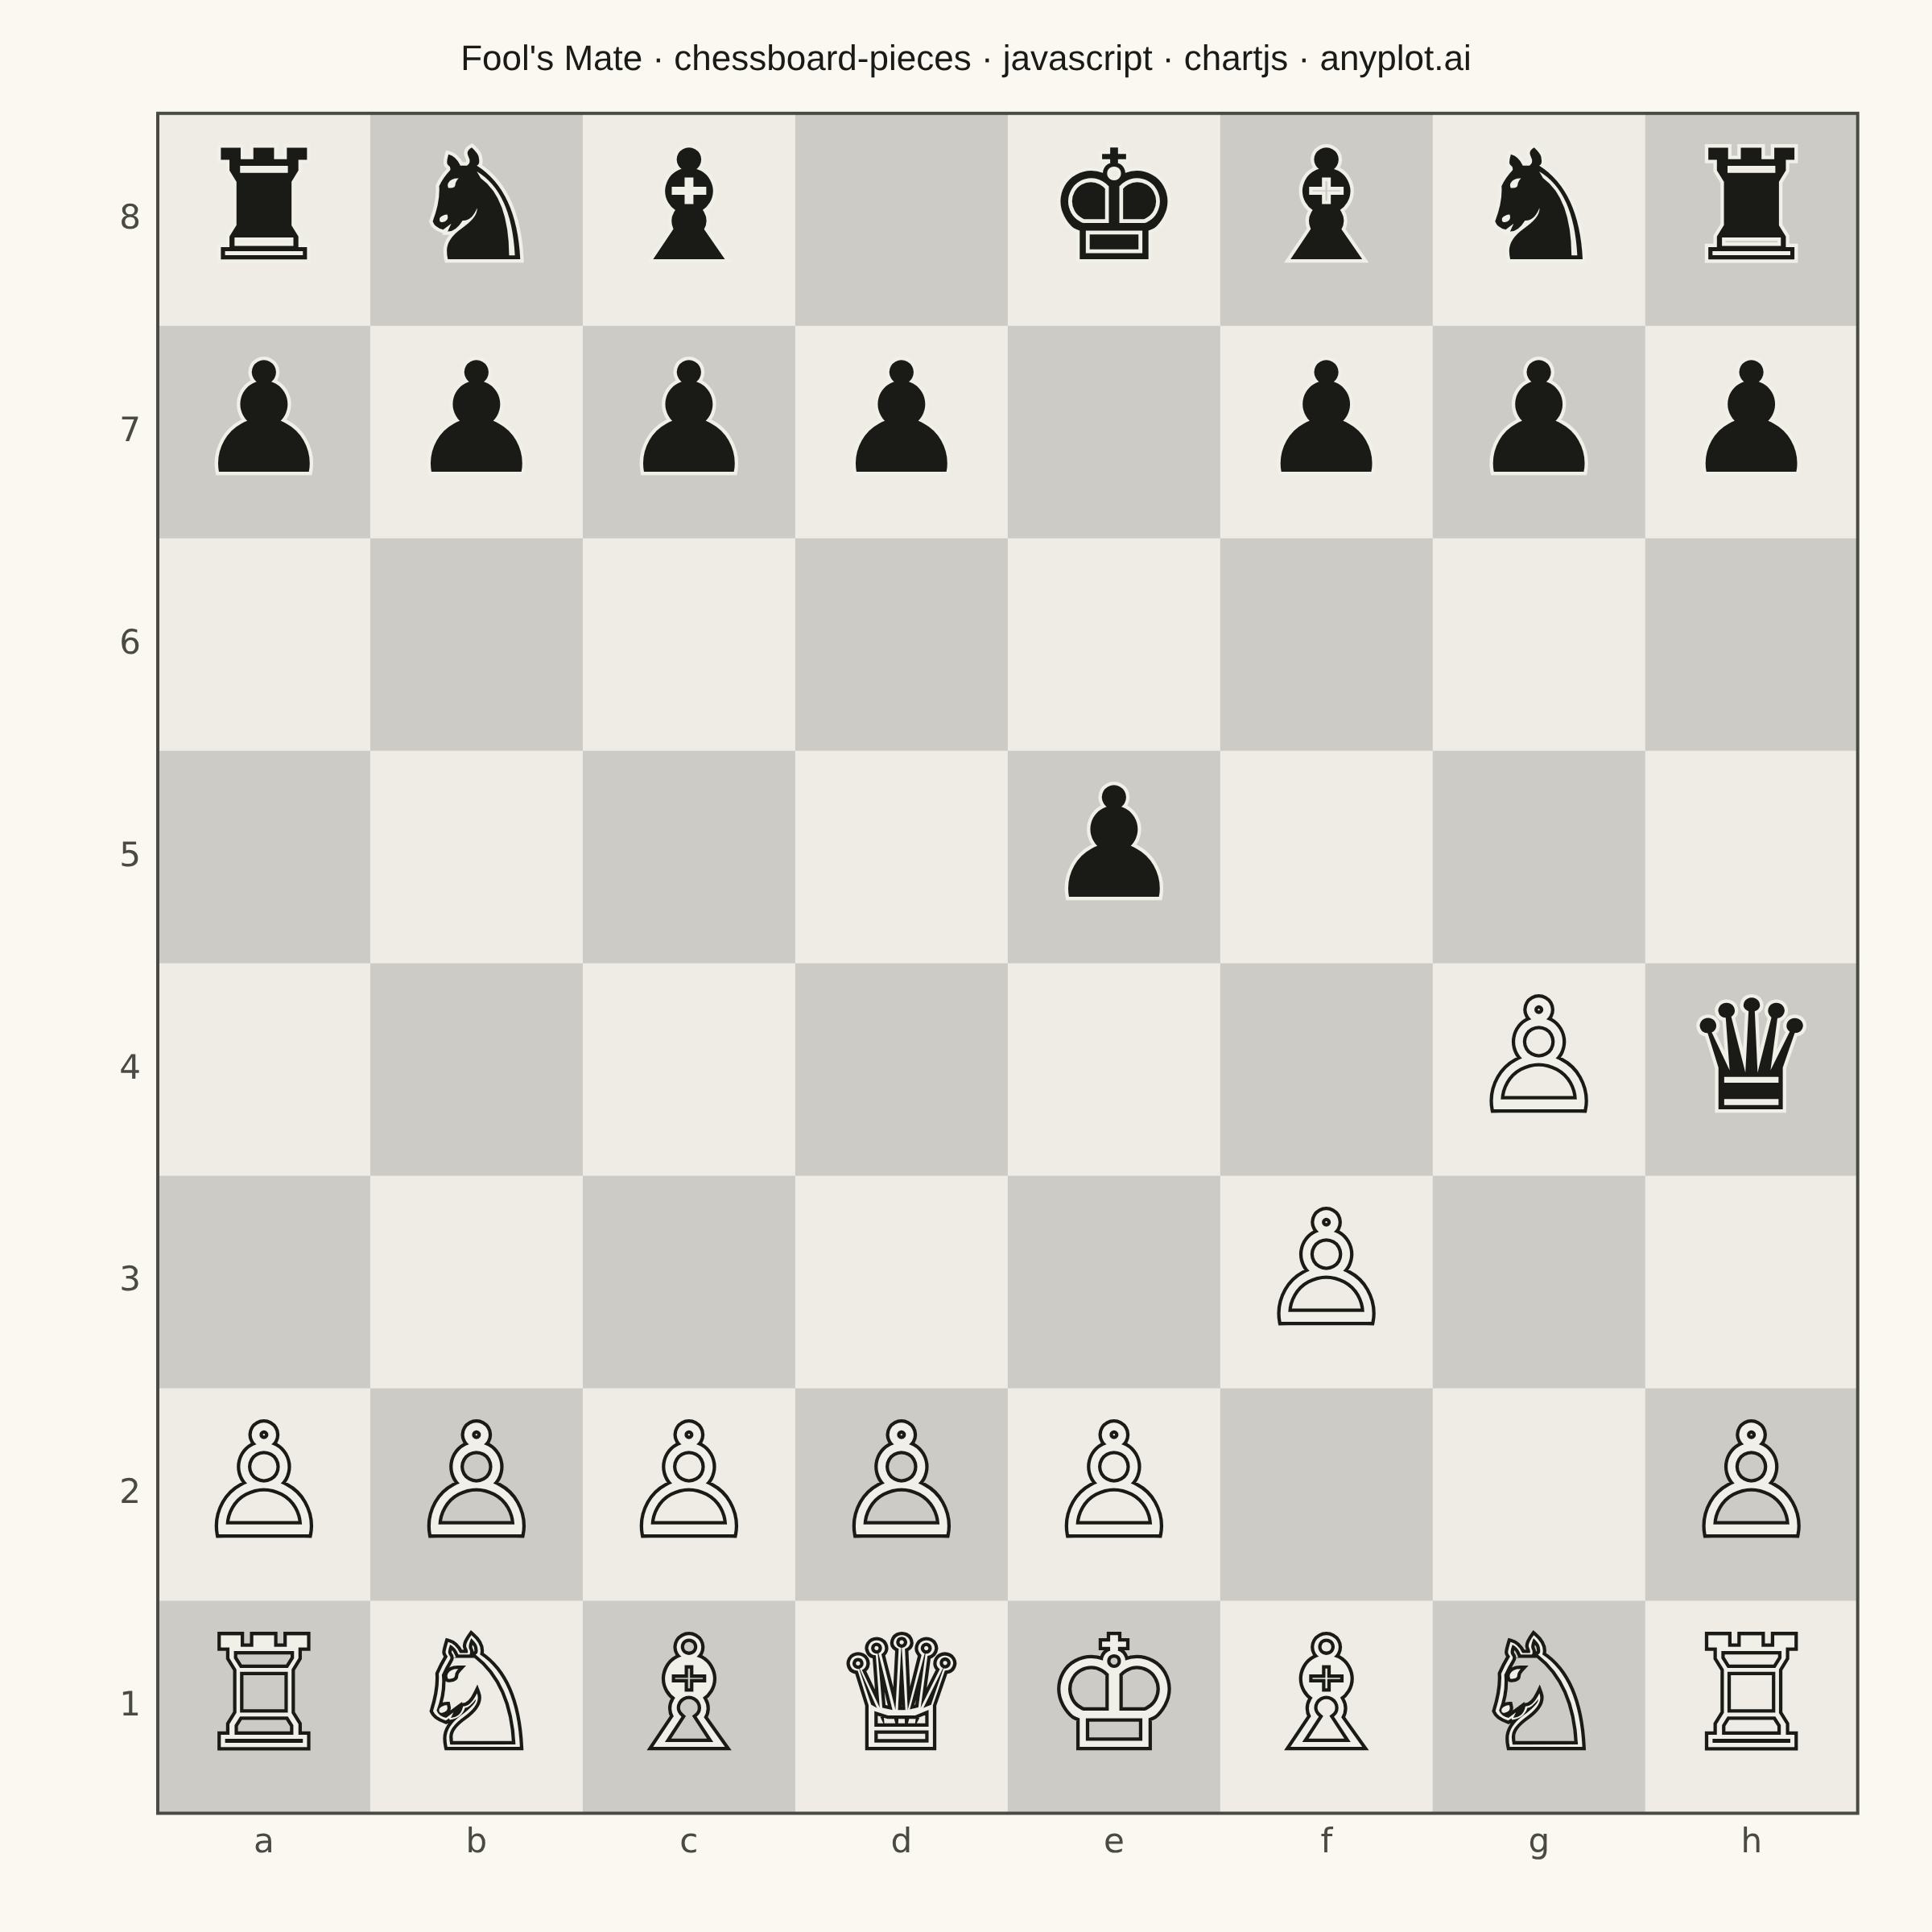
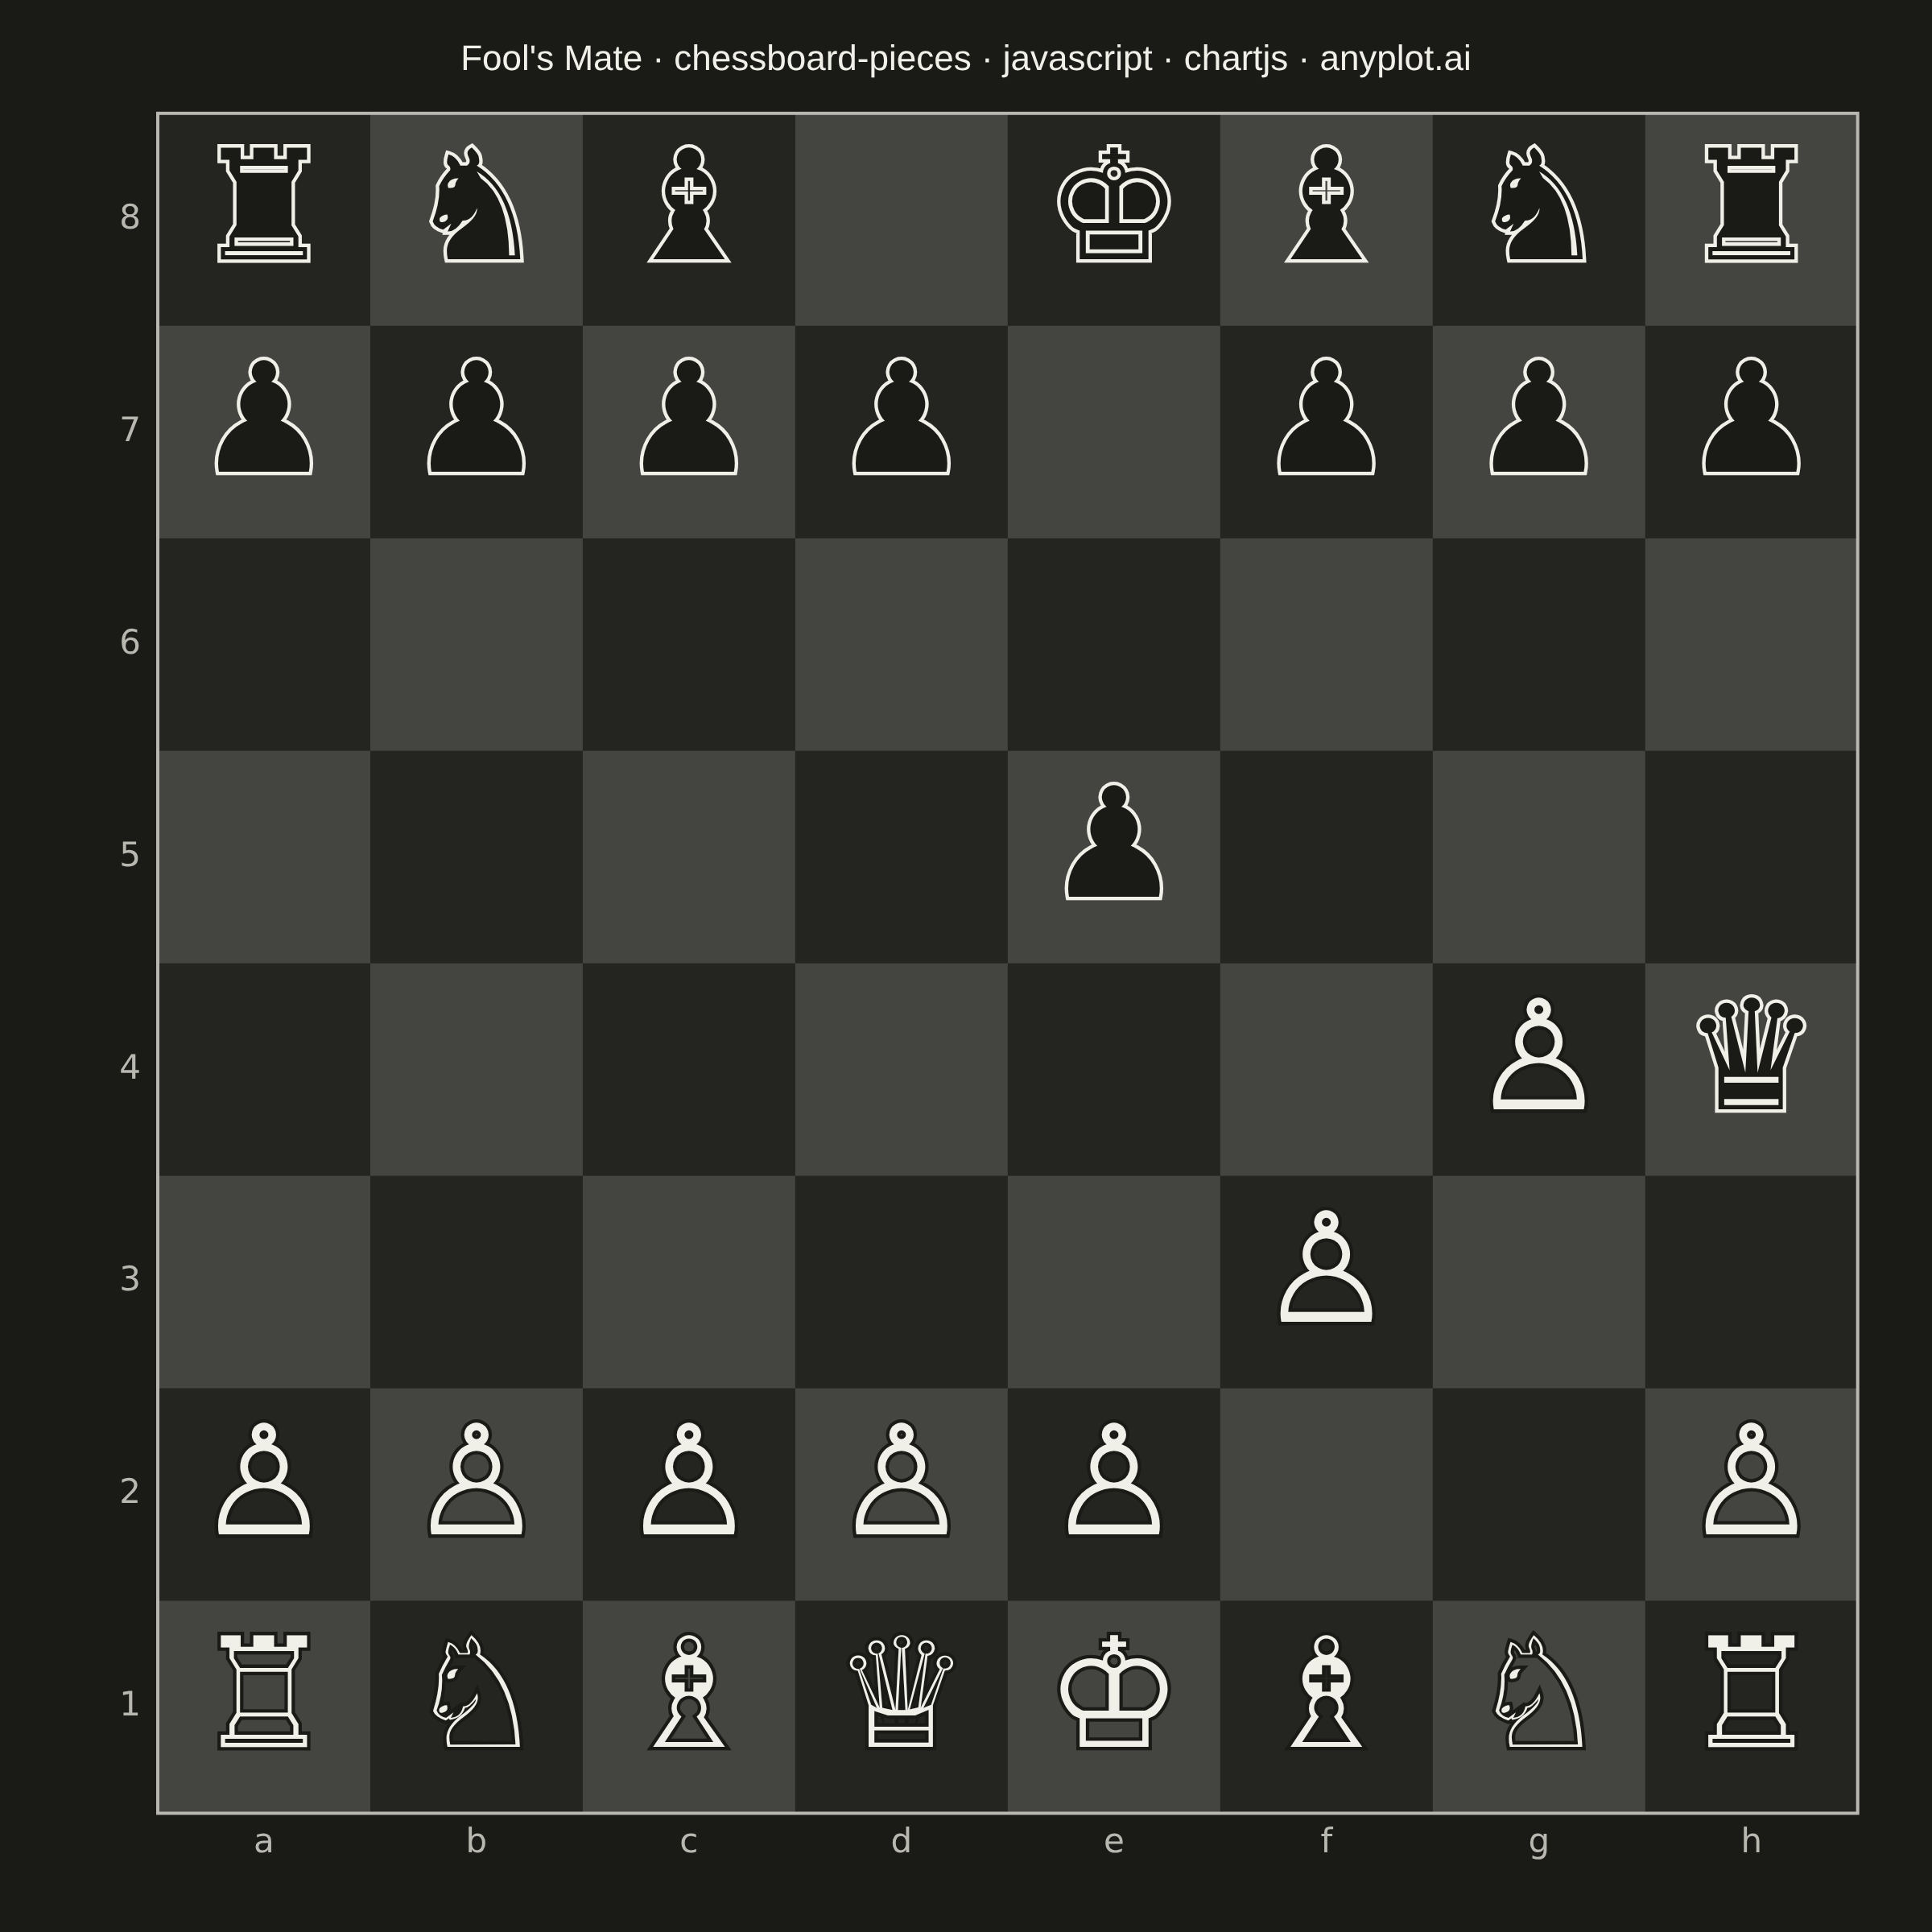
A chess board visualization with pieces that can be positioned programmatically to display specific game positions, puzzles, or notable games. Pieces are defined using a dictionary mapping squares (e.g., 'e4': 'K') to standard chess notation where uppercase letters represent white pieces (K/Q/R/B/N/P) and lowercase represent black pieces (k/q/r/b/n/p). Unicode chess symbols provide clean, recognizable piece rendering.
// anyplot.ai
// chessboard-pieces: Chess Board with Pieces for Position Diagrams
// Library: chartjs 4.4.7 | JavaScript 22.23.2
// Quality: 91/100 | Created: 2026-09-01
//# anyplot-orientation: square

const t = window.ANYPLOT_TOKENS;

// --- Data: Fool's Mate, the fastest possible checkmate ----------------------
// 1. f3 e5  2. g4 Qh4#
const FILES = ["a", "b", "c", "d", "e", "f", "g", "h"];
const WHITE_GLYPH = { K: "♔", Q: "♕", R: "♖", B: "♗", N: "♘", P: "♙" };
const BLACK_GLYPH = { k: "♚", q: "♛", r: "♜", b: "♝", n: "♞", p: "♟" };

const pieces = {
  a1: "R", b1: "N", c1: "B", d1: "Q", e1: "K", f1: "B", g1: "N", h1: "R",
  a2: "P", b2: "P", c2: "P", d2: "P", e2: "P", h2: "P", f3: "P", g4: "P",
  a7: "p", b7: "p", c7: "p", d7: "p", f7: "p", g7: "p", h7: "p", e5: "p",
  a8: "r", b8: "n", c8: "b", e8: "k", f8: "b", g8: "n", h8: "r", h4: "q",
};

// Chess armies keep a fixed black/white identity regardless of page theme,
// the same way an Imprint data color stays constant across light and dark.
const WHITE_PIECE = "#F0EFE8";
const BLACK_PIECE = "#1A1A17";
const isLightSquare = (file, rank) => (file + rank) % 2 === 1; // a1 dark, h1 light
const squareTint = (alpha) => (t.theme === "light" ? `rgba(26,26,23,${alpha})` : `rgba(240,239,232,${alpha})`);
const LIGHT_SQUARE = squareTint(0.05);
const DARK_SQUARE = squareTint(0.2);

// --- Mount -------------------------------------------------------------------
const canvas = document.createElement("canvas");
document.getElementById("container").appendChild(canvas);

// --- Board + piece rendering plugin ------------------------------------------
// Chart.js has no native board/grid chart type; a "scatter" chart with an empty
// dataset supplies the title plugin, theming and canvas lifecycle, while this
// plugin does the actual drawing against chart.chartArea (Chart.js's own
// plugin API — no external chartjs-chart-* package involved).
const chessBoardPlugin = {
  id: "chessBoard",
  afterDatasetsDraw(chart) {
    const { ctx, chartArea } = chart;
    const padLeft = chartArea.width * 0.045;
    const padBottom = chartArea.height * 0.045;
    const usableWidth = chartArea.width - padLeft;
    const usableHeight = chartArea.height - padBottom;
    const boardSize = Math.min(usableWidth, usableHeight);
    const boardLeft = chartArea.left + padLeft + (usableWidth - boardSize) / 2;
    const boardTop = chartArea.top + (usableHeight - boardSize) / 2;
    const cell = boardSize / 8;

    ctx.save();

    // Squares
    for (let file = 1; file <= 8; file++) {
      for (let rank = 1; rank <= 8; rank++) {
        const x = boardLeft + (file - 1) * cell;
        const y = boardTop + (8 - rank) * cell;
        ctx.fillStyle = isLightSquare(file, rank) ? LIGHT_SQUARE : DARK_SQUARE;
        ctx.fillRect(x, y, cell, cell);
      }
    }

    // Frame
    ctx.strokeStyle = t.inkSoft;
    ctx.lineWidth = 2;
    ctx.strokeRect(boardLeft, boardTop, boardSize, boardSize);

    // Coordinate labels
    const labelSize = Math.round(cell * 0.16);
    ctx.fillStyle = t.inkSoft;
    ctx.font = `${labelSize}px "DejaVu Sans", sans-serif`;
    ctx.textAlign = "center";
    ctx.textBaseline = "top";
    for (let file = 1; file <= 8; file++) {
      const x = boardLeft + (file - 1) * cell + cell / 2;
      ctx.fillText(FILES[file - 1], x, boardTop + boardSize + labelSize * 0.4);
    }
    ctx.textAlign = "right";
    ctx.textBaseline = "middle";
    for (let rank = 1; rank <= 8; rank++) {
      const y = boardTop + (8 - rank) * cell + cell / 2;
      ctx.fillText(String(rank), boardLeft - labelSize * 0.5, y);
    }

    // Pieces
    const pieceSize = Math.round(cell * 0.72);
    ctx.font = `${pieceSize}px "DejaVu Sans", sans-serif`;
    ctx.textAlign = "center";
    ctx.textBaseline = "middle";
    ctx.lineWidth = pieceSize * 0.045;
    for (const [square, code] of Object.entries(pieces)) {
      const file = FILES.indexOf(square[0]) + 1;
      const rank = Number(square[1]);
      const cx = boardLeft + (file - 1) * cell + cell / 2;
      const cy = boardTop + (8 - rank) * cell + cell / 2;
      const isWhite = code === code.toUpperCase();
      const glyph = isWhite ? WHITE_GLYPH[code] : BLACK_GLYPH[code];
      ctx.strokeStyle = isWhite ? BLACK_PIECE : WHITE_PIECE;
      ctx.fillStyle = isWhite ? WHITE_PIECE : BLACK_PIECE;
      ctx.strokeText(glyph, cx, cy);
      ctx.fillText(glyph, cx, cy);
    }

    ctx.restore();
    window.__anyplotReady = true;
  },
};
Chart.register(chessBoardPlugin);

// --- Chart ---------------------------------------------------------------
new Chart(canvas, {
  type: "scatter",
  data: { datasets: [{ data: [] }] },
  options: {
    responsive: true,
    maintainAspectRatio: false,
    animation: false,
    layout: { padding: 24 },
    plugins: {
      title: {
        display: true,
        text: "Fool's Mate · chessboard-pieces · javascript · chartjs · anyplot.ai",
        color: t.ink,
        font: { size: 22, weight: "500" },
        padding: { bottom: 20 },
      },
      legend: { display: false },
      tooltip: { enabled: false },
    },
    scales: {
      x: { display: false, min: 0, max: 1 },
      y: { display: false, min: 0, max: 1 },
    },
  },
});
Runnable source as JSON, for any HTTP client: https://api.anyplot.ai/specs/chessboard-pieces/chartjs/code. Any spec id and library id listed in llms-full.txt fit the same URL shape; every URL below is complete and callable.
{
  "spec_id": "chessboard-pieces",
  "language": "javascript",
  "library": "chartjs",
  "page": "https://anyplot.ai/chessboard-pieces/javascript/chartjs",
  "hub": "https://anyplot.ai/chessboard-pieces",
  "code_json": "https://api.anyplot.ai/specs/chessboard-pieces/chartjs/code",
  "spec_json": "https://api.anyplot.ai/specs/chessboard-pieces",
  "render_light_png": "https://storage.googleapis.com/anyplot-images/plots/chessboard-pieces/javascript/chartjs/plot-light.png",
  "render_dark_png": "https://storage.googleapis.com/anyplot-images/plots/chessboard-pieces/javascript/chartjs/plot-dark.png",
  "interactive_light_html": "https://storage.googleapis.com/anyplot-images/plots/chessboard-pieces/javascript/chartjs/plot-light.html",
  "interactive_dark_html": "https://storage.googleapis.com/anyplot-images/plots/chessboard-pieces/javascript/chartjs/plot-dark.html",
  "quality_score": 91.0,
  "license": "MIT",
  "guide": "https://anyplot.ai/llms.txt"
}
Part of Chess Board with Pieces for Position Diagrams on anyplot.ai.