The same plot in 14 other libraries — JavaScript: Chart.js, D3.js, Highcharts, MUI X Charts; Python: Altair, Bokeh, lets-plot, Matplotlib, Plotly, plotnine, Pygal, Seaborn; R: ggplot2; Julia: Makie.jl. Compare all 15 side by side: Chess Board with Pieces for Position Diagrams in Python, R, Julia and JavaScript.
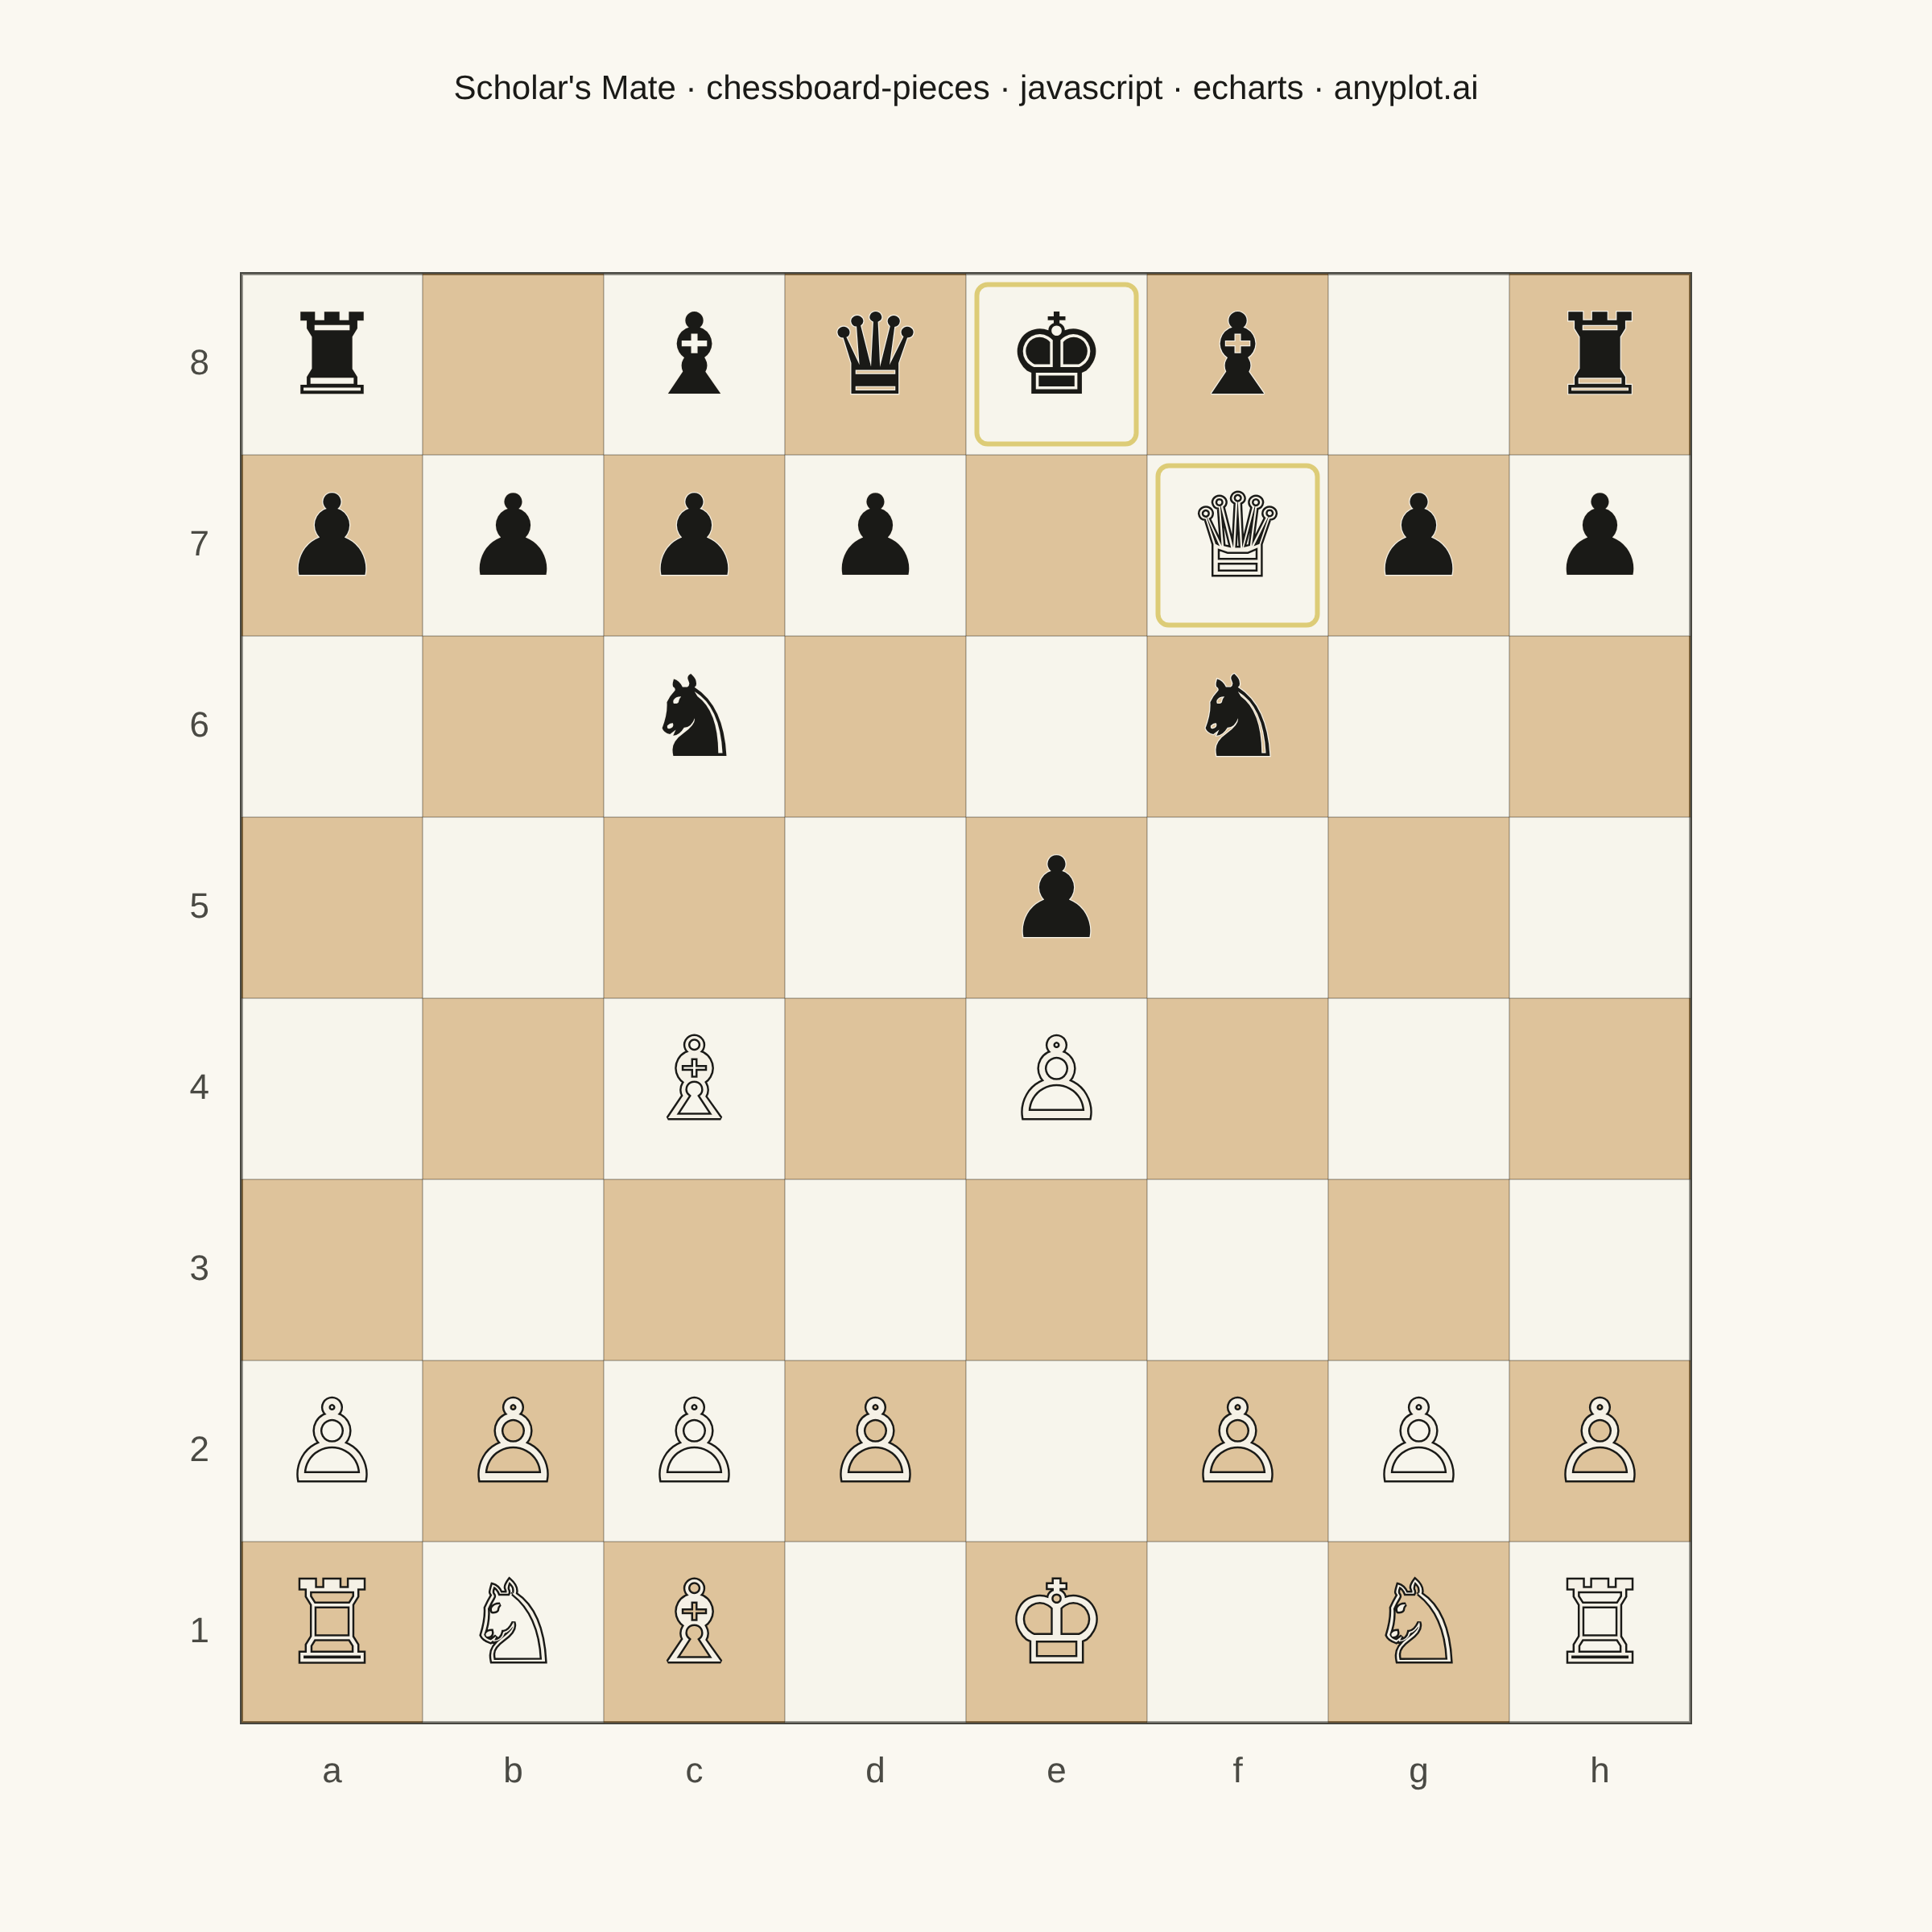
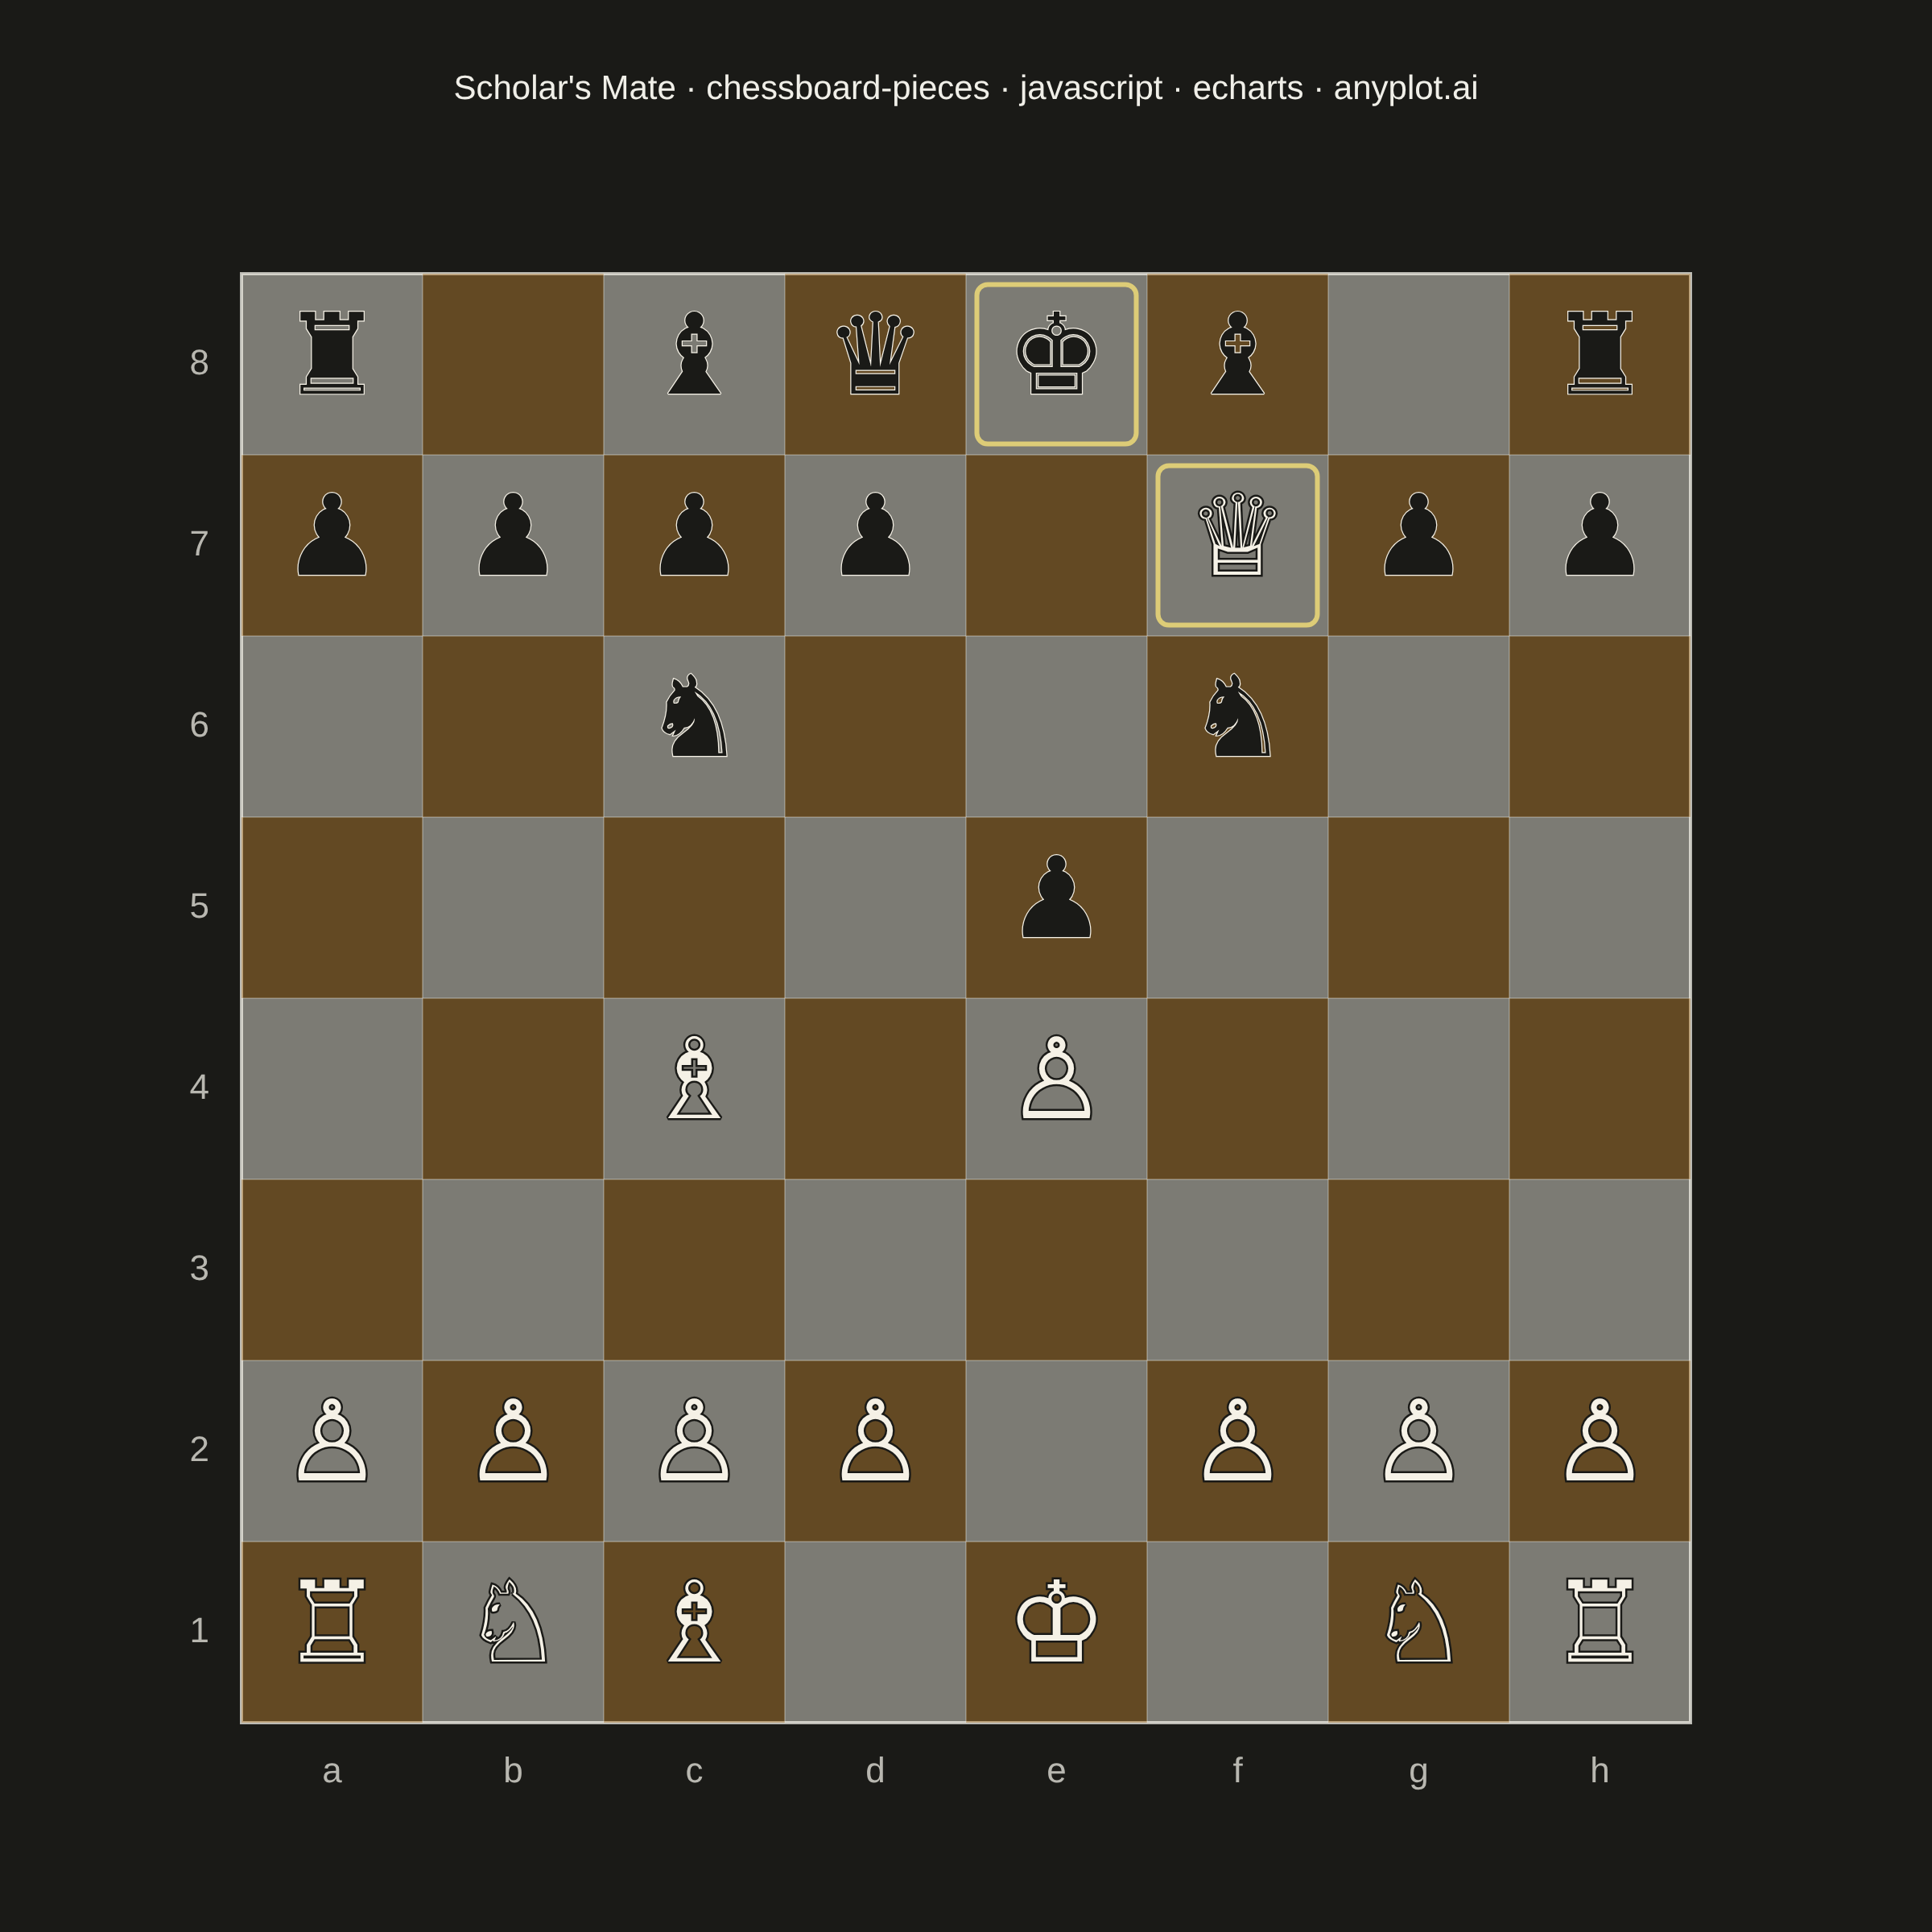
A chess board visualization with pieces that can be positioned programmatically to display specific game positions, puzzles, or notable games. Pieces are defined using a dictionary mapping squares (e.g., 'e4': 'K') to standard chess notation where uppercase letters represent white pieces (K/Q/R/B/N/P) and lowercase represent black pieces (k/q/r/b/n/p). Unicode chess symbols provide clean, recognizable piece rendering.
// anyplot.ai
// chessboard-pieces: Chess Board with Pieces for Position Diagrams
// Library: echarts 6.1.0 | JavaScript 22.23.2
// Quality: 92/100 | Created: 2026-09-01
//# anyplot-orientation: square

const t = window.ANYPLOT_TOKENS;

// --- Data (in-memory, deterministic) ----------------------------------------
// Scholar's Mate, final position after 1.e4 e5 2.Bc4 Nc6 3.Qh5 Nf6?? 4.Qxf7#
const FILES = ["a", "b", "c", "d", "e", "f", "g", "h"];
const RANKS = ["1", "2", "3", "4", "5", "6", "7", "8"];

const PIECES = {
  a1: "R", b1: "N", c1: "B", e1: "K", g1: "N", h1: "R", c4: "B", f7: "Q",
  a2: "P", b2: "P", c2: "P", d2: "P", e4: "P", f2: "P", g2: "P", h2: "P",
  a8: "r", c8: "b", d8: "q", e8: "k", f8: "b", h8: "r", c6: "n", f6: "n",
  a7: "p", b7: "p", c7: "p", d7: "p", e5: "p", g7: "p", h7: "p",
};

const PIECE_GLYPH = {
  K: "♔", Q: "♕", R: "♖", B: "♗", N: "♘", P: "♙",
  k: "♚", q: "♛", r: "♜", b: "♝", n: "♞", p: "♟",
};

// Chess white/black is a stronger real-world color convention than the
// abstract Imprint categorical order (Imprint semantic exception — see
// default-style-guide.md), so piece color stays a fixed ivory/ink pair
// independent of theme, exactly like the Imprint categorical hues stay
// constant across light/dark.
const PIECE_WHITE_FILL = "#F5F1E6";
const PIECE_WHITE_STROKE = "#1A1A17";
const PIECE_BLACK_FILL = "#1A1A17";
const PIECE_BLACK_STROKE = "#F5F1E6";

// Board squares: light square at h1, standard orientation (white at bottom).
// Both square tones are alpha-blends over the page background rather than a
// solid theme token, so the light/dark luminance ordering stays correct in
// both themes (a solid t.elevatedBg is nearly black in dark mode, which would
// read *darker* than the ochre-blended dark square). Dark squares use the
// Imprint ochre hue — the palette's documented "wood" semantic anchor.
const LIGHT_SQUARE = "rgba(245, 241, 230, 0.45)";
const DARK_SQUARE = "rgba(189, 130, 51, 0.45)";

// Checkmate emphasis: 4.Qxf7# — the queen delivers mate from f7, checking the
// king on e8. A soft amber outline on those two squares calls out the
// decisive move without adding chart junk (pieces + squares stay untouched).
const HIGHLIGHT_SQUARES = new Set(["f7", "e8"]);

const squares = [];
FILES.forEach((file, col) => {
  RANKS.forEach((rank, row) => {
    const isLight = (col + row) % 2 === 1;
    squares.push([file, rank, isLight ? 1 : 0]);
  });
});

const pieces = Object.keys(PIECES).map((square) => {
  const file = square[0];
  const rank = square[1];
  const code = PIECES[square];
  const isWhite = code === code.toUpperCase();
  return [file, rank, PIECE_GLYPH[code], isWhite ? 1 : 0];
});

const highlights = [...HIGHLIGHT_SQUARES].map((square) => [square[0], square[1]]);

// --- Init ---------------------------------------------------------------
const chart = echarts.init(document.getElementById("container"));

// --- Option ---------------------------------------------------------------
const title = "Scholar's Mate · chessboard-pieces · javascript · echarts · anyplot.ai";

chart.setOption({
  animation: false,
  backgroundColor: "transparent",
  title: {
    text: title,
    left: "center",
    top: 40,
    textStyle: { color: t.ink, fontSize: 21, fontWeight: 500 },
  },
  grid: {
    left: "center",
    top: 170,
    width: 900,
    height: 900,
    show: true,
    borderColor: t.inkSoft,
    borderWidth: 2,
    backgroundColor: "transparent",
  },
  xAxis: {
    type: "category",
    data: FILES,
    position: "bottom",
    axisLine: { show: false },
    axisTick: { show: false },
    splitLine: { show: false },
    axisLabel: { color: t.inkSoft, fontSize: 22, margin: 20 },
  },
  yAxis: {
    type: "category",
    data: RANKS,
    axisLine: { show: false },
    axisTick: { show: false },
    splitLine: { show: false },
    axisLabel: { color: t.inkSoft, fontSize: 22, margin: 20 },
  },
  series: [
    {
      type: "custom",
      coordinateSystem: "cartesian2d",
      data: squares,
      renderItem: (params, api) => {
        const isLight = api.value(2) === 1;
        const center = api.coord([api.value(0), api.value(1)]);
        const size = api.size([1, 1]);
        return {
          type: "rect",
          shape: {
            x: center[0] - size[0] / 2,
            y: center[1] - size[1] / 2,
            width: size[0],
            height: size[1],
          },
          style: {
            fill: isLight ? LIGHT_SQUARE : DARK_SQUARE,
            stroke: t.grid,
            lineWidth: 1,
          },
          silent: true,
        };
      },
      z: 1,
    },
    {
      type: "custom",
      coordinateSystem: "cartesian2d",
      data: highlights,
      renderItem: (params, api) => {
        const center = api.coord([api.value(0), api.value(1)]);
        const size = api.size([1, 1]);
        const inset = Math.min(size[0], size[1]) * 0.06;
        return {
          type: "rect",
          shape: {
            x: center[0] - size[0] / 2 + inset,
            y: center[1] - size[1] / 2 + inset,
            width: size[0] - inset * 2,
            height: size[1] - inset * 2,
            r: inset,
          },
          style: {
            fill: "transparent",
            stroke: t.amber,
            lineWidth: 3,
          },
          silent: true,
        };
      },
      z: 2,
    },
    {
      type: "custom",
      coordinateSystem: "cartesian2d",
      data: pieces,
      renderItem: (params, api) => {
        const isWhite = api.value(3) === 1;
        const center = api.coord([api.value(0), api.value(1)]);
        const size = api.size([1, 1]);
        const fontSize = Math.min(size[0], size[1]) * 0.62;
        return {
          type: "text",
          style: {
            text: api.value(2),
            x: center[0],
            y: center[1],
            textAlign: "center",
            textVerticalAlign: "middle",
            fontSize,
            fontFamily: '"Noto Sans Symbols 2", "DejaVu Sans", "Segoe UI Symbol", sans-serif',
            fill: isWhite ? PIECE_WHITE_FILL : PIECE_BLACK_FILL,
            stroke: isWhite ? PIECE_WHITE_STROKE : PIECE_BLACK_STROKE,
            lineWidth: isWhite ? 2.5 : 1.2,
          },
          silent: true,
        };
      },
      z: 3,
    },
  ],
});

chart.on("finished", () => {
  window.__anyplotReady = true;
});
Runnable source as JSON, for any HTTP client: https://api.anyplot.ai/specs/chessboard-pieces/echarts/code. Any spec id and library id listed in llms-full.txt fit the same URL shape; every URL below is complete and callable.
{
  "spec_id": "chessboard-pieces",
  "language": "javascript",
  "library": "echarts",
  "page": "https://anyplot.ai/chessboard-pieces/javascript/echarts",
  "hub": "https://anyplot.ai/chessboard-pieces",
  "code_json": "https://api.anyplot.ai/specs/chessboard-pieces/echarts/code",
  "spec_json": "https://api.anyplot.ai/specs/chessboard-pieces",
  "render_light_png": "https://storage.googleapis.com/anyplot-images/plots/chessboard-pieces/javascript/echarts/plot-light.png",
  "render_dark_png": "https://storage.googleapis.com/anyplot-images/plots/chessboard-pieces/javascript/echarts/plot-dark.png",
  "interactive_light_html": "https://storage.googleapis.com/anyplot-images/plots/chessboard-pieces/javascript/echarts/plot-light.html",
  "interactive_dark_html": "https://storage.googleapis.com/anyplot-images/plots/chessboard-pieces/javascript/echarts/plot-dark.html",
  "quality_score": 92.0,
  "license": "MIT",
  "guide": "https://anyplot.ai/llms.txt"
}
Part of Chess Board with Pieces for Position Diagrams on anyplot.ai.