The same plot in 14 other libraries — Python: Altair, Bokeh, lets-plot, Matplotlib, Plotly, plotnine, Seaborn; R: ggplot2; Julia: Makie.jl; JavaScript: Chart.js, D3.js, Apache ECharts, Highcharts, MUI X Charts. Compare all 15 side by side: Dot Matrix Chart for Proportional Counts in Python, R, Julia and JavaScript.
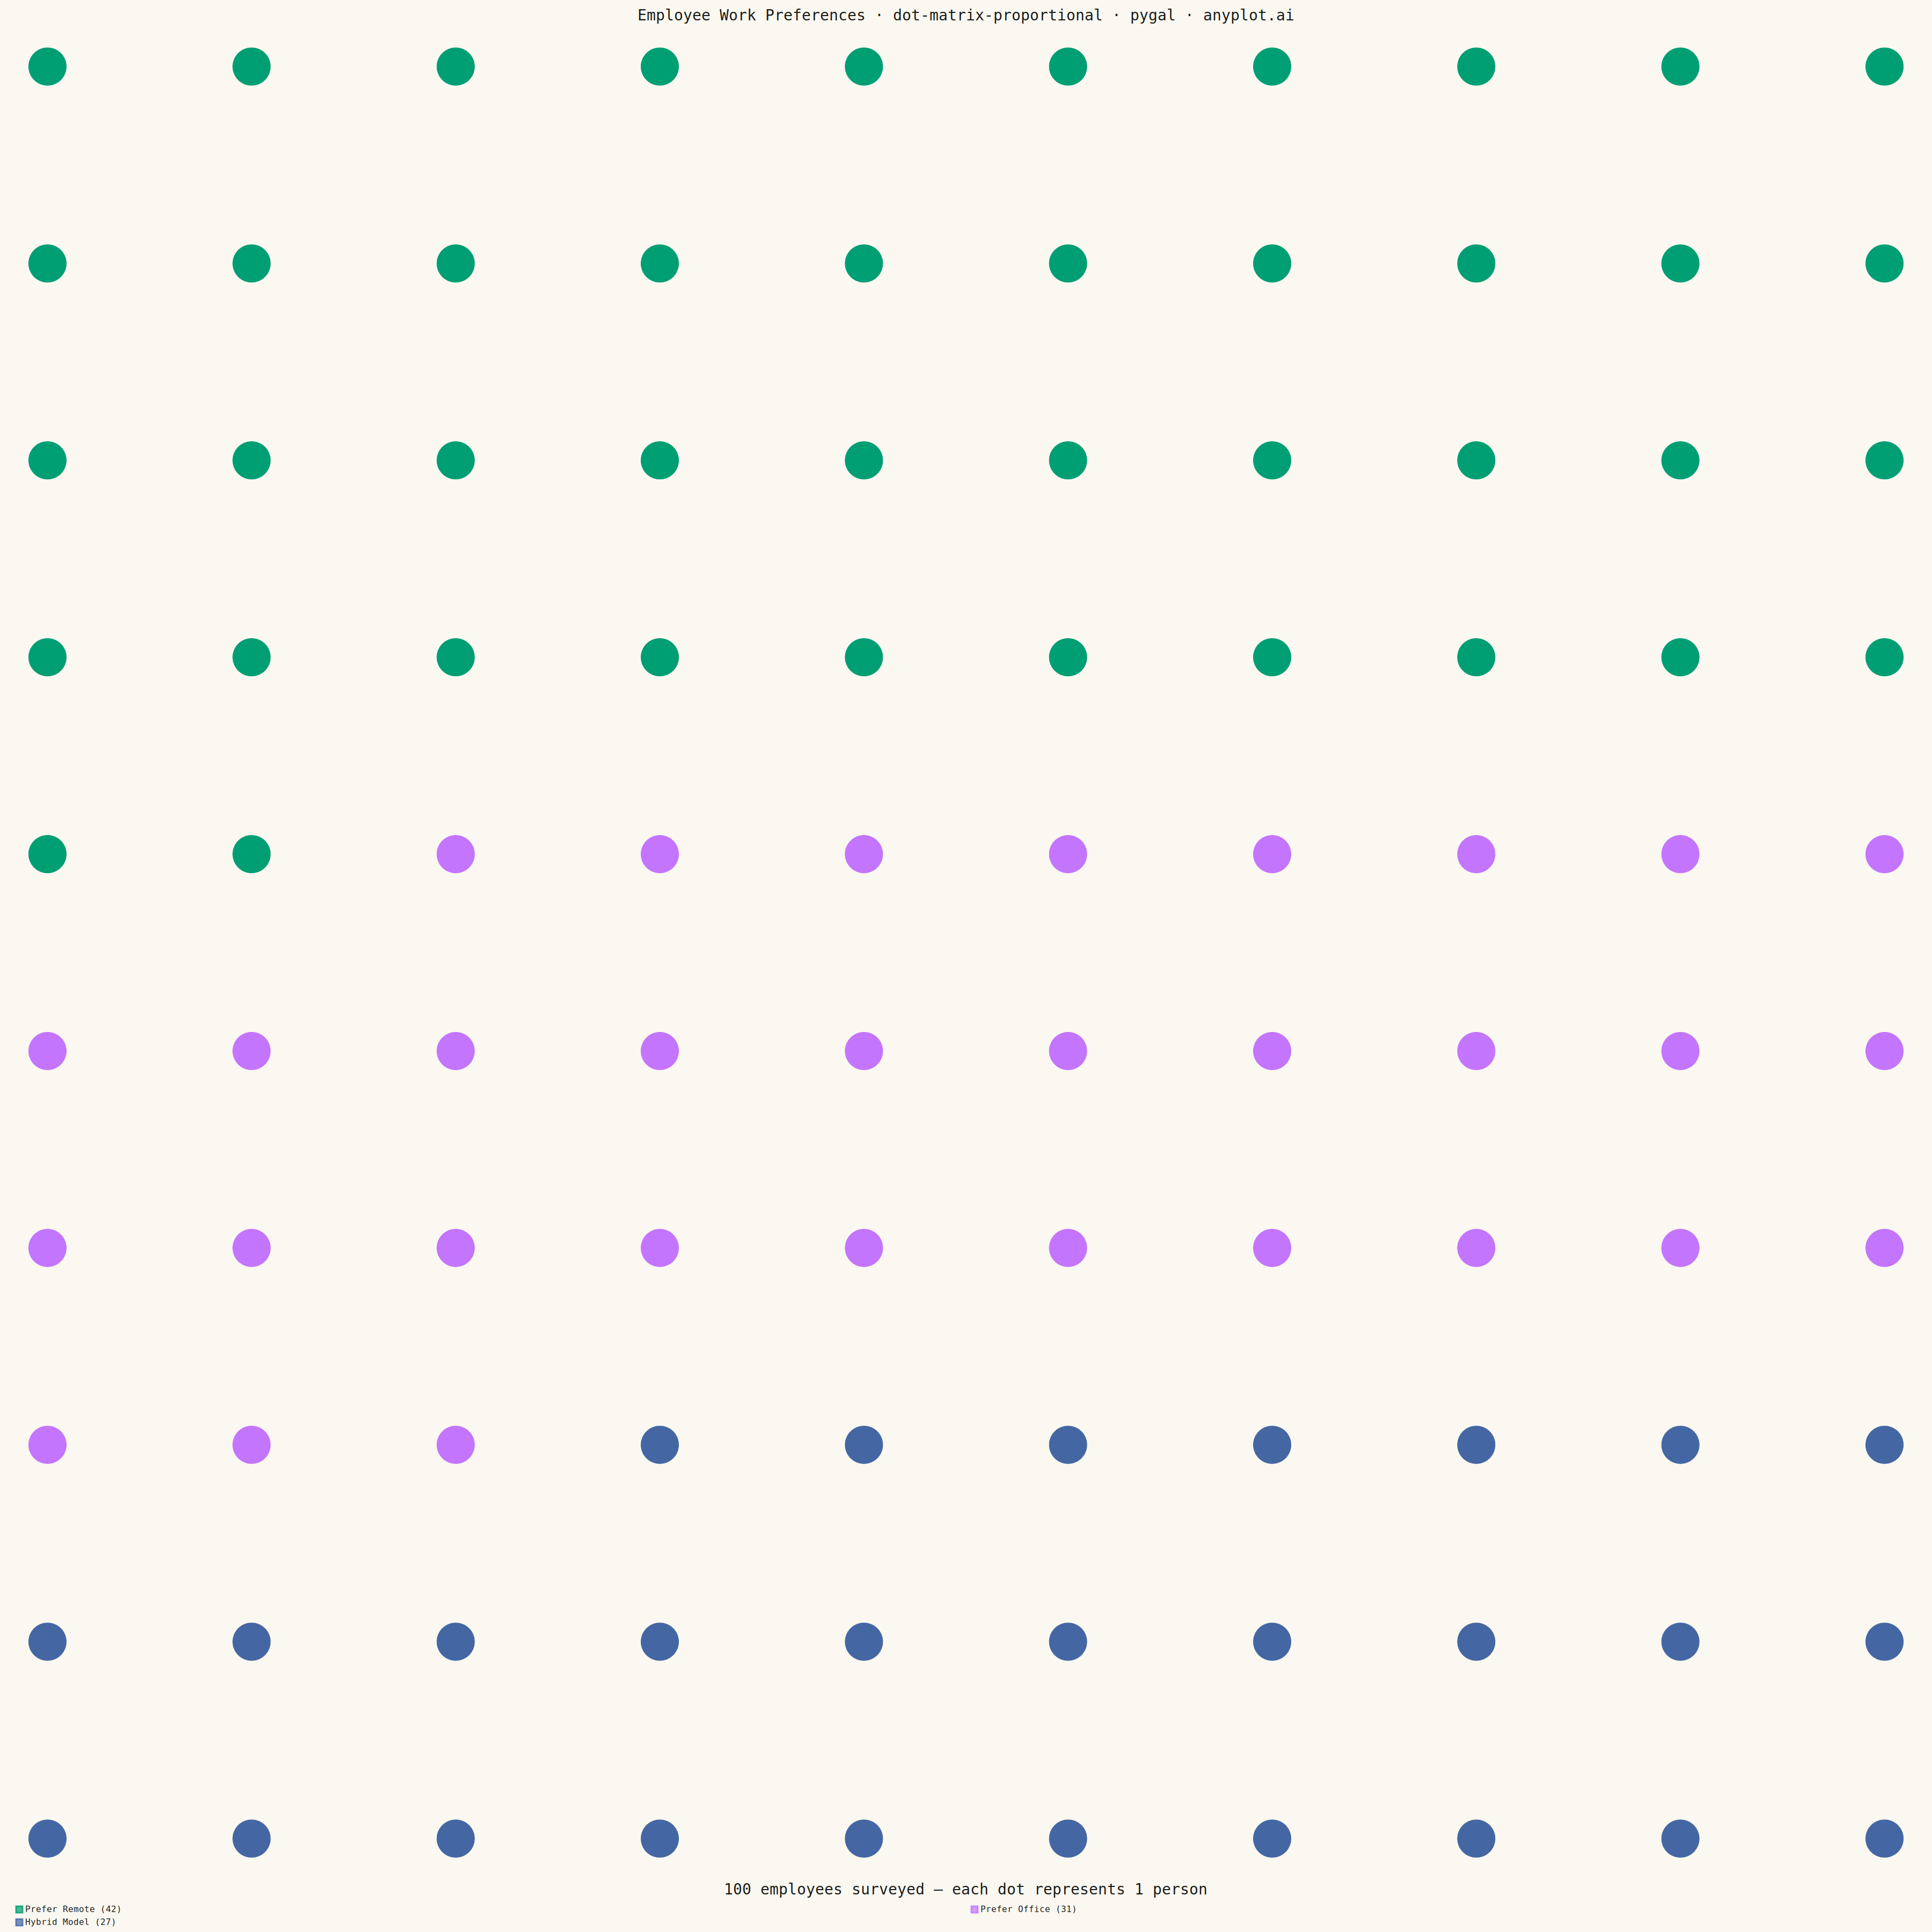
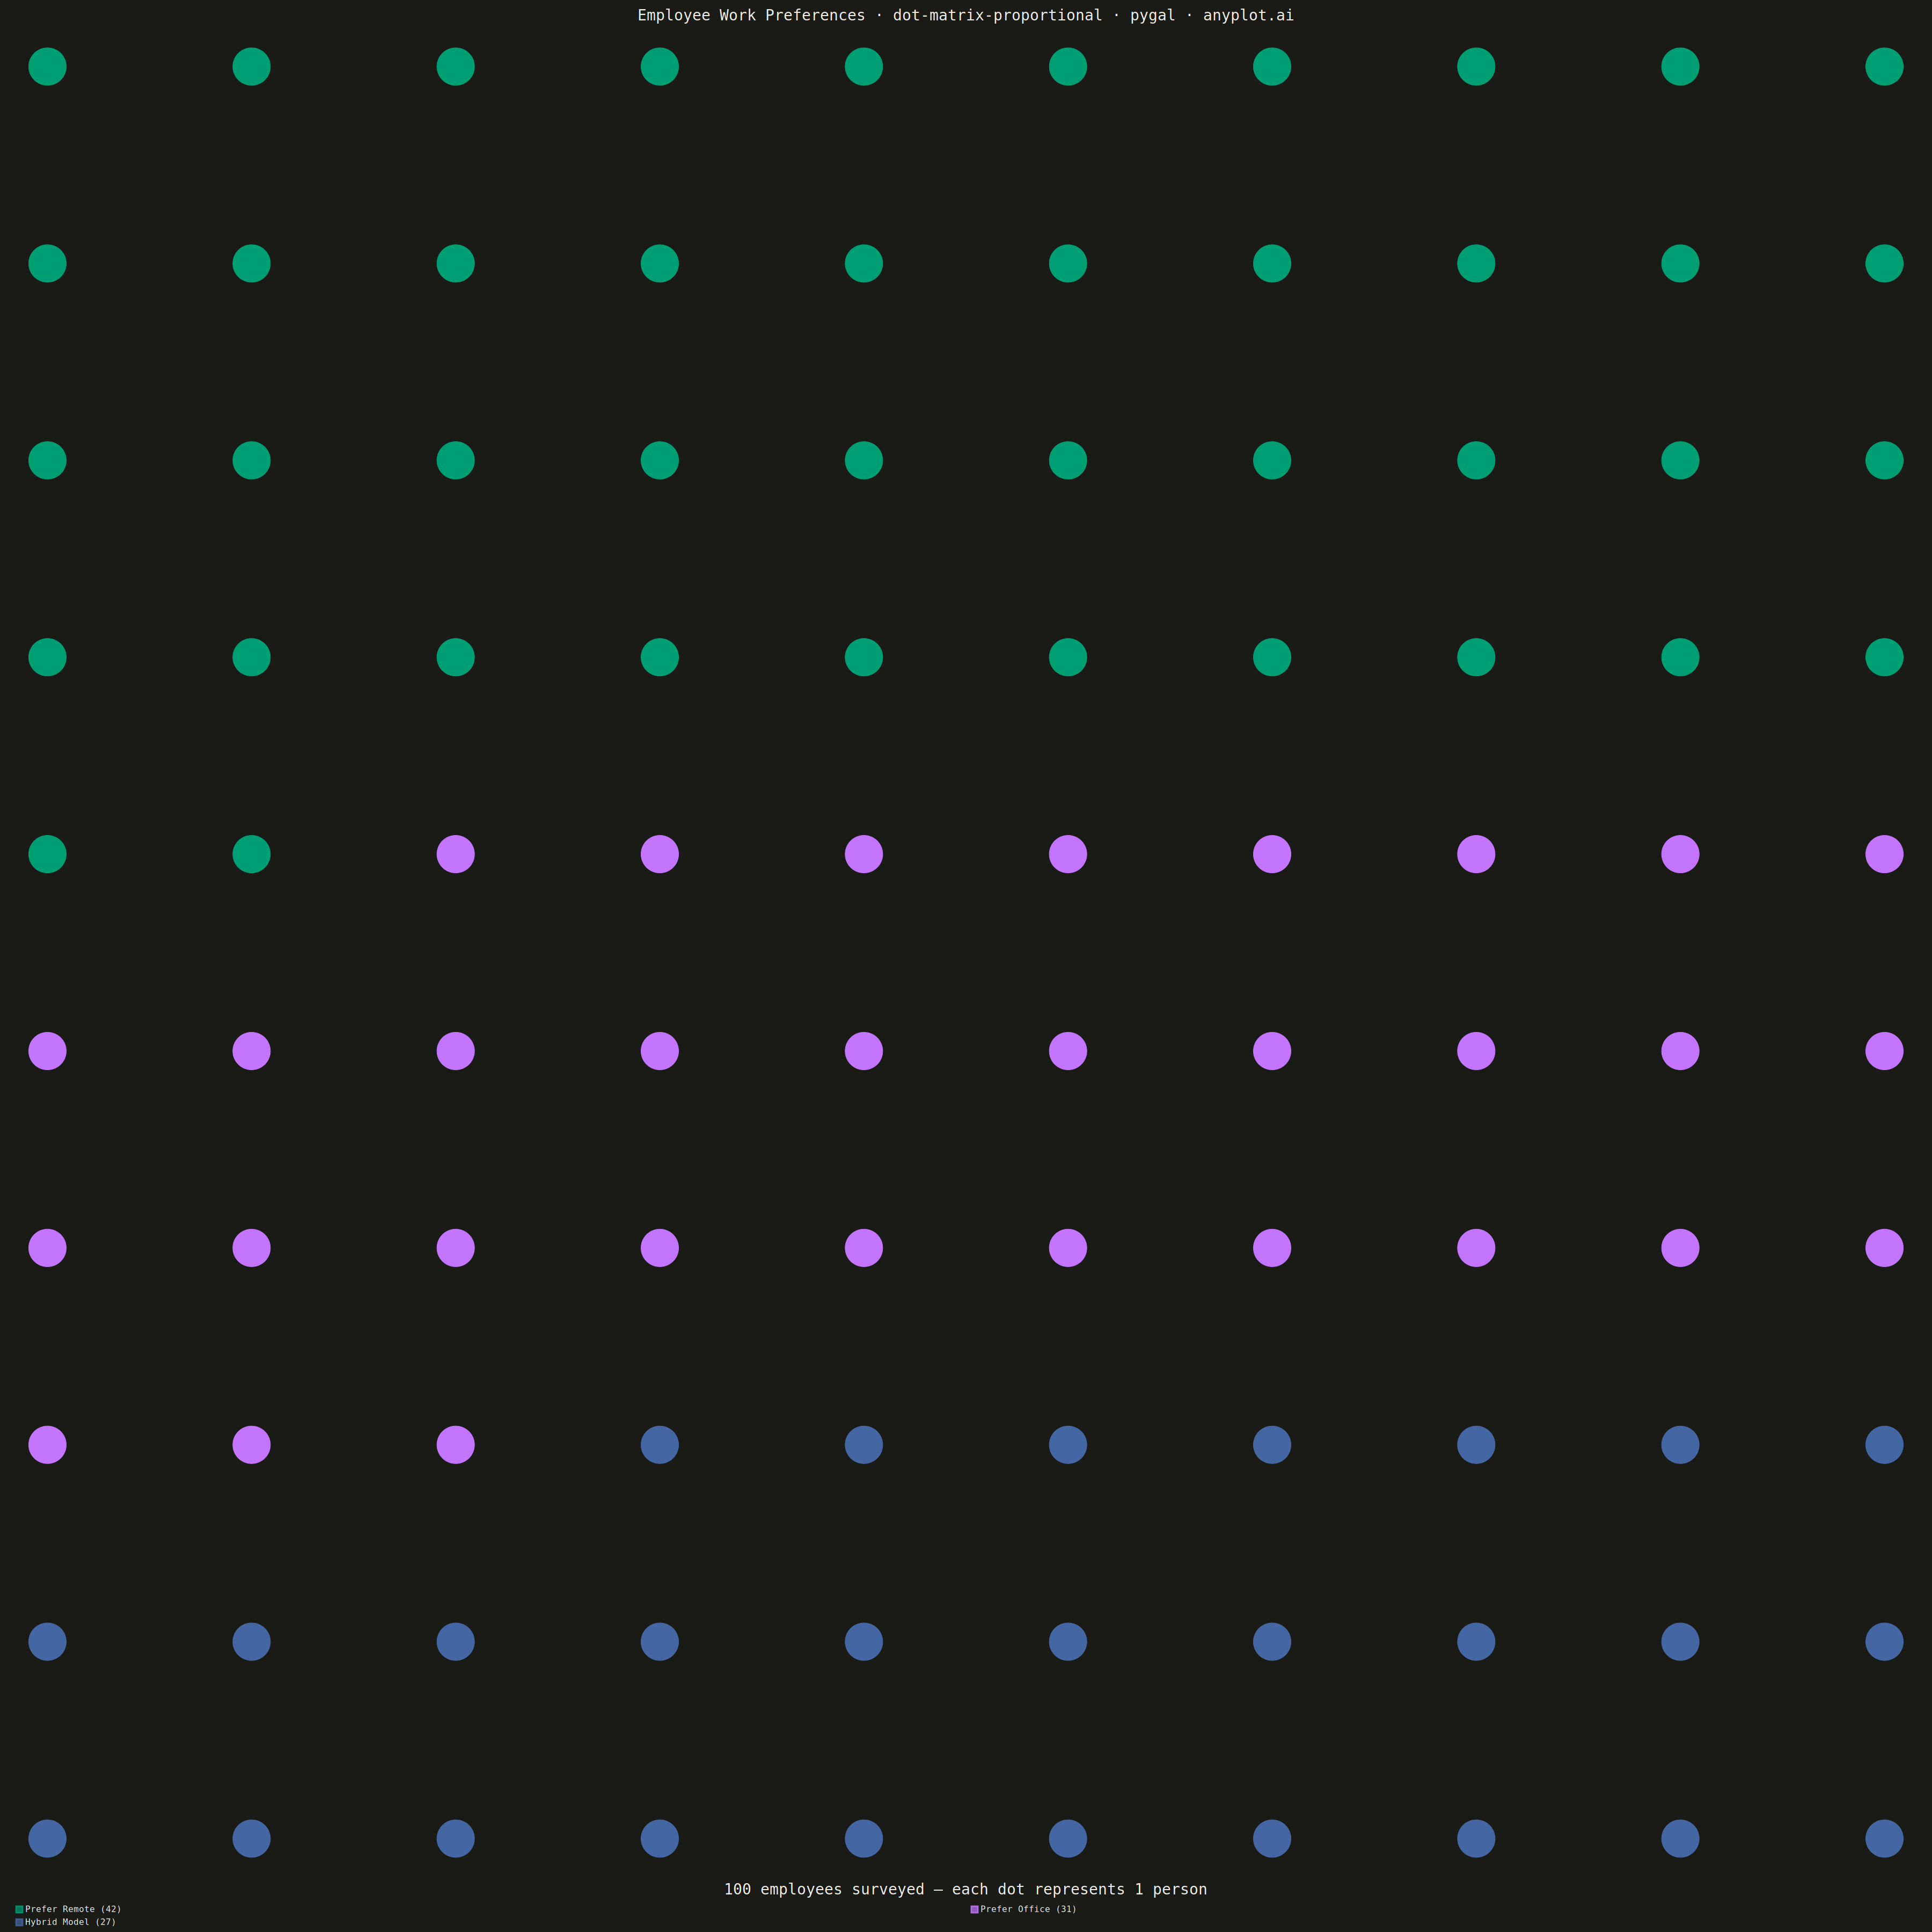
A dot matrix chart displays proportions using a grid of equally-sized dots where filled or colored dots represent counts out of a total. Each dot corresponds to one unit, making it intuitive to read "X out of N" statistics at a glance. Unlike waffle charts that use percentage-based squares, dot matrix charts emphasize absolute counts with variable grid sizes, excelling at risk communication and survey result visualization.
""" anyplot.ai
dot-matrix-proportional: Dot Matrix Chart for Proportional Counts
Library: pygal 3.1.0 | Python 3.13.13
Quality: 82/100 | Created: 2026-05-08
"""

import os

import pygal
from pygal.style import Style


# Theme tokens
THEME = os.getenv("ANYPLOT_THEME", "light")
PAGE_BG = "#FAF8F1" if THEME == "light" else "#1A1A17"
INK = "#1A1A17" if THEME == "light" else "#F0EFE8"
INK_MUTED = "#6B6A63" if THEME == "light" else "#A8A79F"

IMPRINT = ("#009E73", "#C475FD", "#4467A3", "#BD8233", "#AE3030", "#2ABCCD", "#954477")

# Data: employee work-preference survey (100 respondents)
categories = [("Prefer Remote", 42), ("Prefer Office", 31), ("Hybrid Model", 27)]
total = 100
cols = 10
rows = total // cols  # 10

# Build grid positions: fill left-to-right, top-to-bottom
all_positions = []
for idx in range(total):
    col = idx % cols
    row = idx // cols
    all_positions.append((float(col), float((rows - 1) - row)))

# Assign positions to each category in order
cat_series = []
start = 0
for name, count in categories:
    cat_series.append((name, count, all_positions[start : start + count]))
    start += count

# Style
custom_style = Style(
    background=PAGE_BG,
    plot_background=PAGE_BG,
    foreground=INK,
    foreground_strong=INK,
    foreground_subtle=INK_MUTED,
    colors=IMPRINT,
    title_font_size=28,
    label_font_size=18,
    major_label_font_size=16,
    legend_font_size=16,
    value_font_size=14,
    stroke_width=3,
)

# Chart — XY scatter with stroke=False gives a pure dot matrix
chart = pygal.XY(
    style=custom_style,
    width=3600,
    height=3600,
    title="Employee Work Preferences · dot-matrix-proportional · pygal · anyplot.ai",
    stroke=False,
    dots_size=35,
    show_x_guides=False,
    show_y_guides=False,
    show_x_labels=False,
    show_y_labels=False,
    legend_at_bottom=True,
    x_title="100 employees surveyed  —  each dot represents 1 person",
)

for name, count, positions in cat_series:
    chart.add(f"{name}  ({count})", positions)

# Save
chart.render_to_png(f"plot-{THEME}.png")
with open(f"plot-{THEME}.html", "wb") as f:
    f.write(chart.render())
Runnable source as JSON, for any HTTP client: https://api.anyplot.ai/specs/dot-matrix-proportional/pygal/code. Any spec id and library id listed in llms-full.txt fit the same URL shape; every URL below is complete and callable.
{
  "spec_id": "dot-matrix-proportional",
  "language": "python",
  "library": "pygal",
  "page": "https://anyplot.ai/dot-matrix-proportional/python/pygal",
  "hub": "https://anyplot.ai/dot-matrix-proportional",
  "code_json": "https://api.anyplot.ai/specs/dot-matrix-proportional/pygal/code",
  "spec_json": "https://api.anyplot.ai/specs/dot-matrix-proportional",
  "render_light_png": "https://storage.googleapis.com/anyplot-images/plots/dot-matrix-proportional/python/pygal/plot-light.png",
  "render_dark_png": "https://storage.googleapis.com/anyplot-images/plots/dot-matrix-proportional/python/pygal/plot-dark.png",
  "interactive_light_html": "https://storage.googleapis.com/anyplot-images/plots/dot-matrix-proportional/python/pygal/plot-light.html",
  "interactive_dark_html": "https://storage.googleapis.com/anyplot-images/plots/dot-matrix-proportional/python/pygal/plot-dark.html",
  "quality_score": 82.0,
  "license": "MIT",
  "guide": "https://anyplot.ai/llms.txt"
}
Part of Dot Matrix Chart for Proportional Counts on anyplot.ai.