The same plot in 14 other libraries — Python: Altair, Bokeh, lets-plot, Matplotlib, Plotly, plotnine, Pygal; R: ggplot2; Julia: Makie.jl; JavaScript: Chart.js, D3.js, Apache ECharts, Highcharts, MUI X Charts. Compare all 15 side by side: Dot Matrix Chart for Proportional Counts in Python, R, Julia and JavaScript.
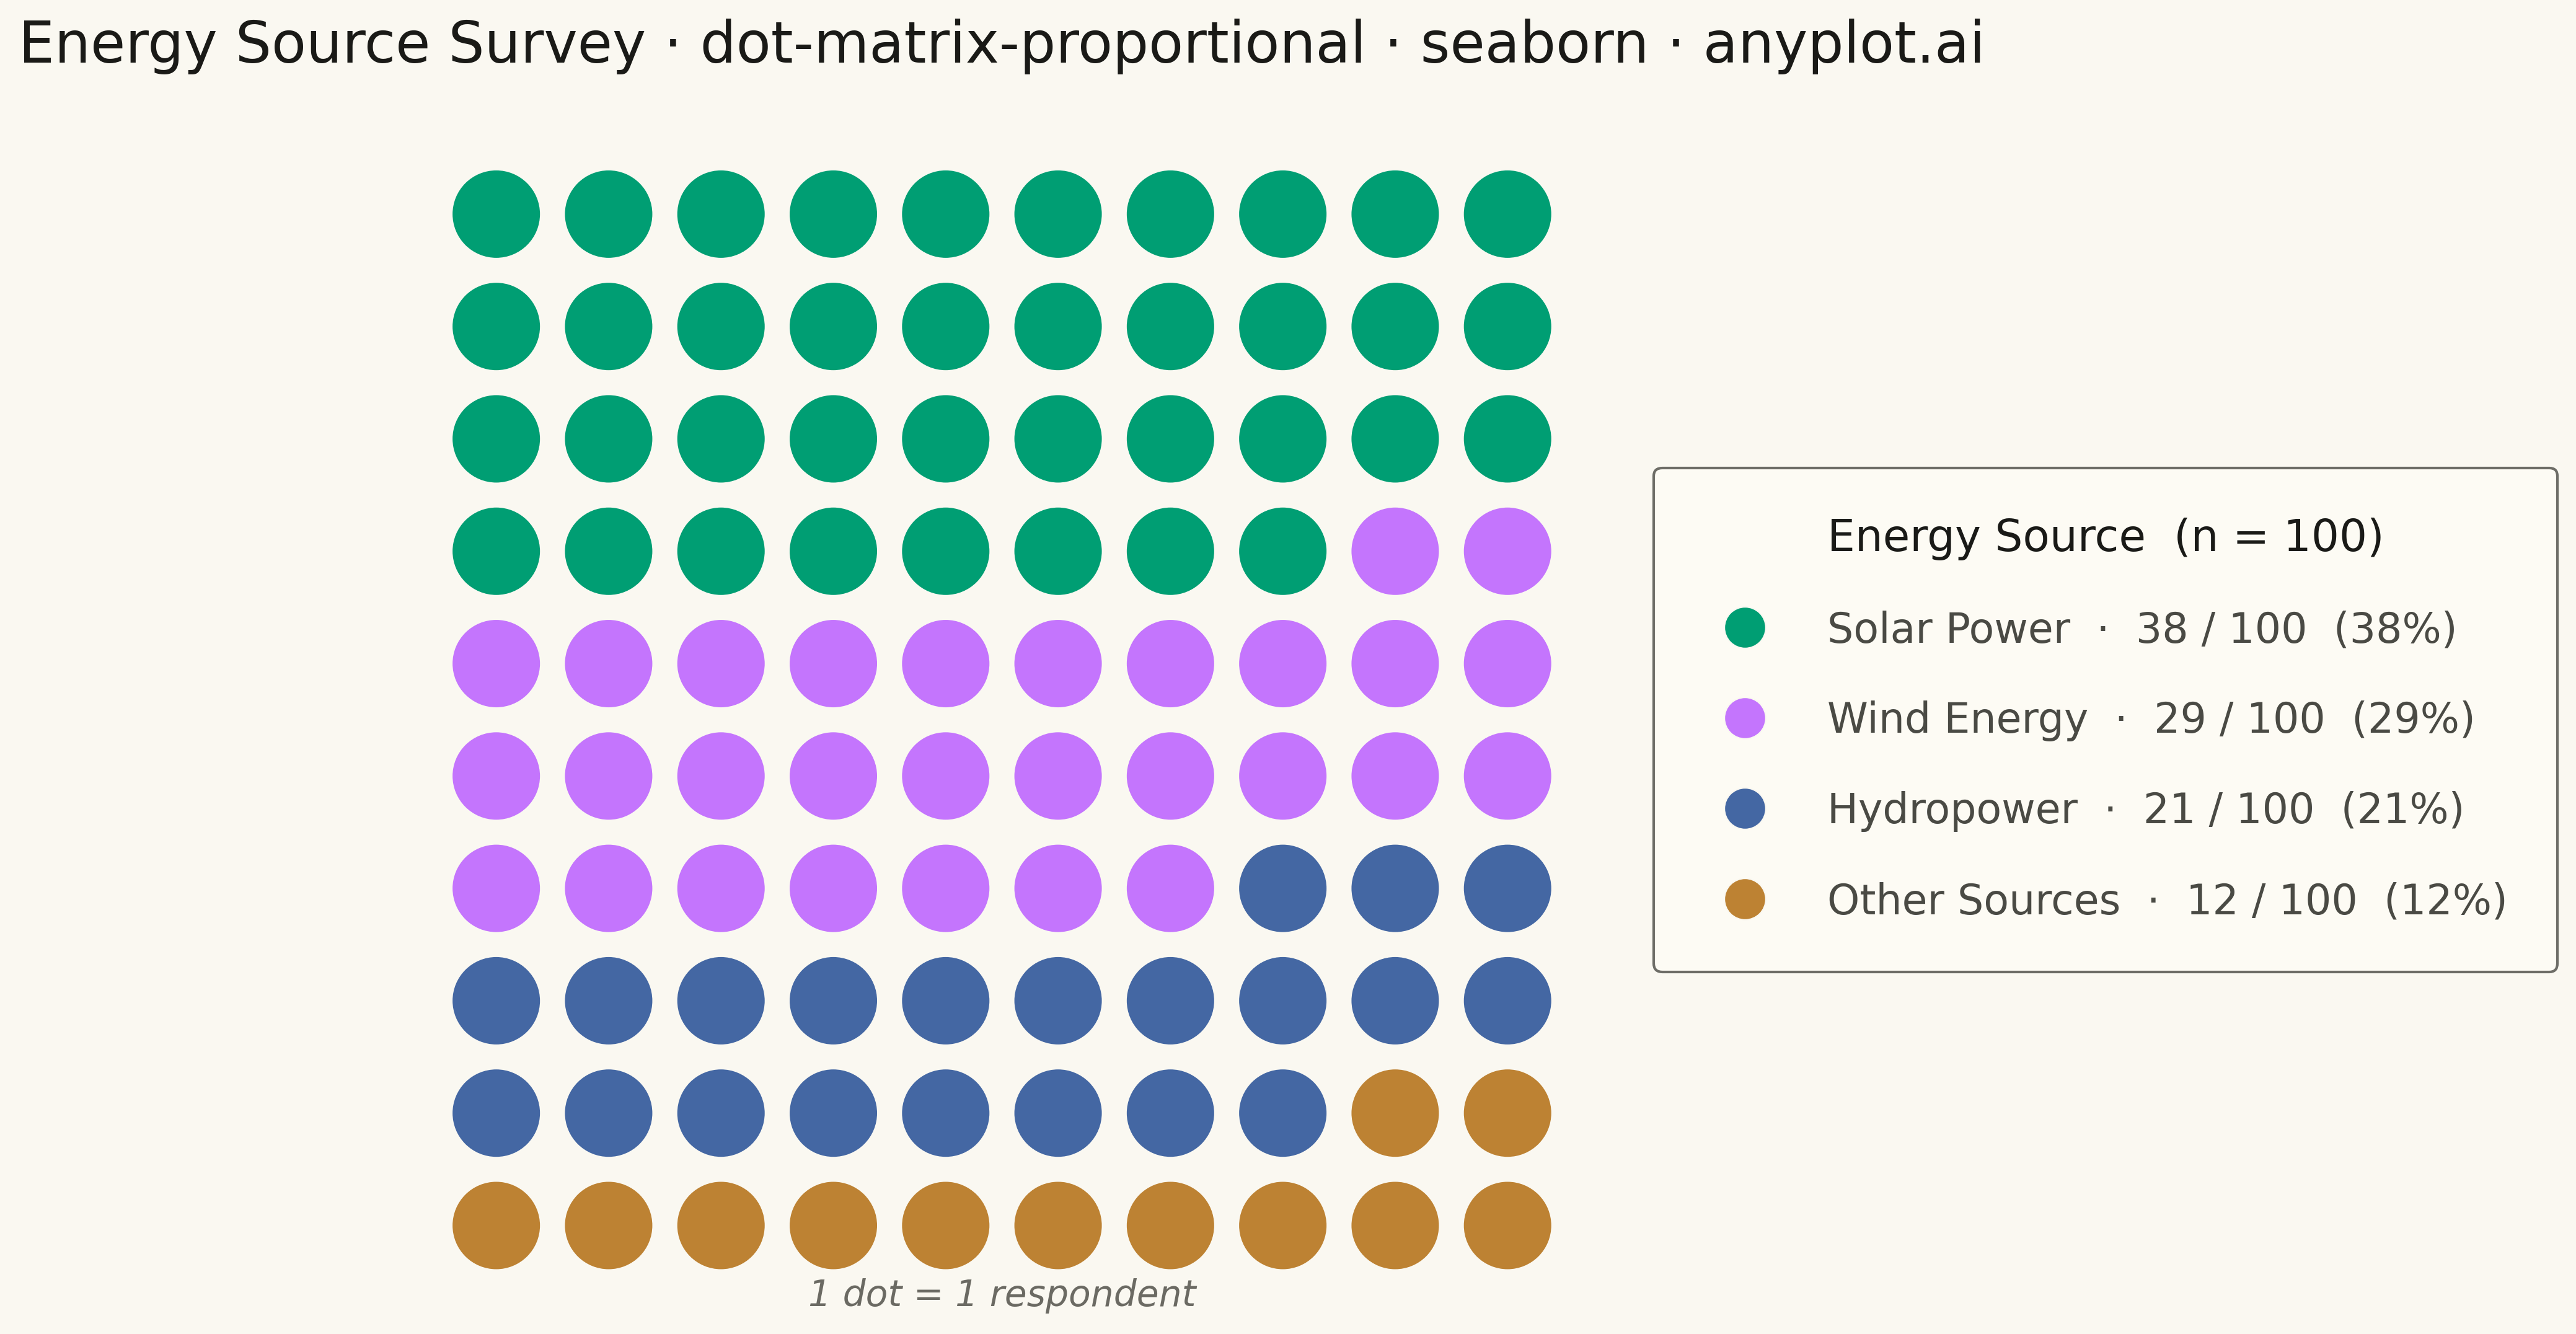
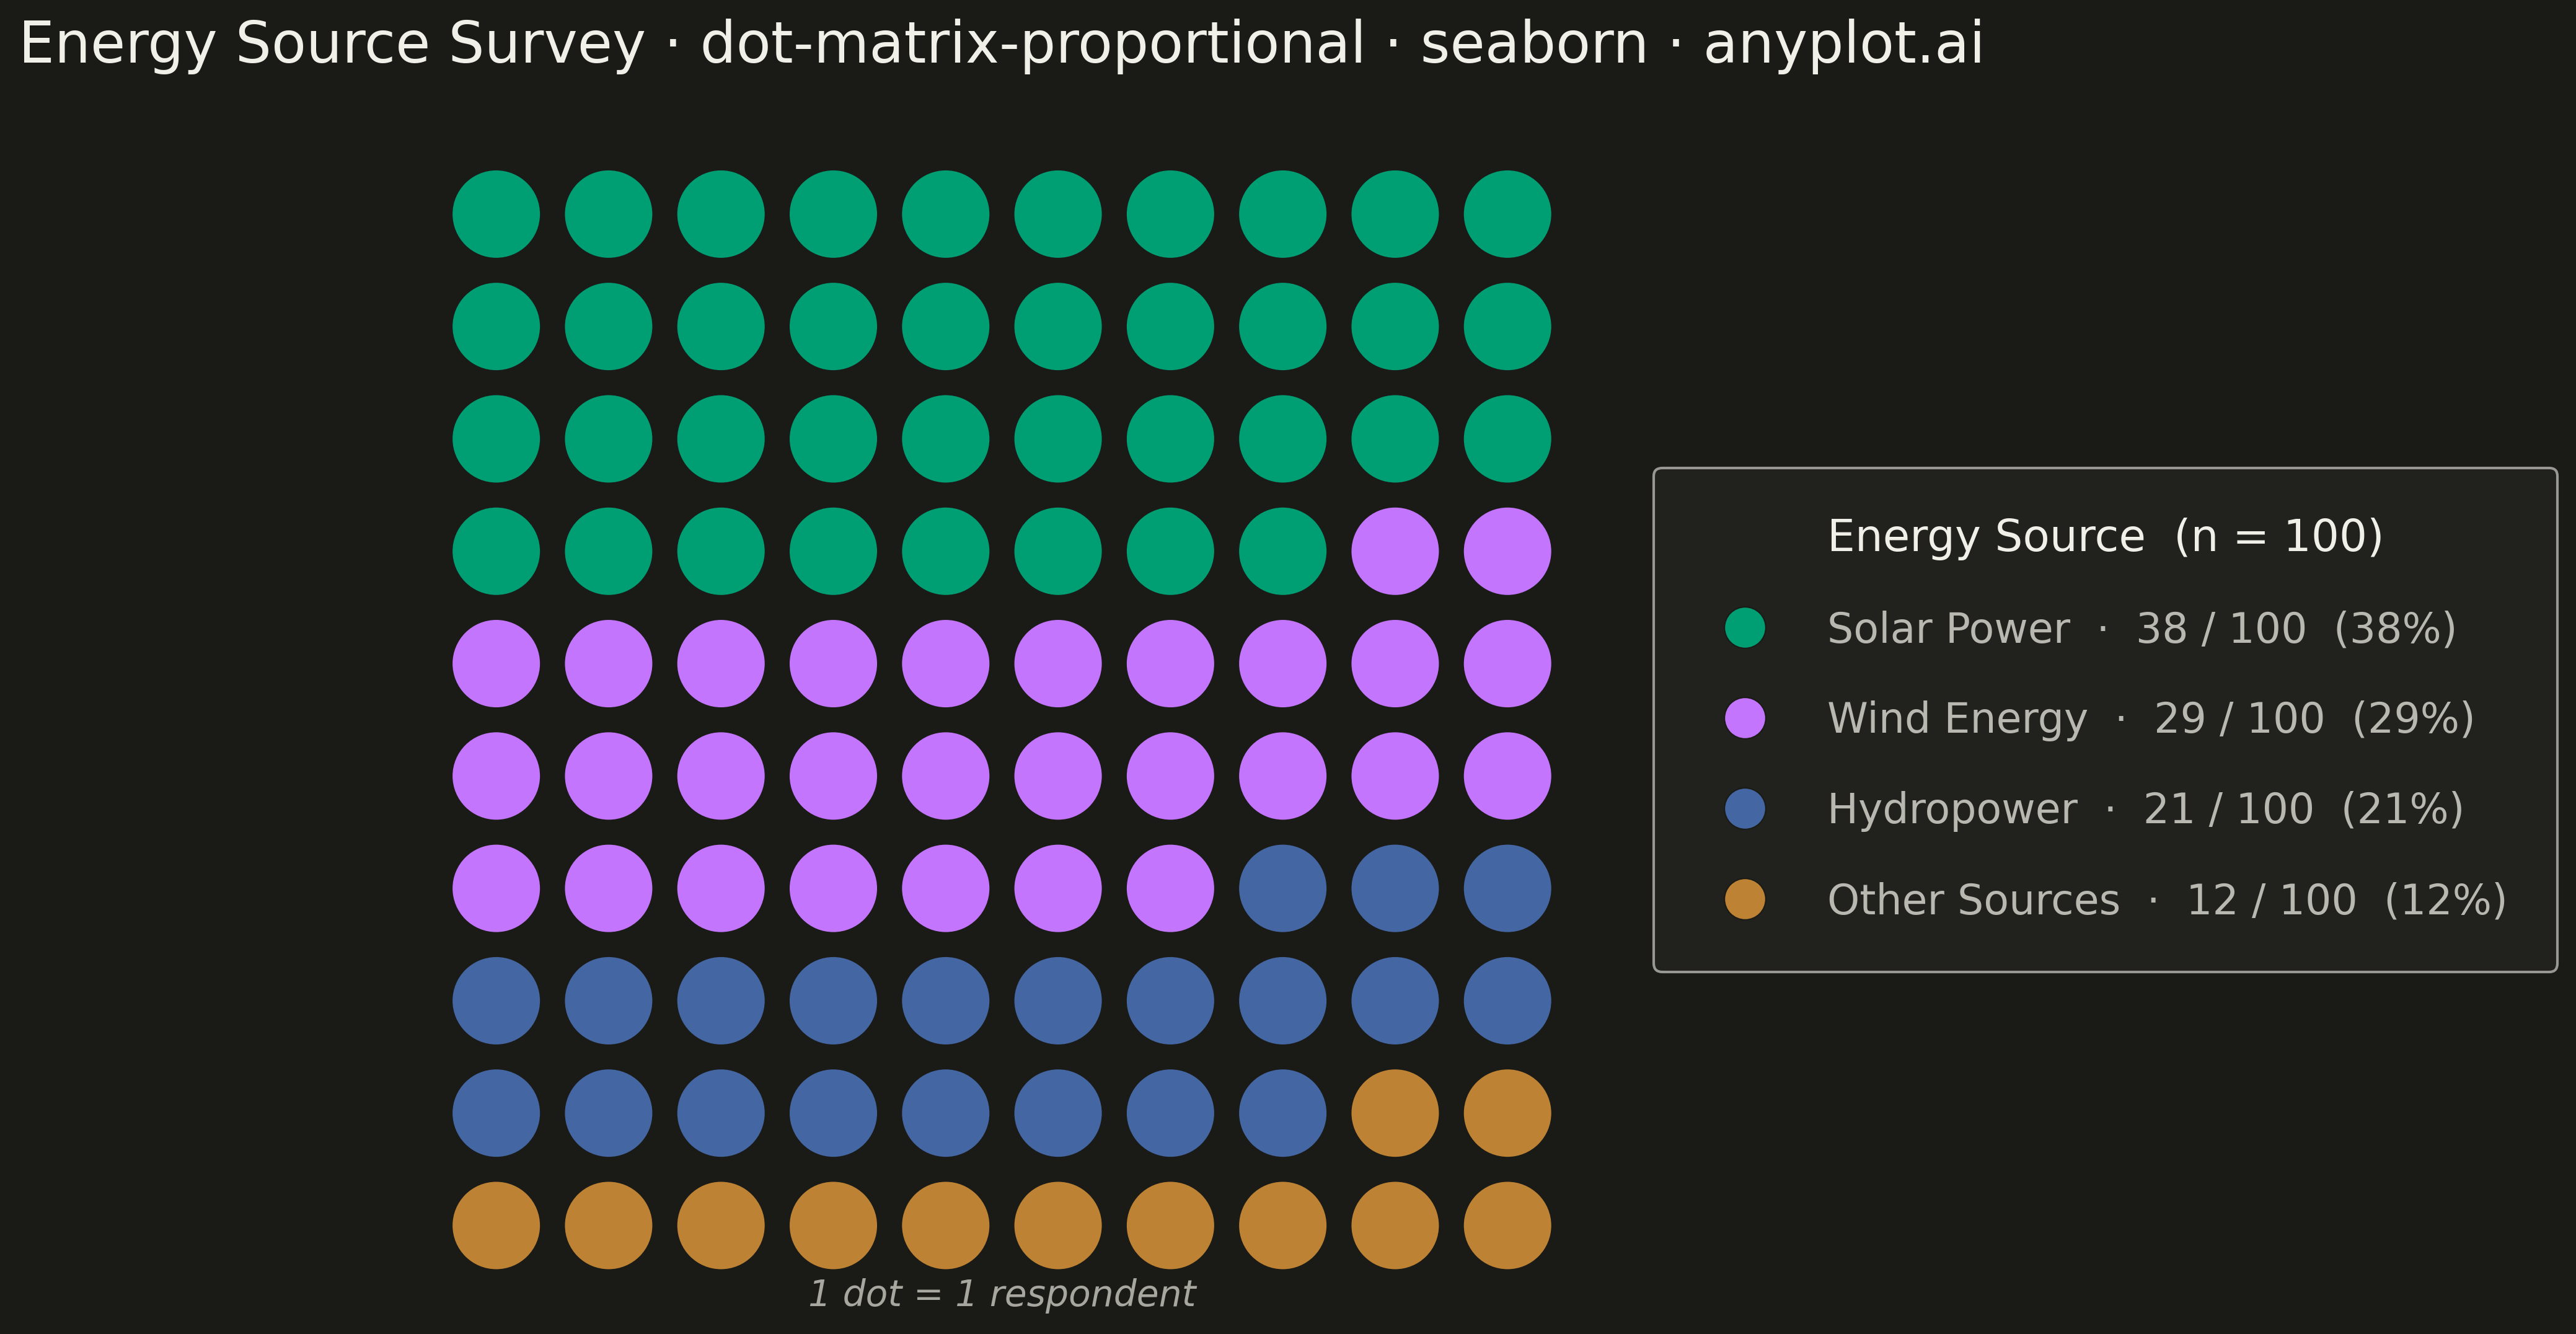
A dot matrix chart displays proportions using a grid of equally-sized dots where filled or colored dots represent counts out of a total. Each dot corresponds to one unit, making it intuitive to read "X out of N" statistics at a glance. Unlike waffle charts that use percentage-based squares, dot matrix charts emphasize absolute counts with variable grid sizes, excelling at risk communication and survey result visualization.
""" anyplot.ai
dot-matrix-proportional: Dot Matrix Chart for Proportional Counts
Library: seaborn 0.13.2 | Python 3.13.13
Quality: 86/100 | Created: 2026-05-08
"""

import os

import matplotlib.pyplot as plt
import pandas as pd
import seaborn as sns
from matplotlib.lines import Line2D


# Theme tokens
THEME = os.getenv("ANYPLOT_THEME", "light")
PAGE_BG = "#FAF8F1" if THEME == "light" else "#1A1A17"
ELEVATED_BG = "#FFFDF6" if THEME == "light" else "#242420"
INK = "#1A1A17" if THEME == "light" else "#F0EFE8"
INK_SOFT = "#4A4A44" if THEME == "light" else "#B8B7B0"
INK_MUTED = "#6B6A63" if THEME == "light" else "#A8A79F"

IMPRINT = ["#009E73", "#C475FD", "#4467A3", "#BD8233"]

sns.set_theme(
    style="ticks",
    rc={
        "figure.facecolor": PAGE_BG,
        "axes.facecolor": PAGE_BG,
        "axes.edgecolor": INK_SOFT,
        "axes.labelcolor": INK,
        "text.color": INK,
        "xtick.color": INK_SOFT,
        "ytick.color": INK_SOFT,
        "grid.color": INK,
        "grid.alpha": 0.10,
        "legend.facecolor": ELEVATED_BG,
        "legend.edgecolor": INK_SOFT,
    },
)

# Data — renewable energy source preference survey (100 respondents)
categories = ["Solar Power", "Wind Energy", "Hydropower", "Other Sources"]
counts = [38, 29, 21, 12]
total = sum(counts)  # 100

# Build dot grid: 10 columns × 10 rows, filled left-to-right, top-to-bottom
cols = 10
rows = total // cols

dot_labels = []
for cat, n in zip(categories, counts, strict=True):
    dot_labels.extend([cat] * n)

xs = [i % cols for i in range(total)]
ys = [rows - 1 - (i // cols) for i in range(total)]

df = pd.DataFrame({"x": xs, "y": ys, "category": dot_labels})

# Plot
fig, ax = plt.subplots(figsize=(12, 12), facecolor=PAGE_BG)
ax.set_facecolor(PAGE_BG)

palette = dict(zip(categories, IMPRINT, strict=True))

sns.scatterplot(
    data=df,
    x="x",
    y="y",
    hue="category",
    palette=palette,
    s=1200,
    linewidth=0.8,
    edgecolors=PAGE_BG,
    ax=ax,
    legend=False,
)

ax.set_xlim(-0.8, 9.8)
ax.set_ylim(-0.8, 9.8)
ax.set_aspect("equal")

# Legend with counts and percentages, placed to the right of the grid
legend_handles = [
    Line2D(
        [0],
        [0],
        marker="o",
        color="none",
        markerfacecolor=IMPRINT[i],
        markeredgecolor=PAGE_BG,
        markeredgewidth=0.5,
        markersize=16,
        label=f"{categories[i]}  ·  {counts[i]} / {total}  ({counts[i]}%)",
    )
    for i in range(len(categories))
]

leg = ax.legend(
    handles=legend_handles,
    fontsize=16,
    title="Energy Source  (n = 100)",
    title_fontsize=17,
    loc="center left",
    bbox_to_anchor=(1.03, 0.5),
    frameon=True,
    facecolor=ELEVATED_BG,
    edgecolor=INK_SOFT,
    handletextpad=1.0,
    borderpad=1.2,
    labelspacing=1.2,
)
leg.get_title().set_color(INK)
for text in leg.get_texts():
    text.set_color(INK_SOFT)

# Style
ax.set_title(
    "Energy Source Survey · dot-matrix-proportional · seaborn · anyplot.ai",
    fontsize=22,
    fontweight="medium",
    color=INK,
    pad=24,
)
ax.set_xlabel("")
ax.set_ylabel("")
ax.set_xticks([])
ax.set_yticks([])
for spine in ax.spines.values():
    spine.set_visible(False)

# Caption
ax.text(4.5, -0.62, "1 dot = 1 respondent", ha="center", va="center", fontsize=14, color=INK_MUTED, style="italic")

plt.tight_layout()
plt.savefig(f"plot-{THEME}.png", dpi=300, bbox_inches="tight", facecolor=PAGE_BG)
Runnable source as JSON, for any HTTP client: https://api.anyplot.ai/specs/dot-matrix-proportional/seaborn/code. Any spec id and library id listed in llms-full.txt fit the same URL shape; every URL below is complete and callable.
{
  "spec_id": "dot-matrix-proportional",
  "language": "python",
  "library": "seaborn",
  "page": "https://anyplot.ai/dot-matrix-proportional/python/seaborn",
  "hub": "https://anyplot.ai/dot-matrix-proportional",
  "code_json": "https://api.anyplot.ai/specs/dot-matrix-proportional/seaborn/code",
  "spec_json": "https://api.anyplot.ai/specs/dot-matrix-proportional",
  "render_light_png": "https://storage.googleapis.com/anyplot-images/plots/dot-matrix-proportional/python/seaborn/plot-light.png",
  "render_dark_png": "https://storage.googleapis.com/anyplot-images/plots/dot-matrix-proportional/python/seaborn/plot-dark.png",
  "quality_score": 86.0,
  "license": "MIT",
  "guide": "https://anyplot.ai/llms.txt"
}
Part of Dot Matrix Chart for Proportional Counts on anyplot.ai.