The same plot in 14 other libraries — JavaScript: Chart.js, Apache ECharts, Highcharts, MUI X Charts; Python: Altair, Bokeh, lets-plot, Matplotlib, Plotly, plotnine, Pygal, Seaborn; R: ggplot2; Julia: Makie.jl. Compare all 15 side by side: Dot Matrix Chart for Proportional Counts in Python, R, Julia and JavaScript.
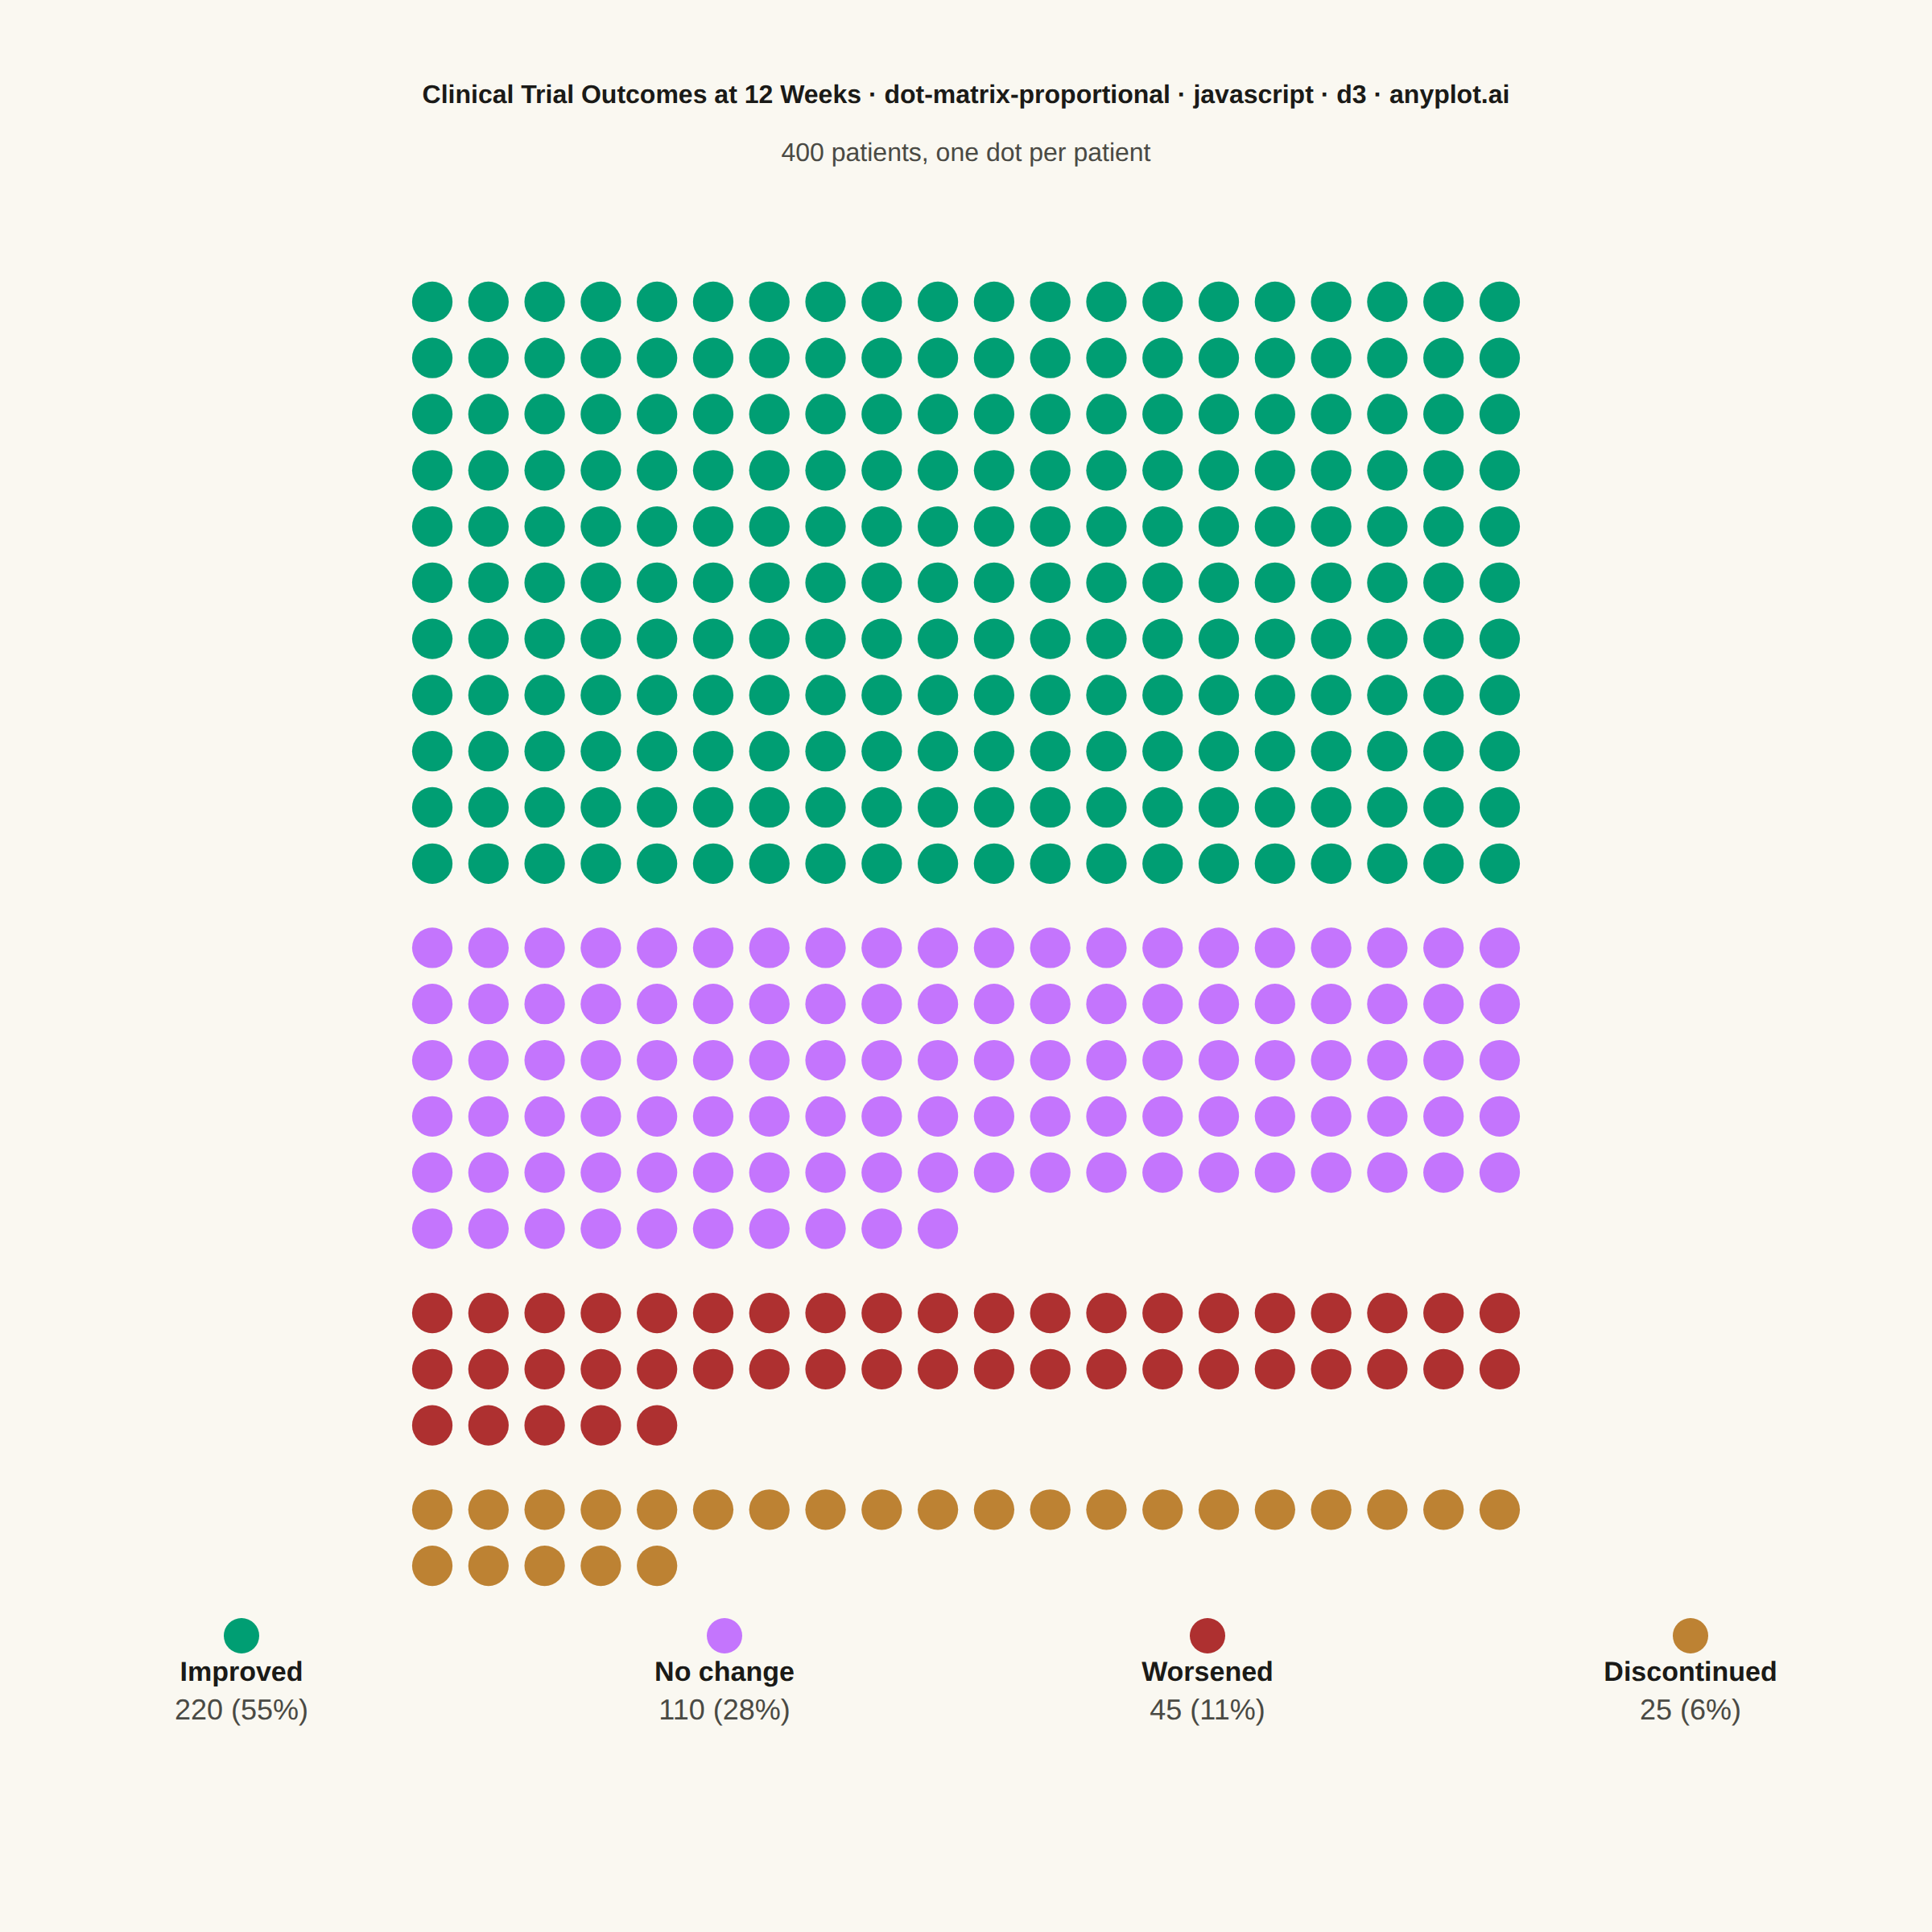
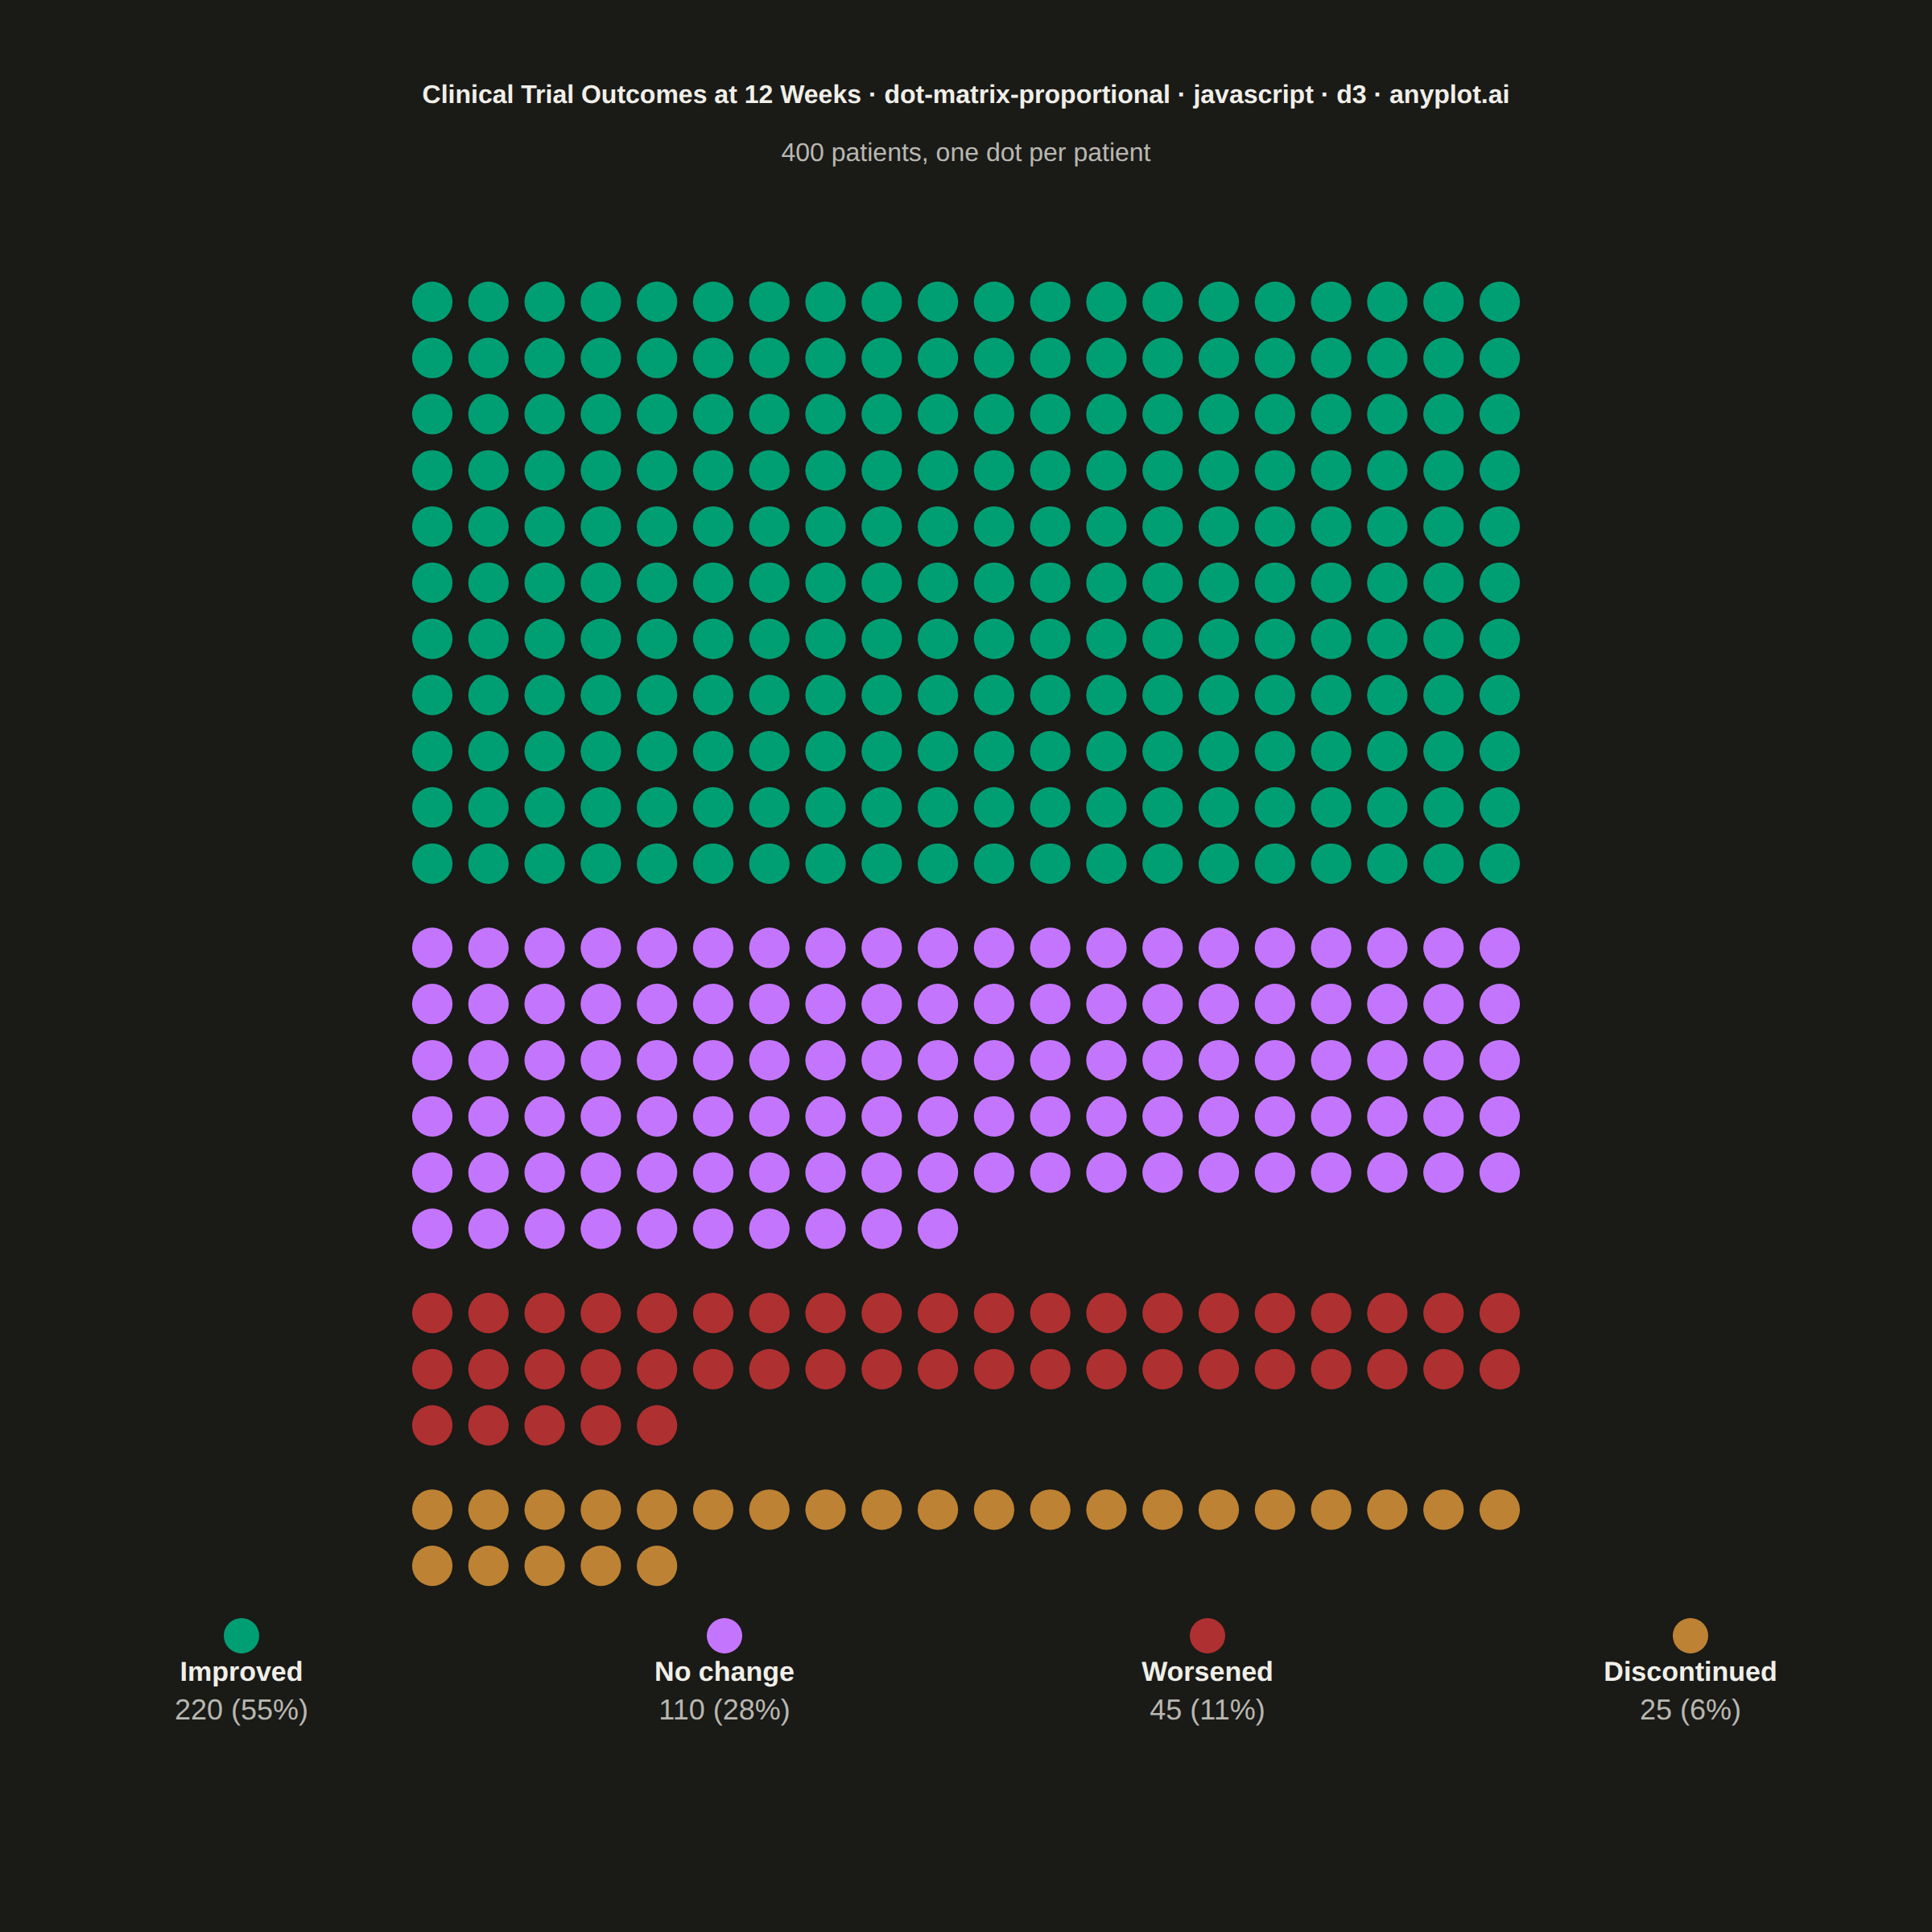
A dot matrix chart displays proportions using a grid of equally-sized dots where filled or colored dots represent counts out of a total. Each dot corresponds to one unit, making it intuitive to read "X out of N" statistics at a glance. Unlike waffle charts that use percentage-based squares, dot matrix charts emphasize absolute counts with variable grid sizes, excelling at risk communication and survey result visualization.
// anyplot.ai
// dot-matrix-proportional: Dot Matrix Chart for Proportional Counts
// Library: d3 7.9.0 | JavaScript 22.23.2
// Quality: 88/100 | Created: 2026-09-05

//# anyplot-orientation: square

// --- Data (in-memory, deterministic) ----------------------------------------
// 12-week clinical trial follow-up outcomes for 400 enrolled patients.
const t = window.ANYPLOT_TOKENS;
const categories = [
  { label: "Improved", count: 220 },
  { label: "No change", count: 110 },
  { label: "Worsened", count: 45 },
  { label: "Discontinued", count: 25 },
];
const total = d3.sum(categories, (c) => c.count);

// Non-semantic categories fill the canonical palette in order; "Worsened"
// is the deferred semantic exception, reassigned to the matte-red anchor
// (palette[4]) to reinforce negative outcome polarity.
const color = d3
  .scaleOrdinal([t.palette[0], t.palette[1], t.palette[4], t.palette[3]])
  .domain(categories.map((c) => c.label));

// Flatten into one dot per patient, grouped by category and filled
// left-to-right/top-to-bottom within each group; a half-cell vertical gap
// separates each category block from the next to reinforce grouping.
const nCols = 20;
let rowCursor = 0;
const dots = [];
categories.forEach((c, ci) => {
  d3.range(c.count).forEach((i) => {
    dots.push({
      col: i % nCols,
      row: rowCursor + Math.floor(i / nCols),
      color: color(c.label),
    });
  });
  rowCursor += Math.ceil(c.count / nCols);
  if (ci < categories.length - 1) rowCursor += 0.5;
});
const totalRowUnits = rowCursor;

// --- SVG mount ---------------------------------------------------------------
const { width, height } = window.ANYPLOT_SIZE;
const svg = d3.select("#container").append("svg").attr("width", width).attr("height", height);

const margin = { top: 170, right: 90, bottom: 210, left: 90 };
const iw = width - margin.left - margin.right;
const ih = height - margin.top - margin.bottom;

const cell = Math.min(iw / nCols, ih / totalRowUnits);
const gridW = nCols * cell;
const gridH = totalRowUnits * cell;
const offsetX = (iw - gridW) / 2;
const offsetY = (ih - gridH) / 2;

const g = svg
  .append("g")
  .attr("transform", `translate(${margin.left + offsetX},${margin.top + offsetY})`);

// --- Dots ----------------------------------------------------------------
const dotRadius = cell * 0.36;
g.selectAll("circle")
  .data(dots)
  .join("circle")
  .attr("cx", (d) => d.col * cell + cell / 2)
  .attr("cy", (d) => d.row * cell + cell / 2)
  .attr("r", dotRadius)
  .attr("fill", (d) => d.color);

// --- Title ---------------------------------------------------------------
const title = "Clinical Trial Outcomes at 12 Weeks · dot-matrix-proportional · javascript · d3 · anyplot.ai";
const titleFontSize = Math.max(14, Math.round(22 * Math.min(1, 67 / title.length)));
svg
  .append("text")
  .attr("x", width / 2)
  .attr("y", 64)
  .attr("text-anchor", "middle")
  .attr("fill", t.ink)
  .style("font-size", `${titleFontSize}px`)
  .style("font-weight", "600")
  .text(title);

svg
  .append("text")
  .attr("x", width / 2)
  .attr("y", 64 + titleFontSize + 20)
  .attr("text-anchor", "middle")
  .attr("fill", t.inkSoft)
  .style("font-size", "16px")
  .text(`${total} patients, one dot per patient`);

// --- Legend ----------------------------------------------------------------
const legendY = margin.top + offsetY + gridH + 60;
const slotWidth = width / categories.length;
const pct = d3.format(".0%");

const legend = svg
  .selectAll("g.legend-item")
  .data(categories)
  .join("g")
  .attr("class", "legend-item")
  .attr("transform", (d, i) => `translate(${slotWidth * (i + 0.5)},${legendY})`);

legend
  .append("circle")
  .attr("r", 11)
  .attr("cy", -34)
  .attr("fill", (d) => color(d.label));

legend
  .append("text")
  .attr("text-anchor", "middle")
  .attr("y", -6)
  .attr("fill", t.ink)
  .style("font-size", "17px")
  .style("font-weight", "600")
  .text((d) => d.label);

legend
  .append("text")
  .attr("text-anchor", "middle")
  .attr("y", 18)
  .attr("fill", t.inkSoft)
  .style("font-size", "18px")
  .text((d) => `${d.count} (${pct(d.count / total)})`);
Runnable source as JSON, for any HTTP client: https://api.anyplot.ai/specs/dot-matrix-proportional/d3/code. Any spec id and library id listed in llms-full.txt fit the same URL shape; every URL below is complete and callable.
{
  "spec_id": "dot-matrix-proportional",
  "language": "javascript",
  "library": "d3",
  "page": "https://anyplot.ai/dot-matrix-proportional/javascript/d3",
  "hub": "https://anyplot.ai/dot-matrix-proportional",
  "code_json": "https://api.anyplot.ai/specs/dot-matrix-proportional/d3/code",
  "spec_json": "https://api.anyplot.ai/specs/dot-matrix-proportional",
  "render_light_png": "https://storage.googleapis.com/anyplot-images/plots/dot-matrix-proportional/javascript/d3/plot-light.png",
  "render_dark_png": "https://storage.googleapis.com/anyplot-images/plots/dot-matrix-proportional/javascript/d3/plot-dark.png",
  "interactive_light_html": "https://storage.googleapis.com/anyplot-images/plots/dot-matrix-proportional/javascript/d3/plot-light.html",
  "interactive_dark_html": "https://storage.googleapis.com/anyplot-images/plots/dot-matrix-proportional/javascript/d3/plot-dark.html",
  "quality_score": 88.0,
  "license": "MIT",
  "guide": "https://anyplot.ai/llms.txt"
}
Part of Dot Matrix Chart for Proportional Counts on anyplot.ai.