The same plot in 14 other libraries — Python: Altair, Bokeh, lets-plot, Matplotlib, Plotly, plotnine, Pygal, Seaborn; R: ggplot2; JavaScript: Chart.js, D3.js, Apache ECharts, Highcharts, MUI X Charts. Compare all 15 side by side: Dot Matrix Chart for Proportional Counts in Python, R, Julia and JavaScript.
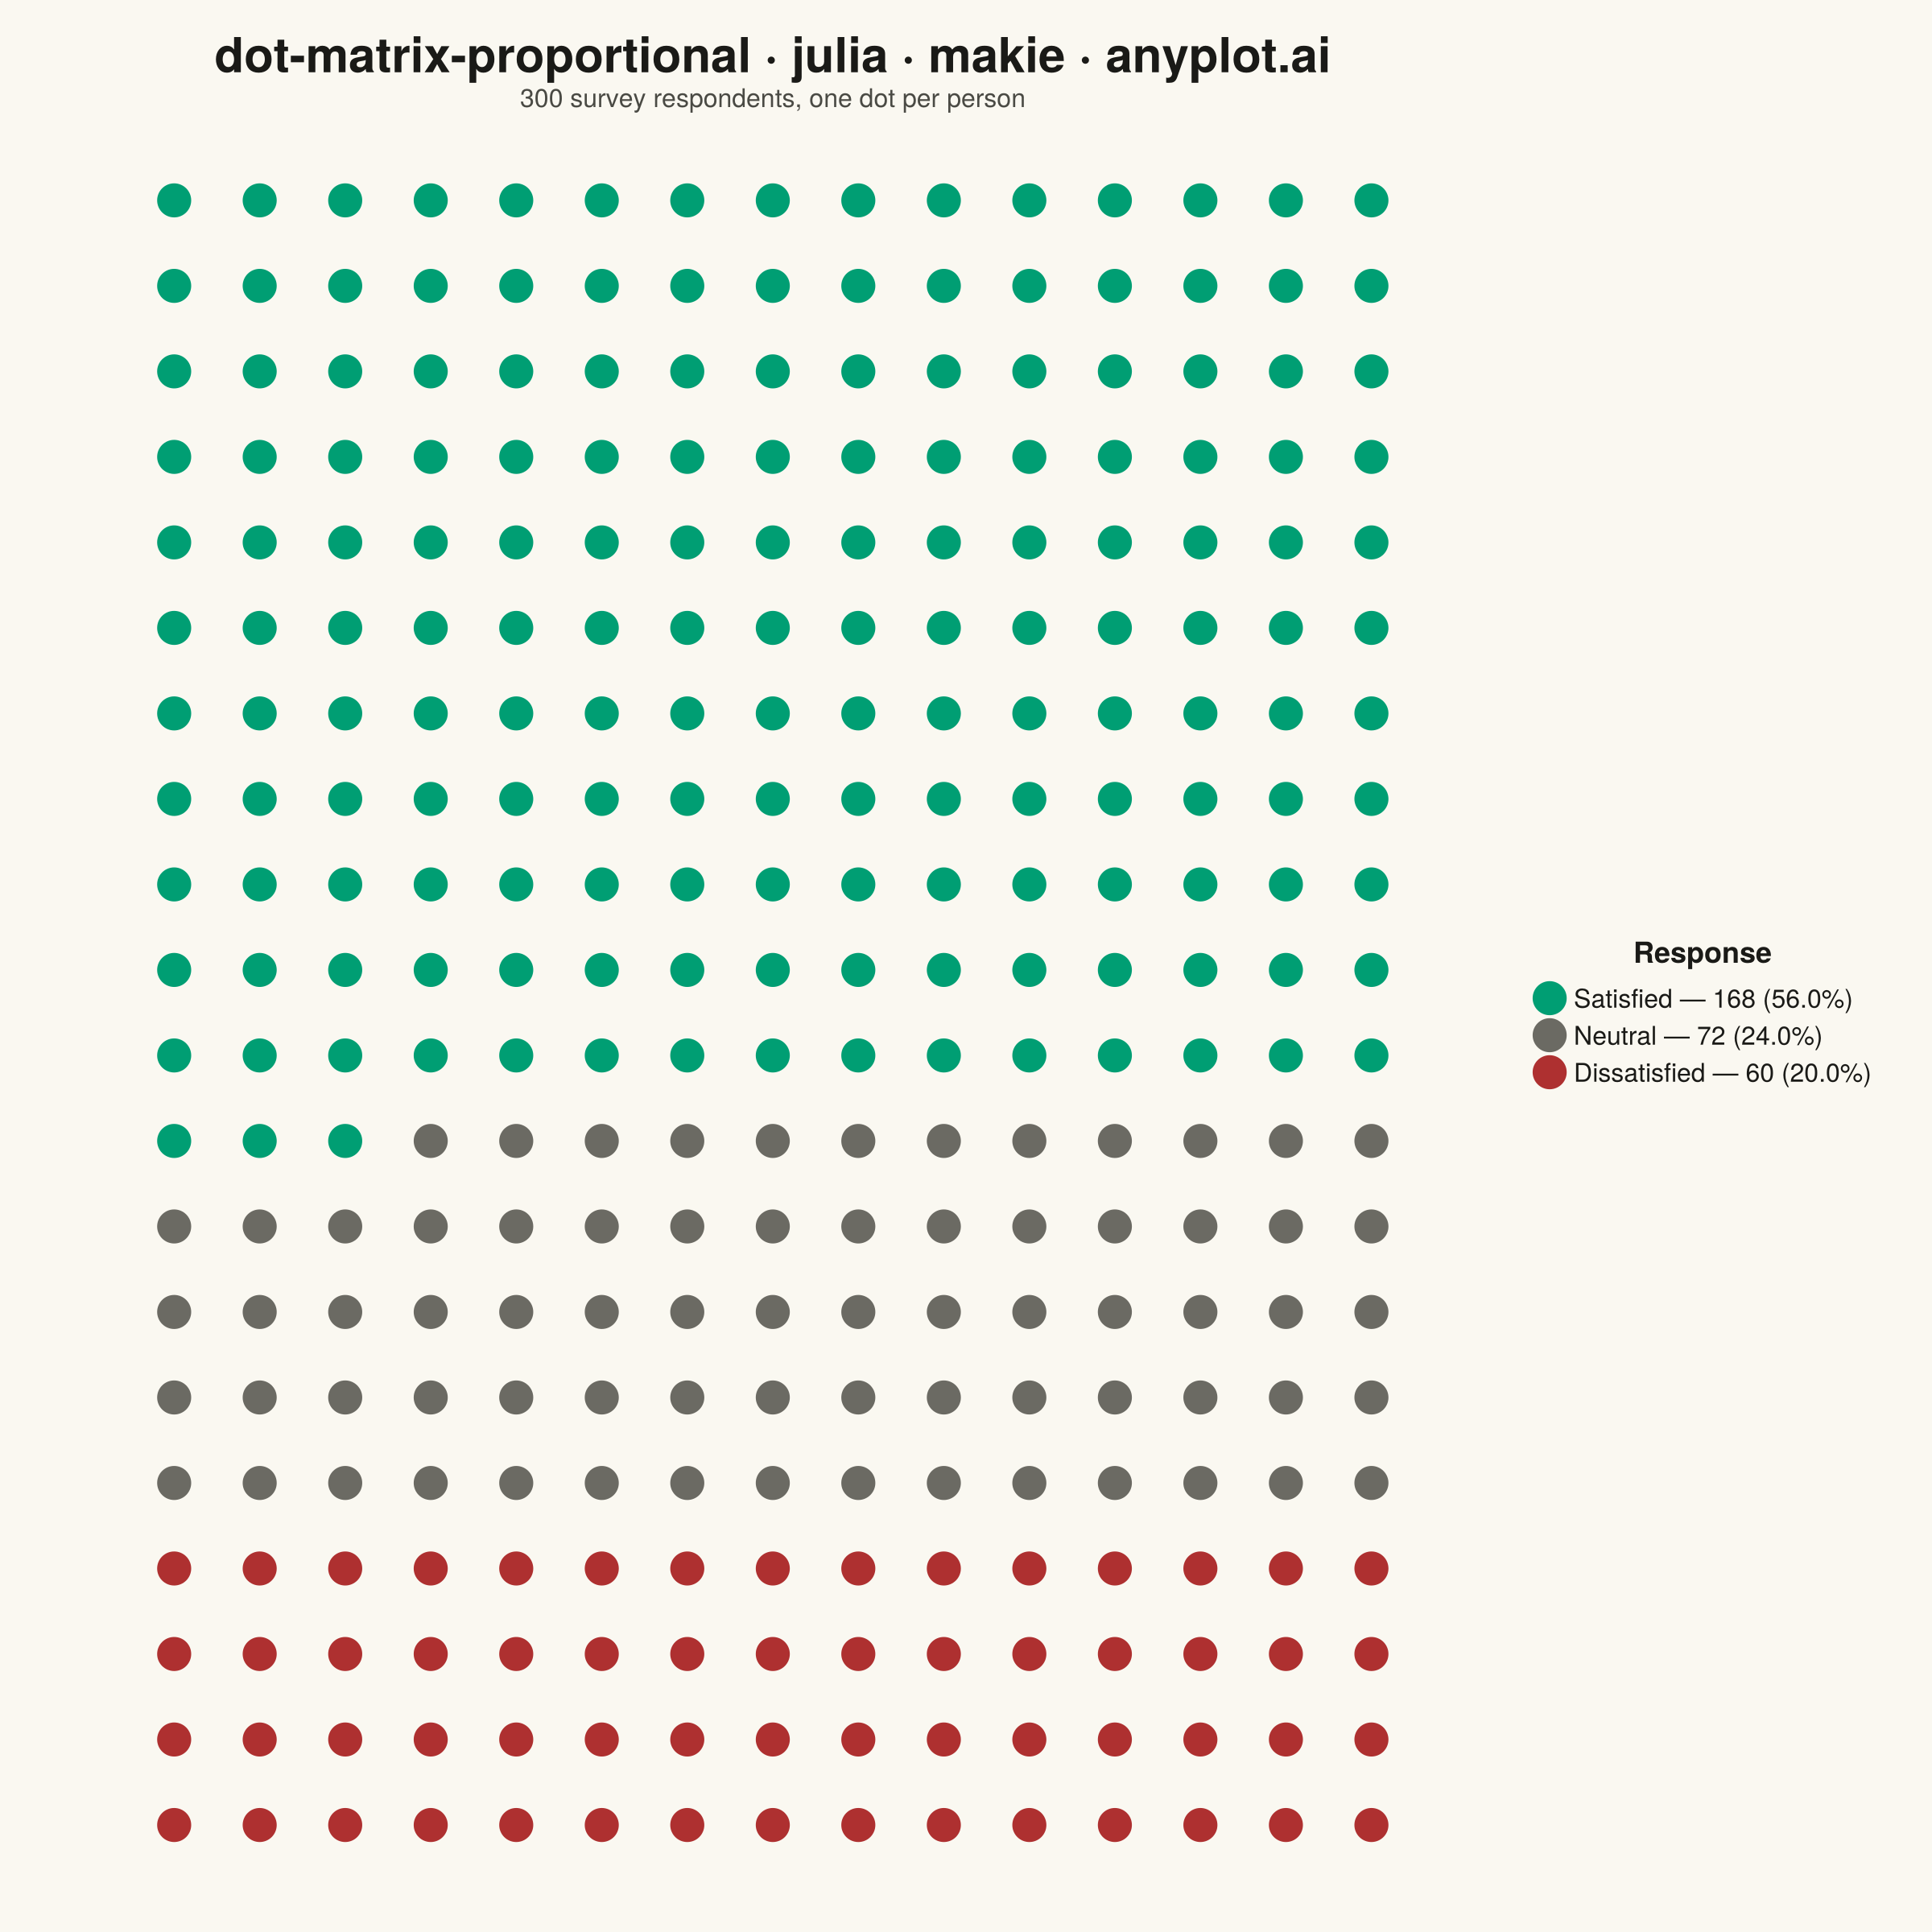
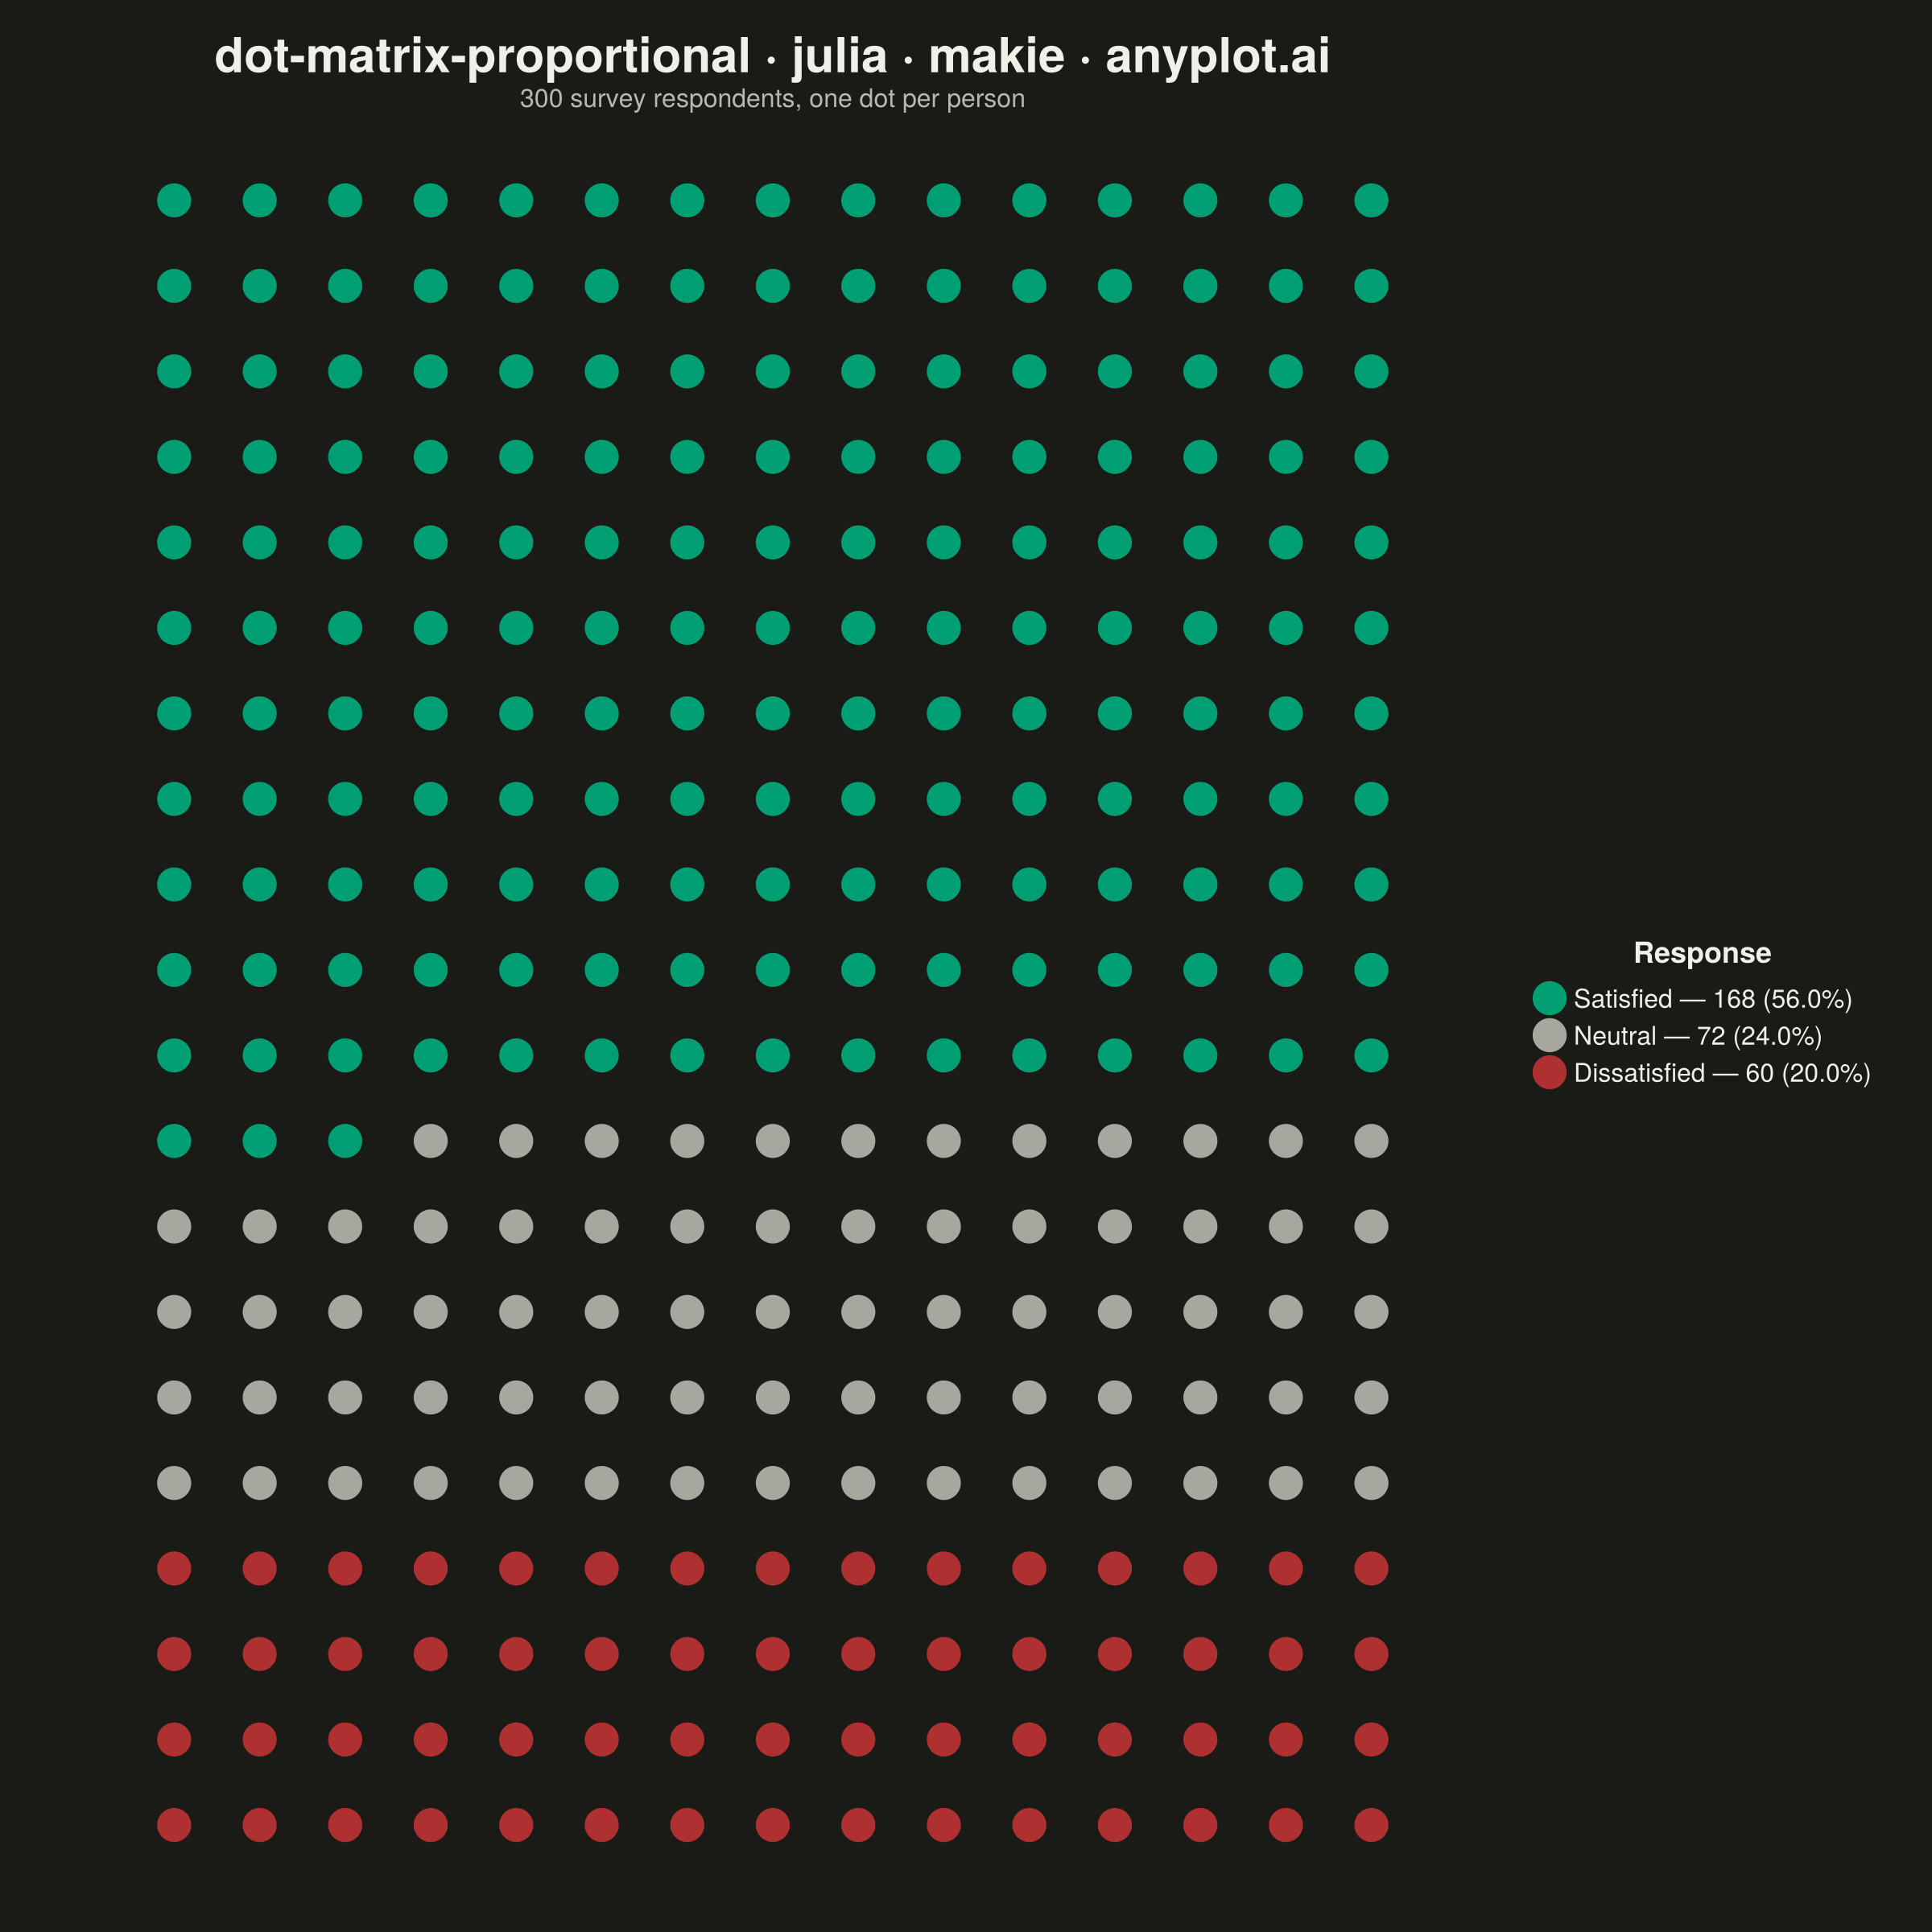
A dot matrix chart displays proportions using a grid of equally-sized dots where filled or colored dots represent counts out of a total. Each dot corresponds to one unit, making it intuitive to read "X out of N" statistics at a glance. Unlike waffle charts that use percentage-based squares, dot matrix charts emphasize absolute counts with variable grid sizes, excelling at risk communication and survey result visualization.
# anyplot.ai
# dot-matrix-proportional: Dot Matrix Chart for Proportional Counts
# Library: makie 0.21.9 | Julia 1.11.9
# Quality: 93/100 | Created: 2026-09-05

using CairoMakie
using Colors
using Random

Random.seed!(42)

# --- Theme tokens (see prompts/default-style-guide.md "Theme-adaptive Chrome") ---
THEME    = get(ENV, "ANYPLOT_THEME", "light")
PAGE_BG  = THEME == "light" ? colorant"#FAF8F1" : colorant"#1A1A17"
INK      = THEME == "light" ? colorant"#1A1A17" : colorant"#F0EFE8"
INK_SOFT = THEME == "light" ? colorant"#4A4A44" : colorant"#B8B7B0"

# Semantic anchors (see prompts/default-style-guide.md "Semantic anchors"):
# sentiment/polarity categories map to green (positive) / red (negative) /
# adaptive muted gray (neutral) rather than the canonical palette order.
MUTED = THEME == "light" ? colorant"#6B6A63" : colorant"#A8A79F"
CATEGORY_COLOR = Dict(
    "Satisfied"    => colorant"#009E73",
    "Neutral"      => MUTED,
    "Dissatisfied" => colorant"#AE3030",
)

# --- Data: customer satisfaction survey, 300 respondents -----------------------
categories = ["Satisfied", "Neutral", "Dissatisfied"]
counts     = [168, 72, 60]
total      = sum(counts)

n_cols = 15
n_rows = cld(total, n_cols)

dot_category = String[]
for (cat, n) in zip(categories, counts)
    append!(dot_category, fill(cat, n))
end

dot_x = Float64[]
dot_y = Float64[]
for i in 0:(total - 1)
    row = i ÷ n_cols
    col = i % n_cols
    push!(dot_x, col)
    push!(dot_y, n_rows - 1 - row)  # row 0 (first filled) sits at the top
end

# --- Plot -----------------------------------------------------------------------
fig = Figure(
    resolution      = (1200, 1200),
    fontsize        = 14,
    backgroundcolor = PAGE_BG,
)

ax = Axis(
    fig[1, 1];
    title            = "dot-matrix-proportional · julia · makie · anyplot.ai",
    titlesize        = 30,
    titlecolor       = INK,
    subtitle         = "$(total) survey respondents, one dot per person",
    subtitlesize     = 16,
    subtitlecolor    = INK_SOFT,
    backgroundcolor  = PAGE_BG,
    aspect           = DataAspect(),
)
hidedecorations!(ax)
hidespines!(ax)

for (i, cat) in enumerate(categories)
    mask = dot_category .== cat
    pct = round(100 * counts[i] / total; digits = 1)
    scatter!(
        ax, dot_x[mask], dot_y[mask];
        color       = CATEGORY_COLOR[cat],
        markersize  = 30,
        strokewidth = 0,
        label       = "$cat — $(counts[i]) ($(pct)%)",
    )
end

Legend(
    fig[1, 2], ax, "Response";
    labelcolor      = INK,
    titlecolor      = INK,
    framevisible    = false,
    backgroundcolor = PAGE_BG,
    labelsize       = 16,
    titlesize       = 18,
)

colsize!(fig.layout, 1, Relative(0.78))

# --- Save -------------------------------------------------------------------
save("plot-$(THEME).png", fig; px_per_unit = 2)
Runnable source as JSON, for any HTTP client: https://api.anyplot.ai/specs/dot-matrix-proportional/makie/code. Any spec id and library id listed in llms-full.txt fit the same URL shape; every URL below is complete and callable.
{
  "spec_id": "dot-matrix-proportional",
  "language": "julia",
  "library": "makie",
  "page": "https://anyplot.ai/dot-matrix-proportional/julia/makie",
  "hub": "https://anyplot.ai/dot-matrix-proportional",
  "code_json": "https://api.anyplot.ai/specs/dot-matrix-proportional/makie/code",
  "spec_json": "https://api.anyplot.ai/specs/dot-matrix-proportional",
  "render_light_png": "https://storage.googleapis.com/anyplot-images/plots/dot-matrix-proportional/julia/makie/plot-light.png",
  "render_dark_png": "https://storage.googleapis.com/anyplot-images/plots/dot-matrix-proportional/julia/makie/plot-dark.png",
  "quality_score": 93.0,
  "license": "MIT",
  "guide": "https://anyplot.ai/llms.txt"
}
Part of Dot Matrix Chart for Proportional Counts on anyplot.ai.