The same plot in 14 other libraries — JavaScript: D3.js, Apache ECharts, Highcharts, MUI X Charts; Python: Altair, Bokeh, lets-plot, Matplotlib, Plotly, plotnine, Pygal, Seaborn; R: ggplot2; Julia: Makie.jl. Compare all 15 side by side: Cumulative Histogram in Python, R, Julia and JavaScript.
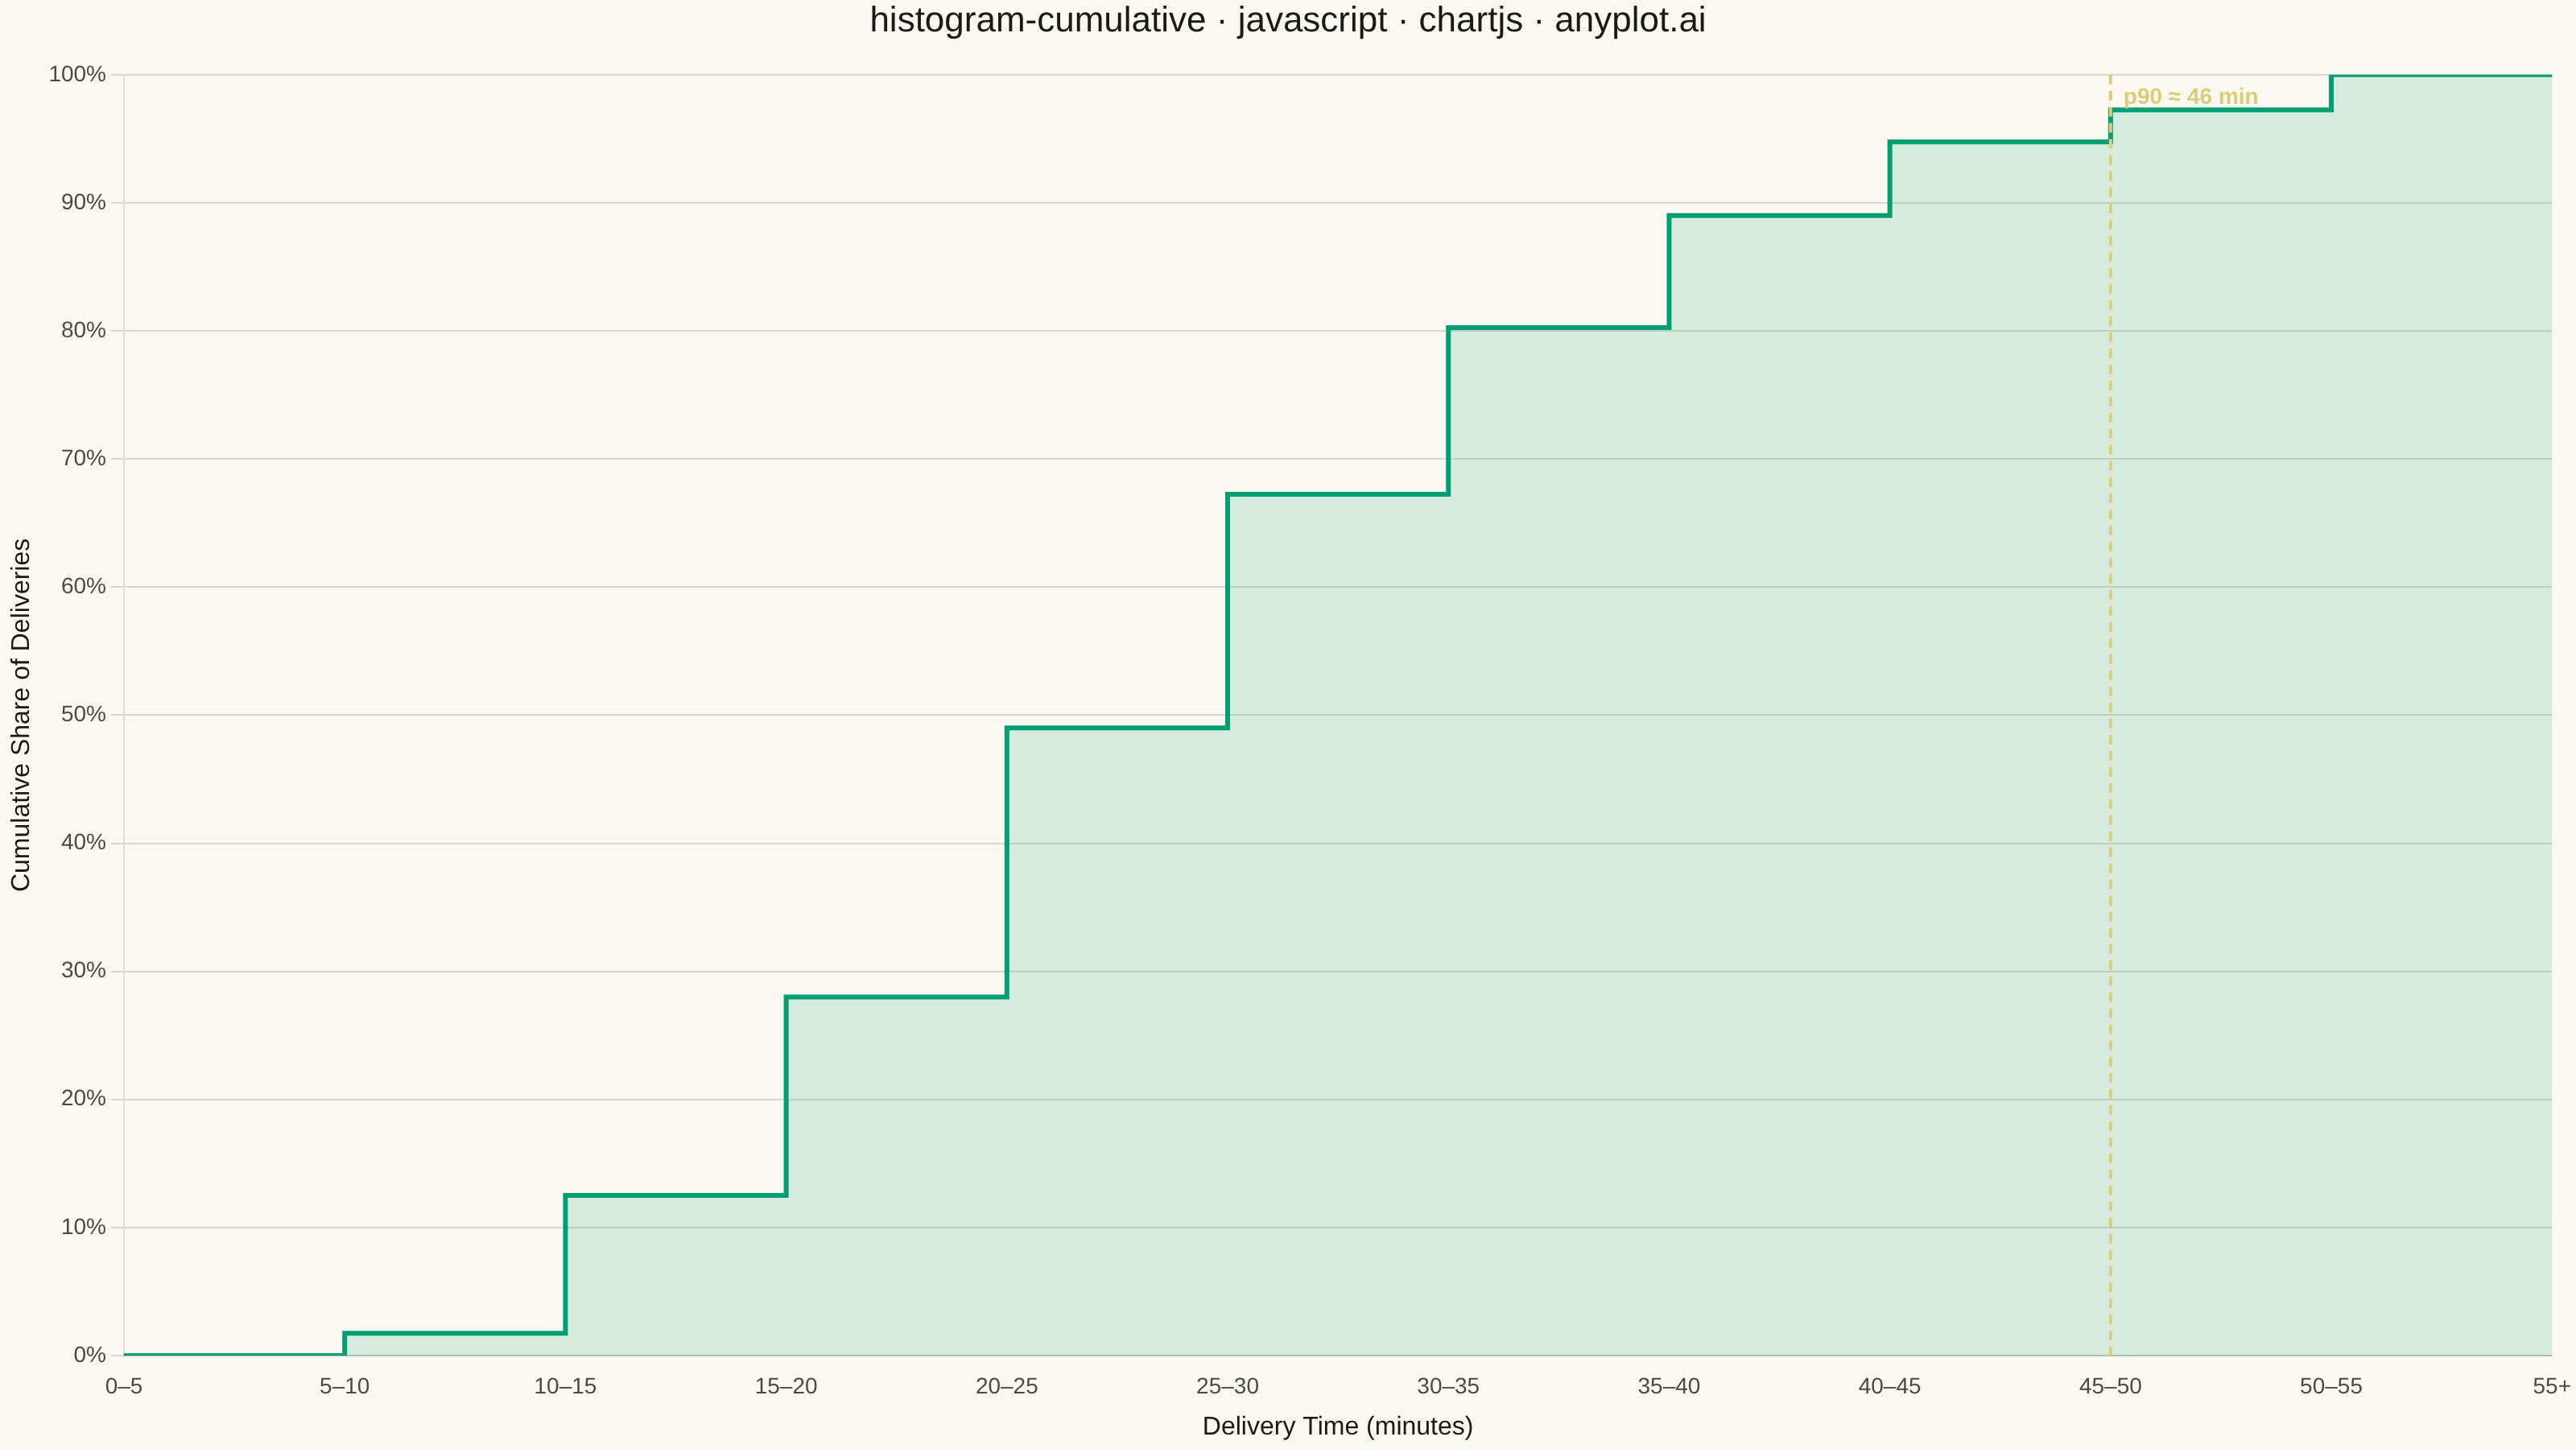
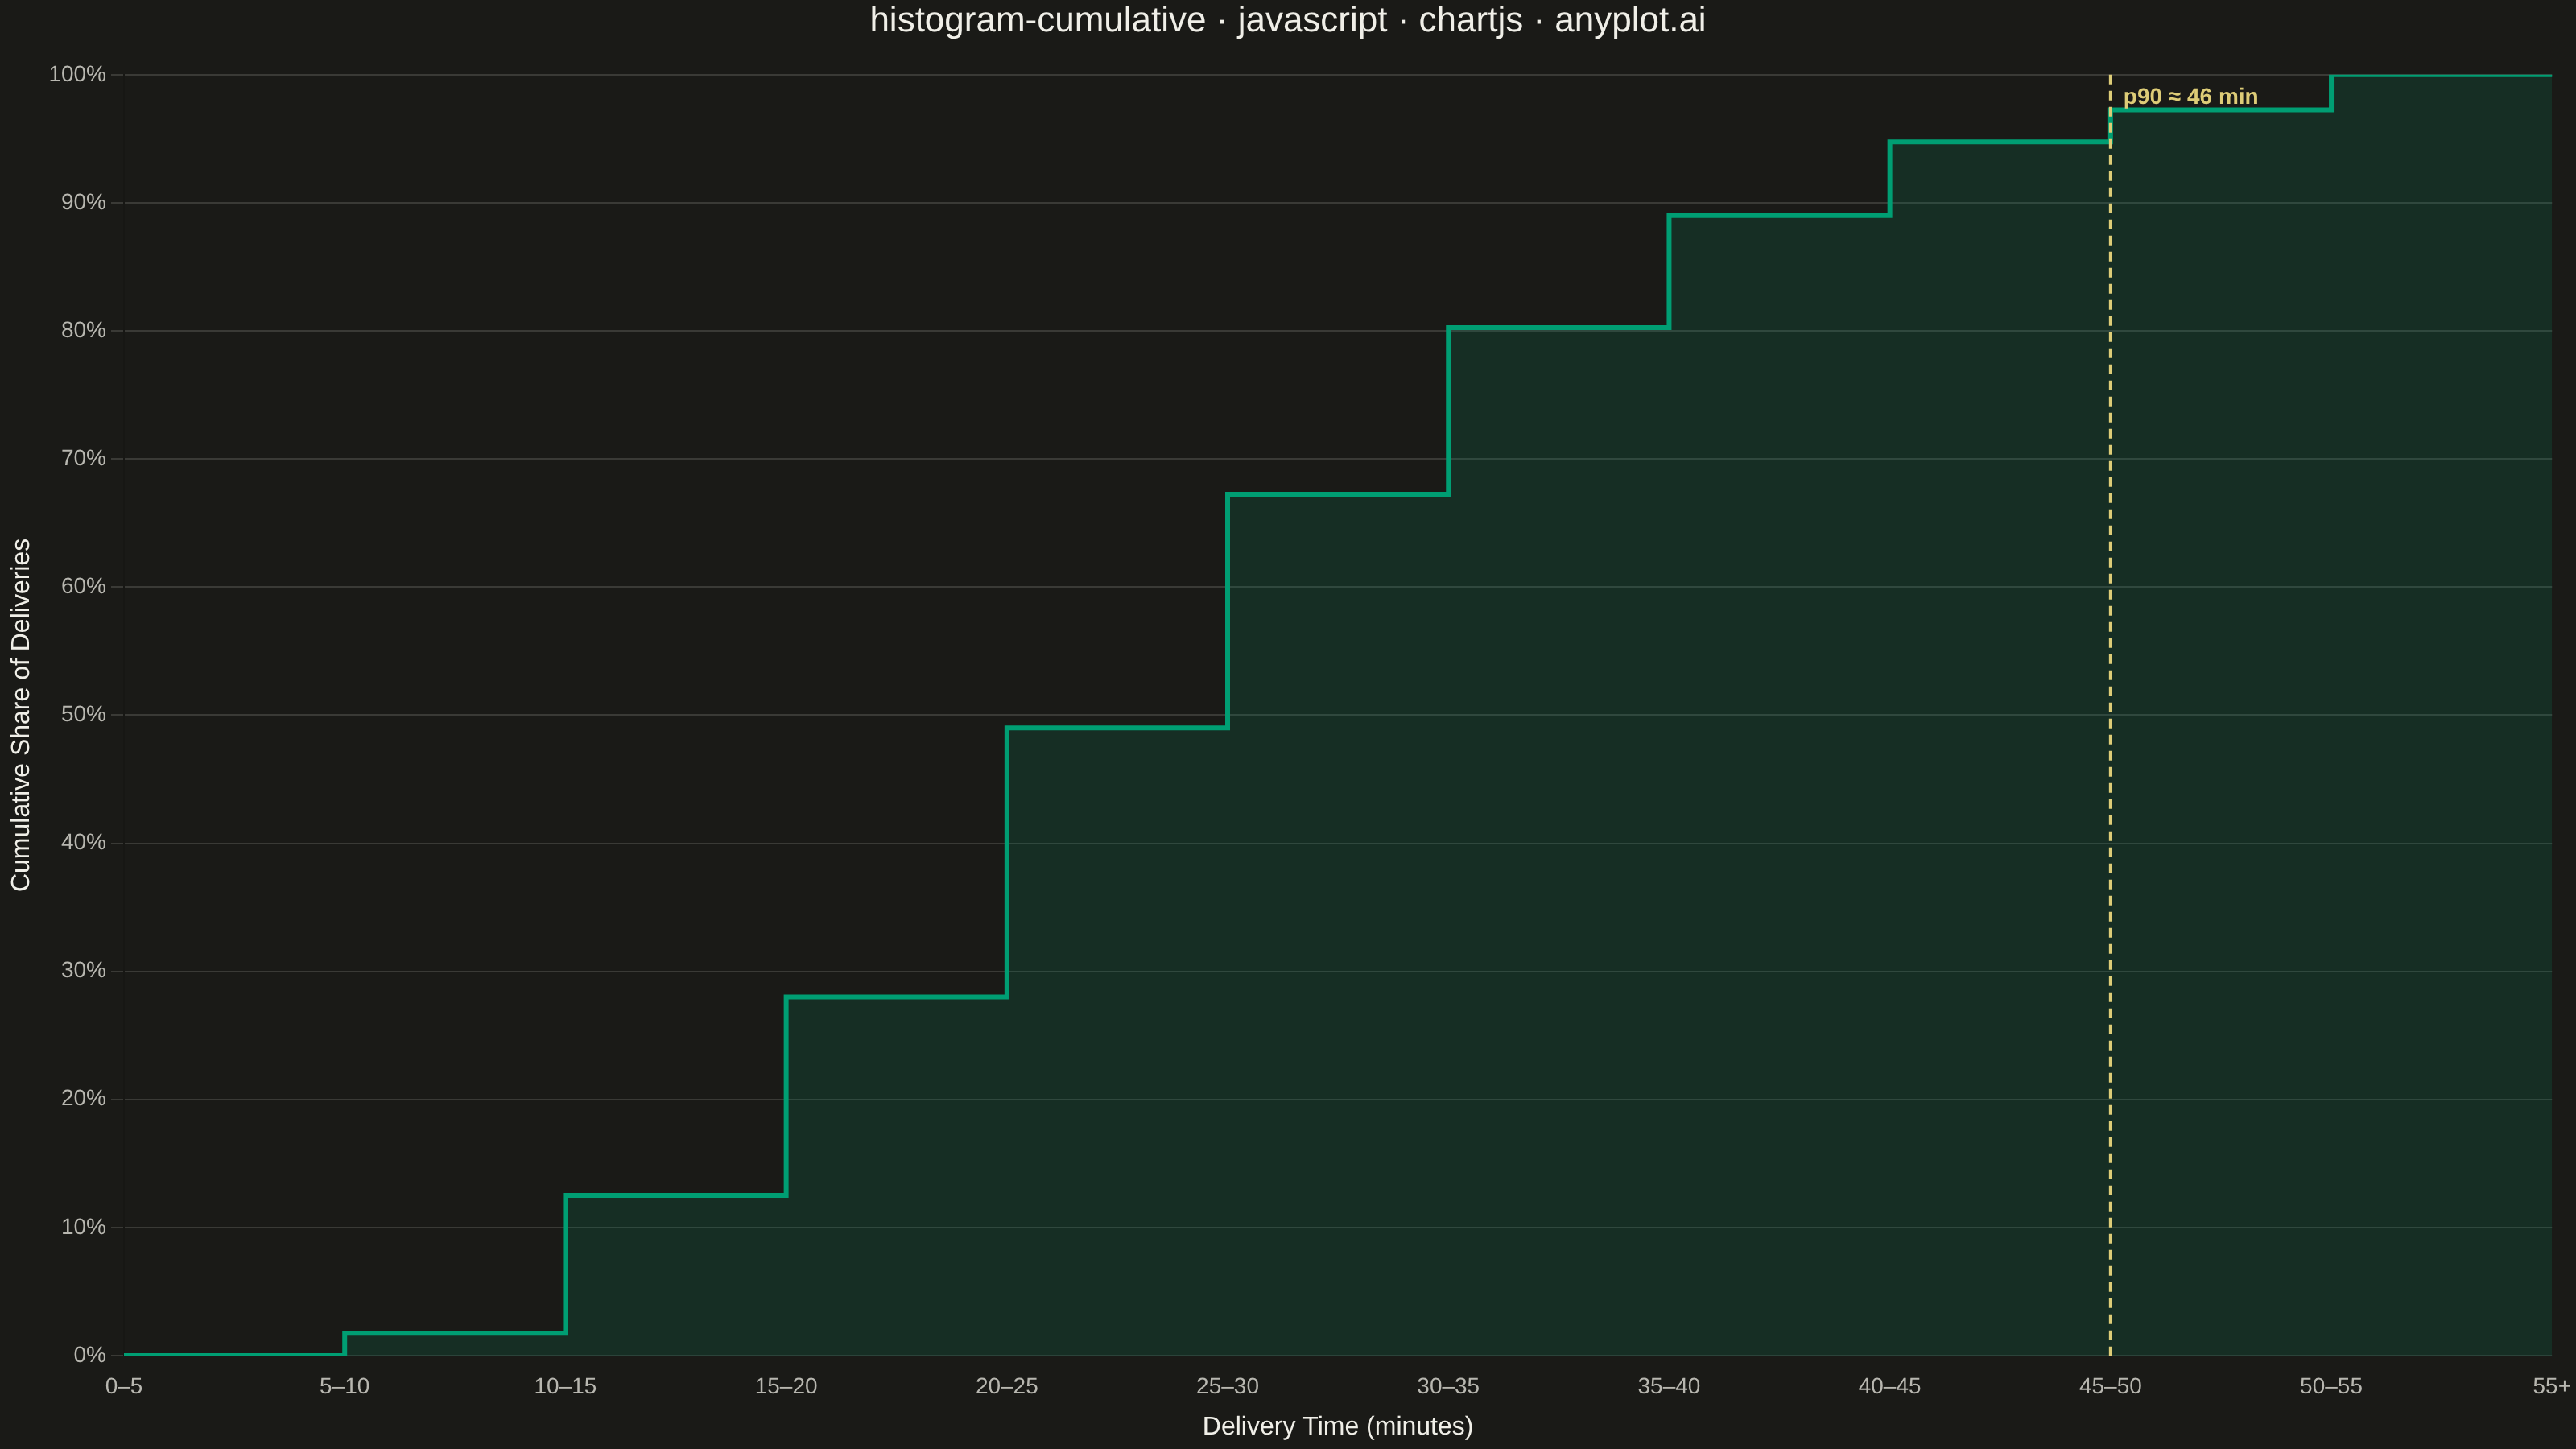
A cumulative histogram (also known as an ogive or cumulative frequency histogram) displays the running total of observations up to each bin boundary. The y-axis shows cumulative count or proportion, creating a monotonically increasing step function that reaches the total sample size (or 1.0 for normalized).
// anyplot.ai
// histogram-cumulative: Cumulative Histogram
// Library: chartjs 4.4.7 | JavaScript 22.23.2
// Quality: 92/100 | Created: 2026-09-05

const t = window.ANYPLOT_TOKENS;

// --- Data (in-memory, deterministic fixed-seed LCG) -------------------------
// Package delivery times (minutes) — a right-skewed distribution where the
// cumulative view answers "what share of packages arrive within X minutes?"
let seed = 42;
function lcgRandom() {
  seed = (seed * 1664525 + 1013904223) % 4294967296;
  return seed / 4294967296;
}
function randomNormal(mean, stdDev) {
  const u1 = lcgRandom() || 1e-9;
  const u2 = lcgRandom();
  const z = Math.sqrt(-2 * Math.log(u1)) * Math.cos(2 * Math.PI * u2);
  return mean + z * stdDev;
}

const sampleCount = 400;
const deliveryTimes = [];
for (let i = 0; i < sampleCount; i++) {
  const base = Math.exp(randomNormal(Math.log(30), 0.35));
  deliveryTimes.push(Math.max(5, base));
}

// Nearest-rank percentile helper on the raw (unbinned) sample.
const sortedTimes = [...deliveryTimes].sort((a, b) => a - b);
const percentile = (p) => sortedTimes[Math.min(sortedTimes.length - 1, Math.floor(p * sortedTimes.length))];
const p90Value = percentile(0.9);

// Trim the long, near-featureless tail: bin only up to the 96th percentile
// and collapse the sparse remainder into a single "overflow" bin, so the
// informative rise of the S-curve gets most of the horizontal space.
const binWidth = 5;
const binMax = Math.ceil(percentile(0.96) / binWidth) * binWidth;
const binCount = binMax / binWidth;
const binCounts = new Array(binCount + 1).fill(0);
for (const value of deliveryTimes) {
  const idx = value >= binMax ? binCount : Math.floor(value / binWidth);
  binCounts[idx] += 1;
}

const binLabels = binCounts.map((_, i) => (i < binCount ? `${i * binWidth}–${(i + 1) * binWidth}` : `${binMax}+`));
let running = 0;
const cumulativeProportion = binCounts.map((count) => {
  running += count;
  return running / sampleCount;
});
const p90BinIndex = Math.min(binCount - 1, Math.floor(p90Value / binWidth));

// --- Mount -------------------------------------------------------------------
const canvas = document.createElement("canvas");
document.getElementById("container").appendChild(canvas);

// --- Custom plugin: dashed p90 guide line + label ---------------------------
// Drawn with the canvas 2D API directly against the chart's own scales — a
// plain inline Chart.js plugin, not a community/annotation package.
const p90MarkerPlugin = {
  id: "p90Marker",
  afterDraw(chart) {
    const { ctx, chartArea, scales } = chart;
    const x = scales.x.getPixelForValue(p90BinIndex);
    const nearRightEdge = x > chartArea.left + (chartArea.right - chartArea.left) * 0.85;

    ctx.save();
    ctx.strokeStyle = t.amber;
    ctx.lineWidth = 2;
    ctx.setLineDash([6, 4]);
    ctx.beginPath();
    ctx.moveTo(x, chartArea.top);
    ctx.lineTo(x, chartArea.bottom);
    ctx.stroke();
    ctx.setLineDash([]);

    ctx.fillStyle = t.amber;
    ctx.font = "600 14px sans-serif";
    ctx.textAlign = nearRightEdge ? "right" : "left";
    ctx.fillText(`p90 ≈ ${Math.round(p90Value)} min`, x + (nearRightEdge ? -8 : 8), chartArea.top + 18);
    ctx.restore();
  },
};

// --- Chart ---------------------------------------------------------------
new Chart(canvas, {
  type: "line",
  data: {
    labels: binLabels,
    datasets: [
      {
        label: "Cumulative proportion",
        data: cumulativeProportion,
        borderColor: t.palette[0],
        backgroundColor: `${t.palette[0]}26`,
        borderWidth: 3,
        pointRadius: 0,
        pointHoverRadius: 0,
        stepped: "after",
        fill: "origin",
      },
    ],
  },
  options: {
    responsive: true,
    maintainAspectRatio: false,
    animation: false,
    plugins: {
      title: {
        display: true,
        text: "histogram-cumulative · javascript · chartjs · anyplot.ai",
        color: t.ink,
        font: { size: 22, weight: "500" },
        padding: { bottom: 20 },
      },
      legend: { display: false },
      tooltip: { enabled: false },
    },
    scales: {
      x: {
        ticks: { color: t.inkSoft, font: { size: 14 }, maxRotation: 0, autoSkip: true },
        grid: { display: false },
        title: { display: true, text: "Delivery Time (minutes)", color: t.ink, font: { size: 16 } },
      },
      y: {
        min: 0,
        max: 1,
        ticks: {
          color: t.inkSoft,
          font: { size: 14 },
          callback: (value) => `${Math.round(value * 100)}%`,
        },
        grid: { color: t.grid },
        title: { display: true, text: "Cumulative Share of Deliveries", color: t.ink, font: { size: 16 } },
      },
    },
  },
  plugins: [p90MarkerPlugin],
});
Runnable source as JSON, for any HTTP client: https://api.anyplot.ai/specs/histogram-cumulative/chartjs/code. Any spec id and library id listed in llms-full.txt fit the same URL shape; every URL below is complete and callable.
{
  "spec_id": "histogram-cumulative",
  "language": "javascript",
  "library": "chartjs",
  "page": "https://anyplot.ai/histogram-cumulative/javascript/chartjs",
  "hub": "https://anyplot.ai/histogram-cumulative",
  "code_json": "https://api.anyplot.ai/specs/histogram-cumulative/chartjs/code",
  "spec_json": "https://api.anyplot.ai/specs/histogram-cumulative",
  "render_light_png": "https://storage.googleapis.com/anyplot-images/plots/histogram-cumulative/javascript/chartjs/plot-light.png",
  "render_dark_png": "https://storage.googleapis.com/anyplot-images/plots/histogram-cumulative/javascript/chartjs/plot-dark.png",
  "interactive_light_html": "https://storage.googleapis.com/anyplot-images/plots/histogram-cumulative/javascript/chartjs/plot-light.html",
  "interactive_dark_html": "https://storage.googleapis.com/anyplot-images/plots/histogram-cumulative/javascript/chartjs/plot-dark.html",
  "quality_score": 92.0,
  "license": "MIT",
  "guide": "https://anyplot.ai/llms.txt"
}
Part of Cumulative Histogram on anyplot.ai.