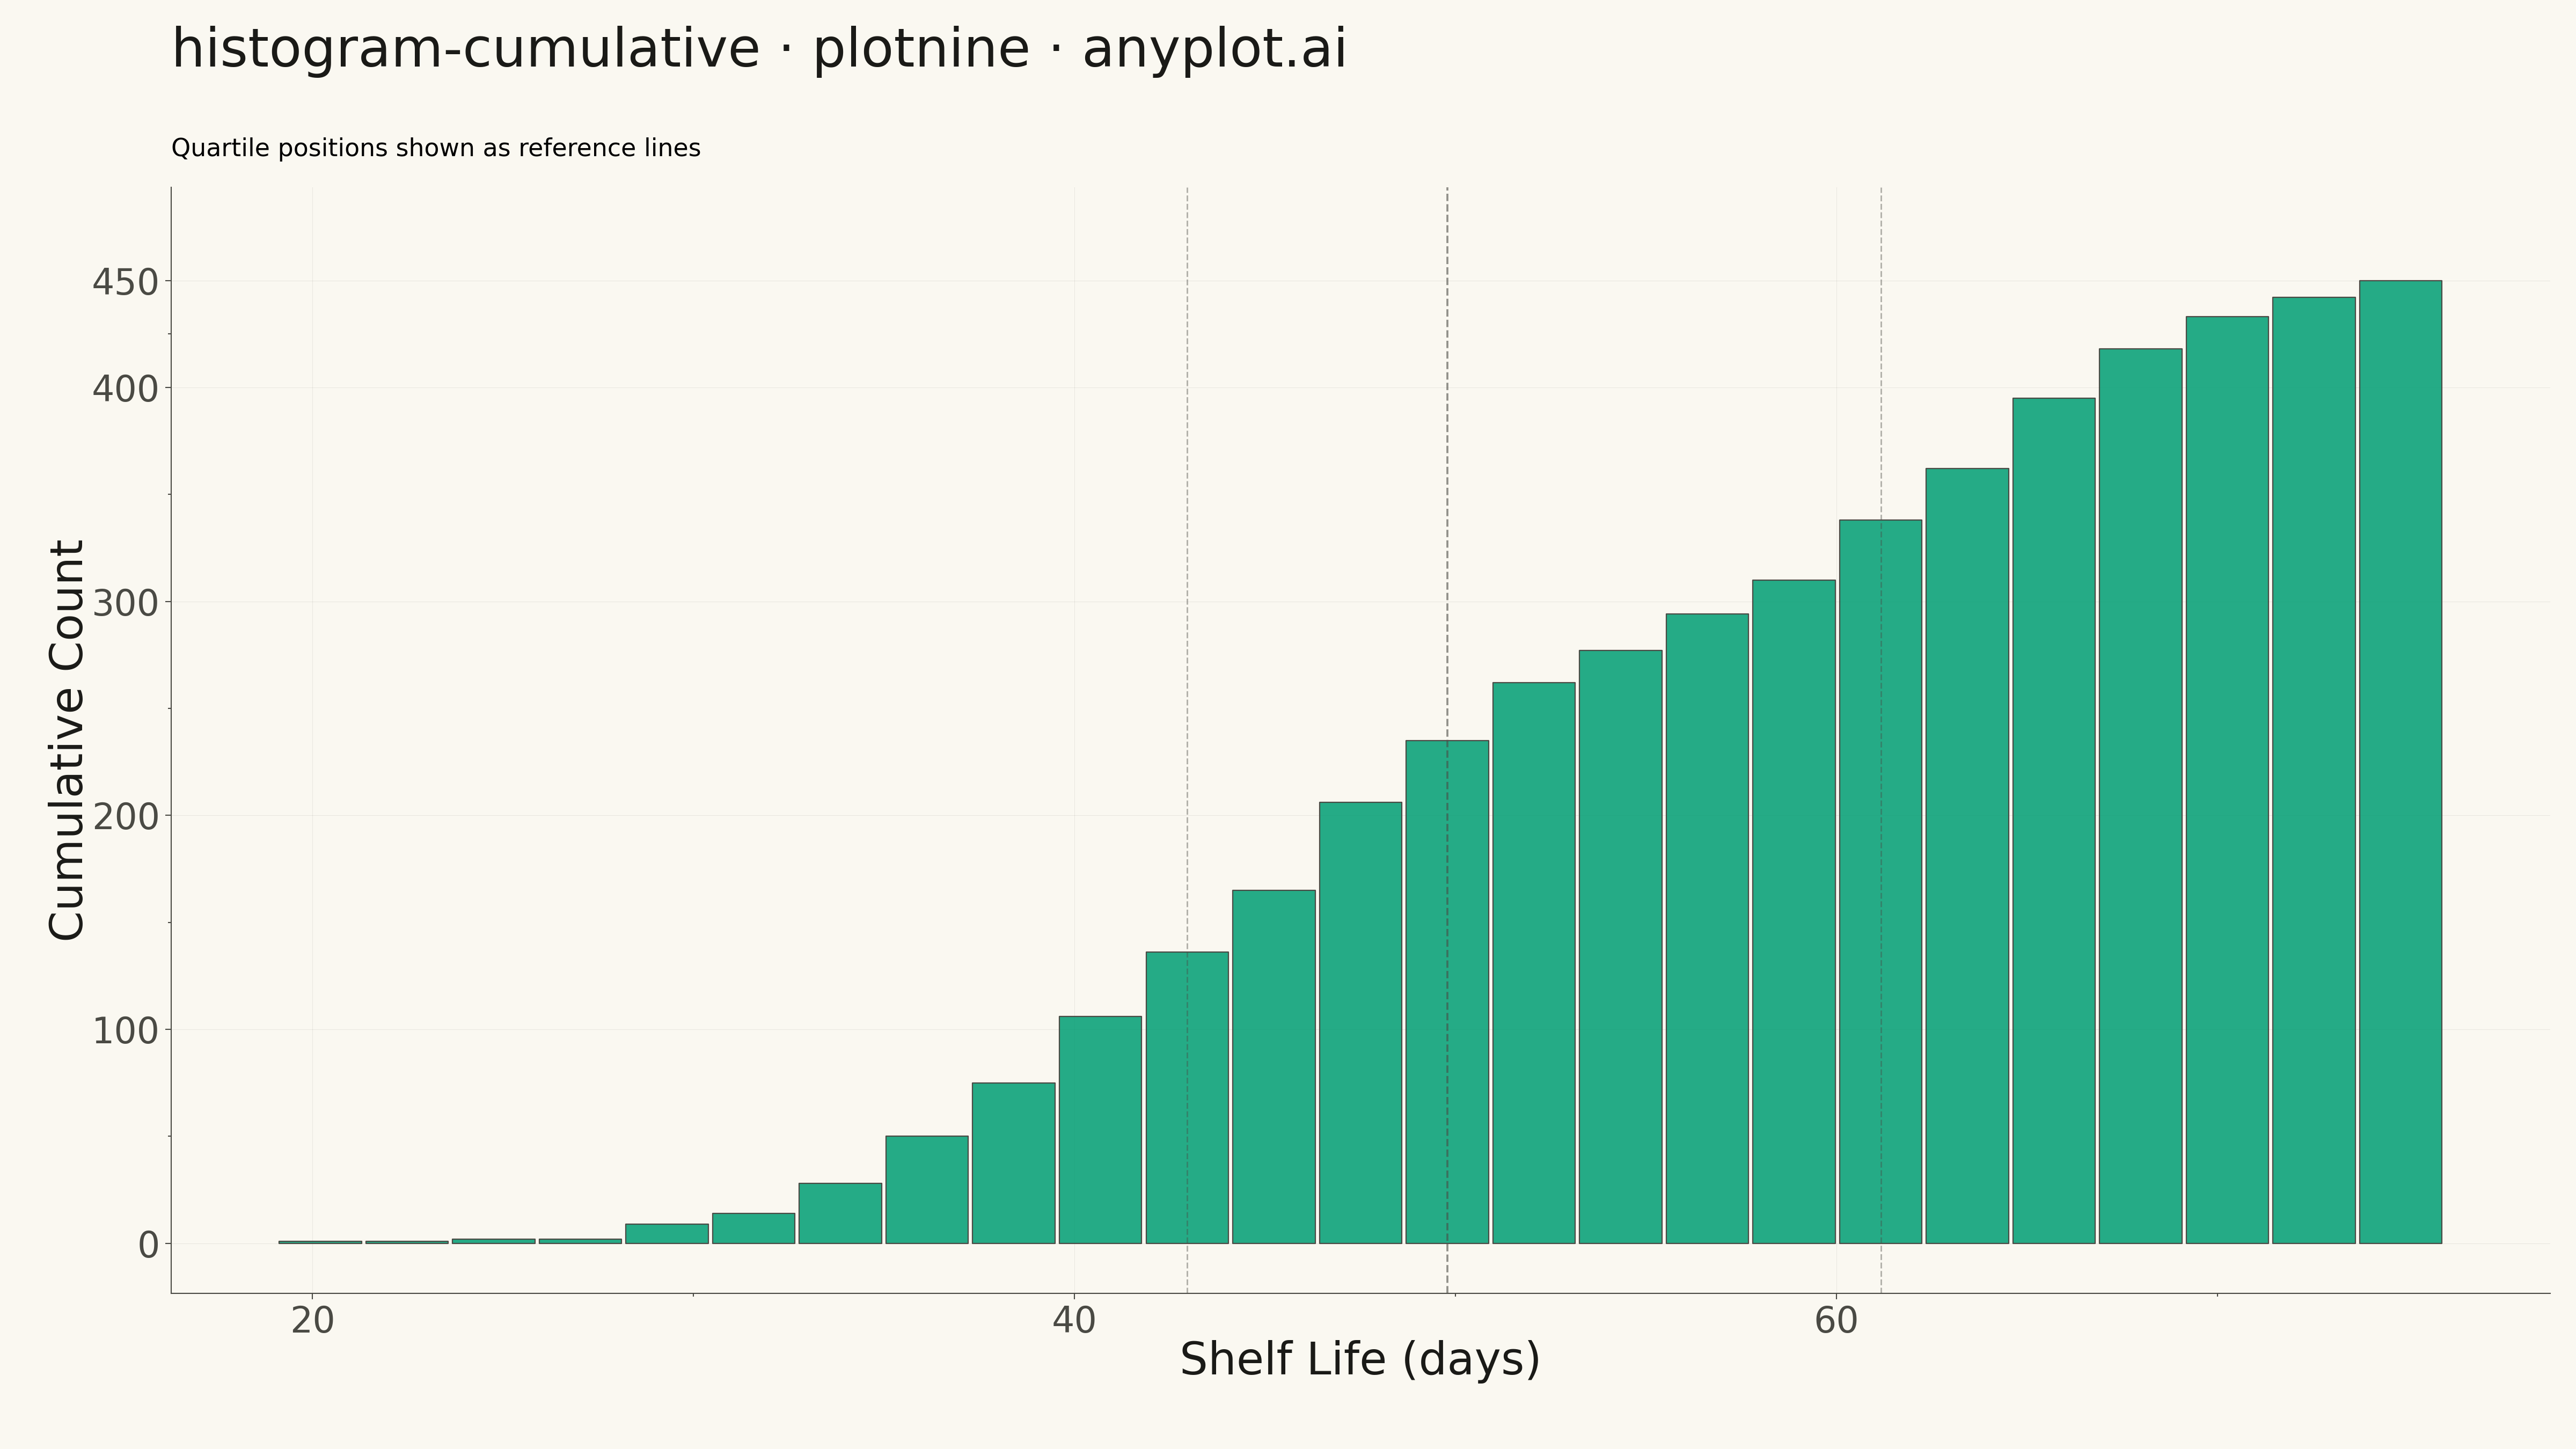
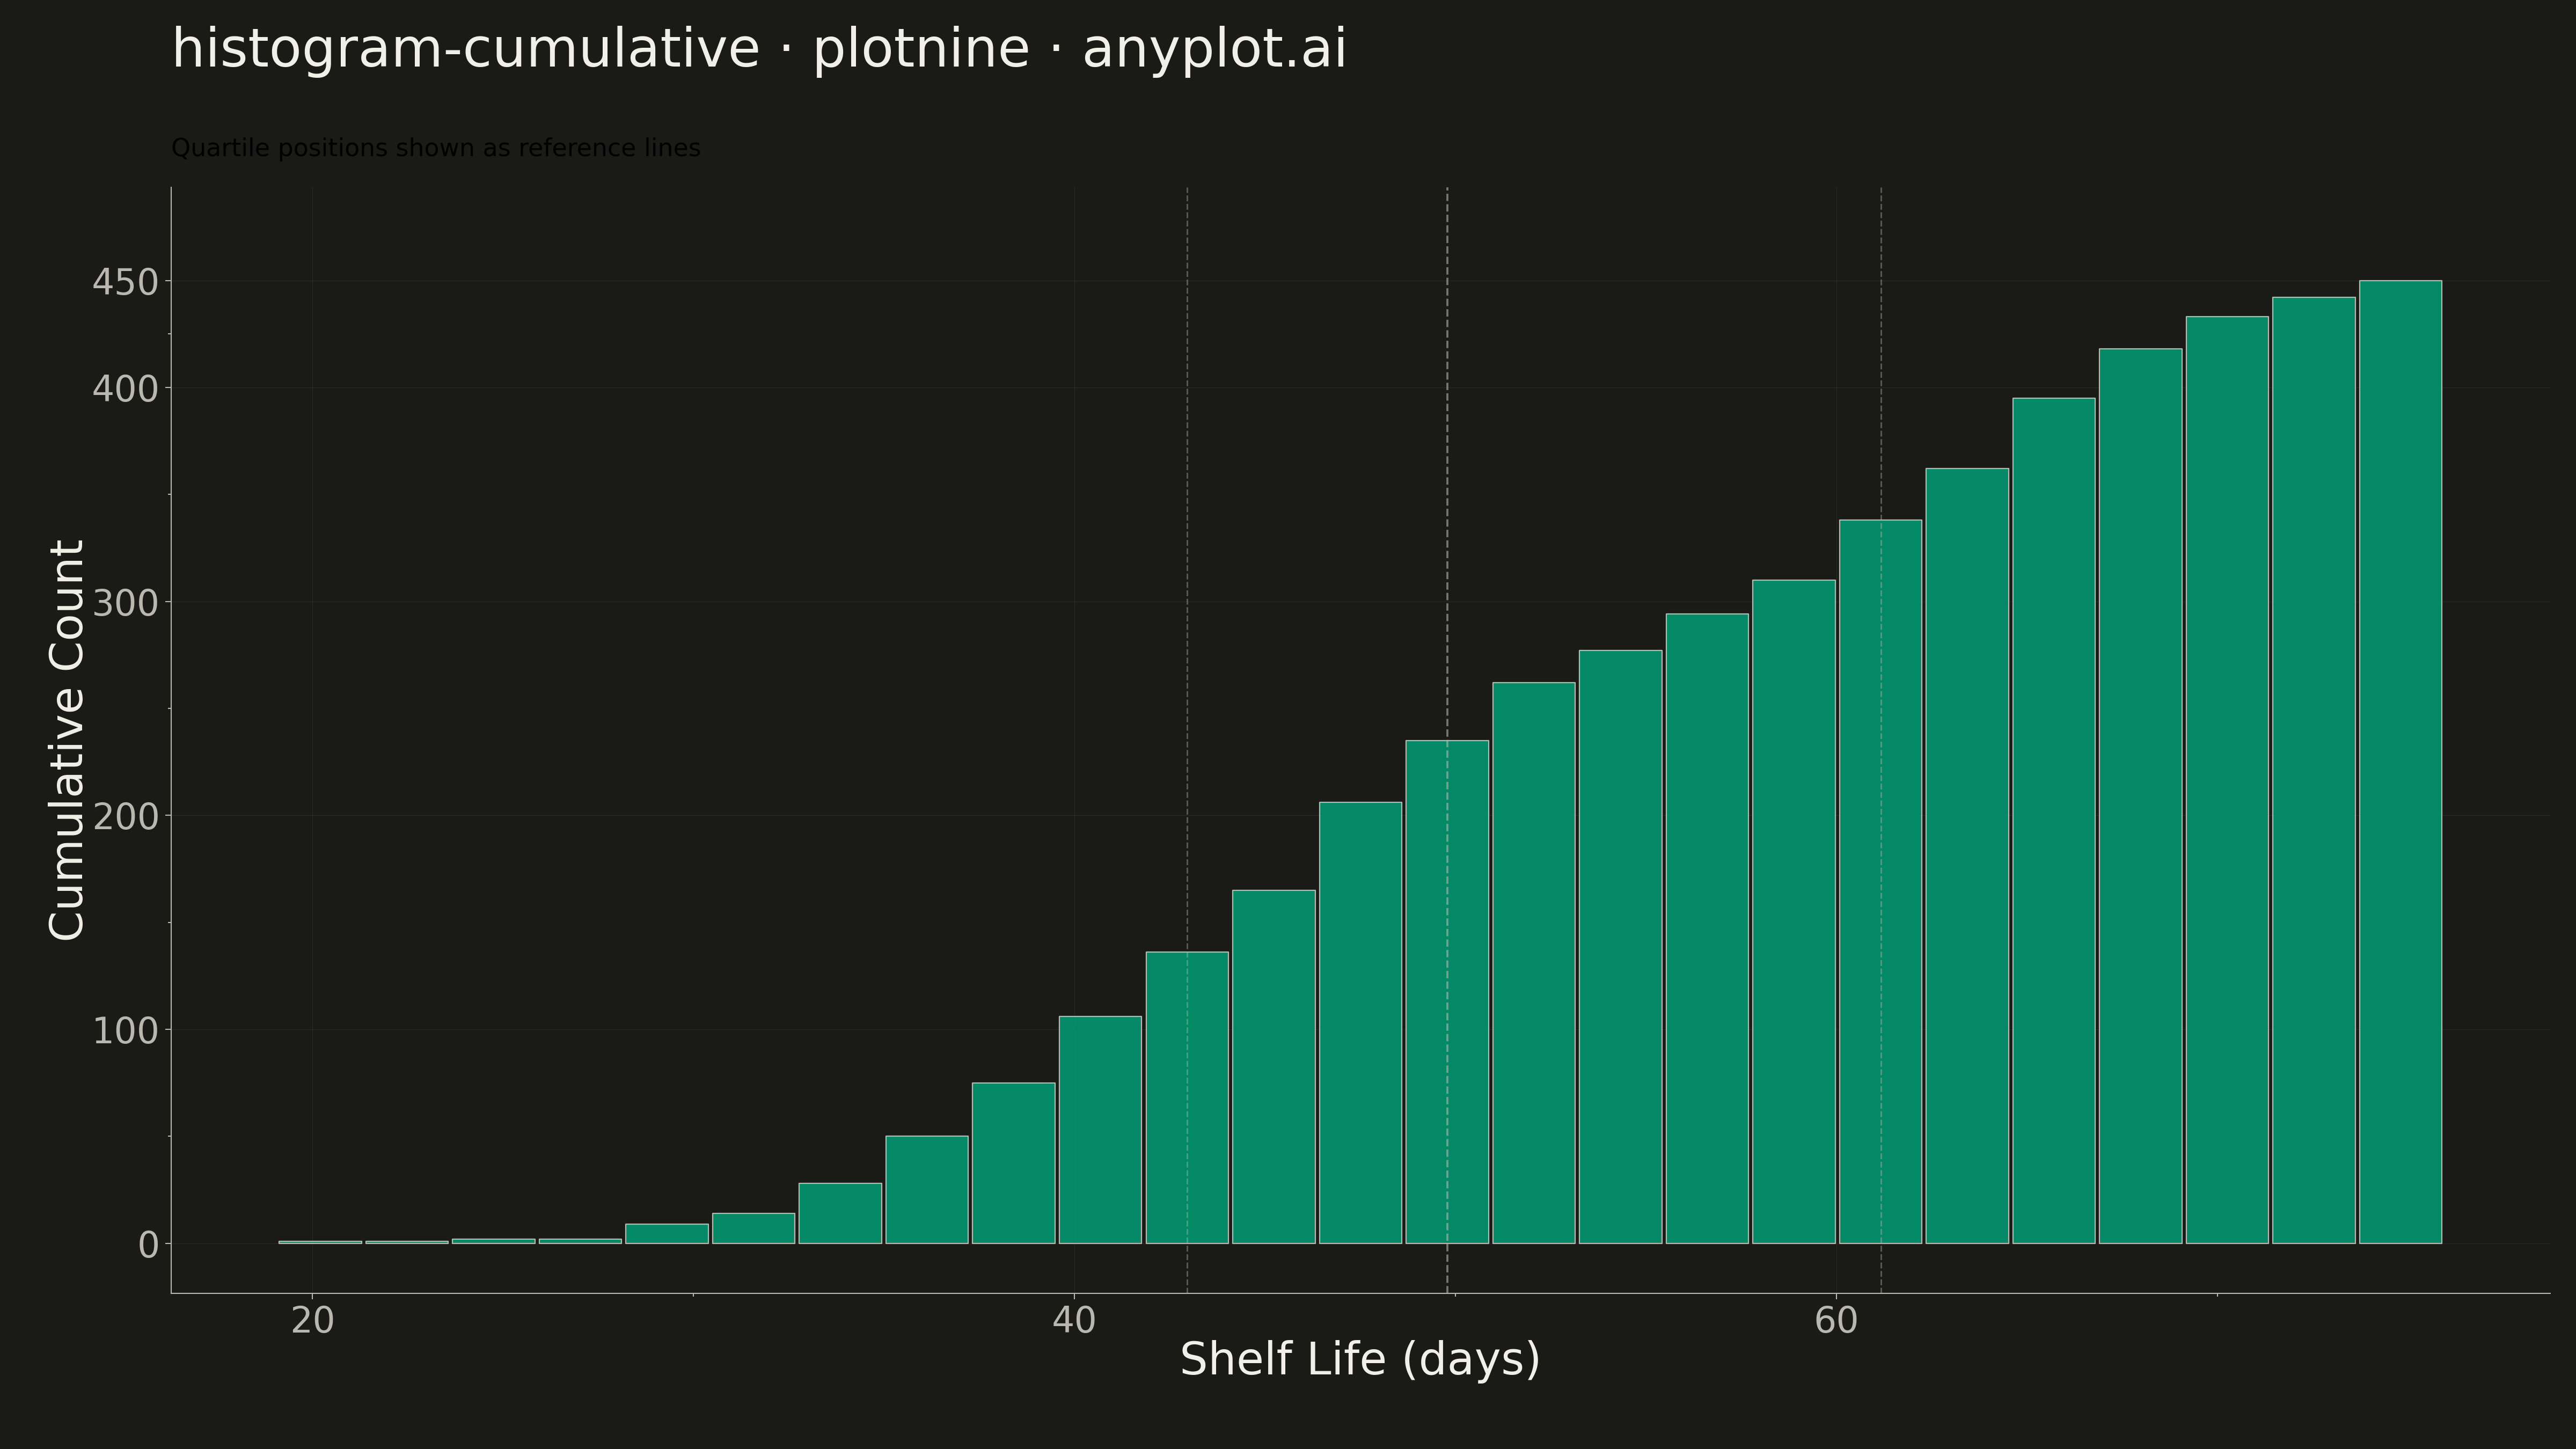
A cumulative histogram (also known as an ogive or cumulative frequency histogram) displays the running total of observations up to each bin boundary. The y-axis shows cumulative count or proportion, creating a monotonically increasing step function that reaches the total sample size (or 1.0 for normalized).
""" anyplot.ai
histogram-cumulative: Cumulative Histogram
Library: plotnine 0.15.4 | Python 3.13.13
Quality: 93/100 | Updated: 2026-05-11
"""

import sys


sys.path = [p for p in sys.path if p and not p.endswith("/python")]

import os

import numpy as np
import pandas as pd
from plotnine import (
    aes,
    element_blank,
    element_line,
    element_rect,
    element_text,
    geom_bar,
    geom_vline,
    ggplot,
    ggsave,
    labs,
    scale_y_continuous,
    theme,
    theme_minimal,
)


# Theme tokens
THEME = os.getenv("ANYPLOT_THEME", "light")
PAGE_BG = "#FAF8F1" if THEME == "light" else "#1A1A17"
ELEVATED_BG = "#FFFDF6" if THEME == "light" else "#242420"
INK = "#1A1A17" if THEME == "light" else "#F0EFE8"
INK_SOFT = "#4A4A44" if THEME == "light" else "#B8B7B0"
BRAND = "#009E73"

# Data - Product shelf life measurements (days until expiration)
np.random.seed(42)
shelf_life = np.concatenate([np.random.normal(45, 8, 300), np.random.normal(65, 5, 150)])

# Calculate cumulative histogram
n_bins = 25
hist, bin_edges = np.histogram(shelf_life, bins=n_bins)
cumulative_counts = np.cumsum(hist)
bin_centers = (bin_edges[:-1] + bin_edges[1:]) / 2
bin_width = bin_edges[1] - bin_edges[0]

# Create DataFrame with cumulative counts
df_hist = pd.DataFrame({"bin_center": bin_centers, "cumulative_count": cumulative_counts})

total = len(shelf_life)

# Theme - L-shaped spine (remove top and right), improve visual hierarchy
anyplot_theme = theme(
    plot_background=element_rect(fill=PAGE_BG, color=PAGE_BG),
    panel_background=element_rect(fill=PAGE_BG, color=PAGE_BG),
    panel_grid_major=element_line(color=INK, size=0.25, alpha=0.08),
    panel_grid_minor=element_blank(),
    panel_border=element_blank(),
    axis_title=element_text(color=INK, size=20, margin={"b": 10, "l": 10}),
    axis_text=element_text(color=INK_SOFT, size=16),
    axis_line=element_line(color=INK_SOFT, size=0.5),
    axis_ticks=element_line(color=INK_SOFT, size=0.5),
    plot_title=element_text(color=INK, size=24, margin={"b": 15}),
    figure_size=(16, 9),
)

# Calculate quartile positions for visual reference
q1_idx = np.searchsorted(cumulative_counts, total * 0.25)
q2_idx = np.searchsorted(cumulative_counts, total * 0.50)
q3_idx = np.searchsorted(cumulative_counts, total * 0.75)

q1_x = bin_centers[q1_idx] if q1_idx < len(bin_centers) else bin_centers[-1]
q2_x = bin_centers[q2_idx] if q2_idx < len(bin_centers) else bin_centers[-1]
q3_x = bin_centers[q3_idx] if q3_idx < len(bin_centers) else bin_centers[-1]

# Plot - with visual emphasis on quartile positions
plot = (
    ggplot(df_hist, aes(x="bin_center", y="cumulative_count"))
    + geom_bar(stat="identity", width=bin_width * 0.95, fill=BRAND, color=INK_SOFT, alpha=0.85, size=0.3)
    + geom_vline(xintercept=q1_x, linetype="dashed", color=INK_SOFT, size=0.4, alpha=0.4)
    + geom_vline(xintercept=q2_x, linetype="dashed", color=INK_SOFT, size=0.5, alpha=0.6)
    + geom_vline(xintercept=q3_x, linetype="dashed", color=INK_SOFT, size=0.4, alpha=0.4)
    + labs(
        x="Shelf Life (days)",
        y="Cumulative Count",
        title="histogram-cumulative · plotnine · anyplot.ai",
        subtitle="Quartile positions shown as reference lines",
    )
    + scale_y_continuous(breaks=[0, 100, 200, 300, 400, total], limits=(0, total + 20))
    + theme_minimal()
    + anyplot_theme
)

# Save
script_dir = os.path.dirname(os.path.abspath(__file__))
output_file = os.path.join(script_dir, f"plot-{THEME}.png")
ggsave(plot, filename=output_file, dpi=300, width=16, height=9, verbose=False)
Runnable source as JSON, for any HTTP client: https://api.anyplot.ai/specs/histogram-cumulative/plotnine/code. Any spec id and library id listed in llms-full.txt fit the same URL shape; every URL below is complete and callable.
{
  "spec_id": "histogram-cumulative",
  "language": "python",
  "library": "plotnine",
  "page": "https://anyplot.ai/histogram-cumulative/python/plotnine",
  "hub": "https://anyplot.ai/histogram-cumulative",
  "code_json": "https://api.anyplot.ai/specs/histogram-cumulative/plotnine/code",
  "spec_json": "https://api.anyplot.ai/specs/histogram-cumulative",
  "render_light_png": "https://storage.googleapis.com/anyplot-images/plots/histogram-cumulative/python/plotnine/plot-light.png",
  "render_dark_png": "https://storage.googleapis.com/anyplot-images/plots/histogram-cumulative/python/plotnine/plot-dark.png",
  "quality_score": 93.0,
  "license": "MIT",
  "guide": "https://anyplot.ai/llms.txt"
}
Part of Cumulative Histogram on anyplot.ai.