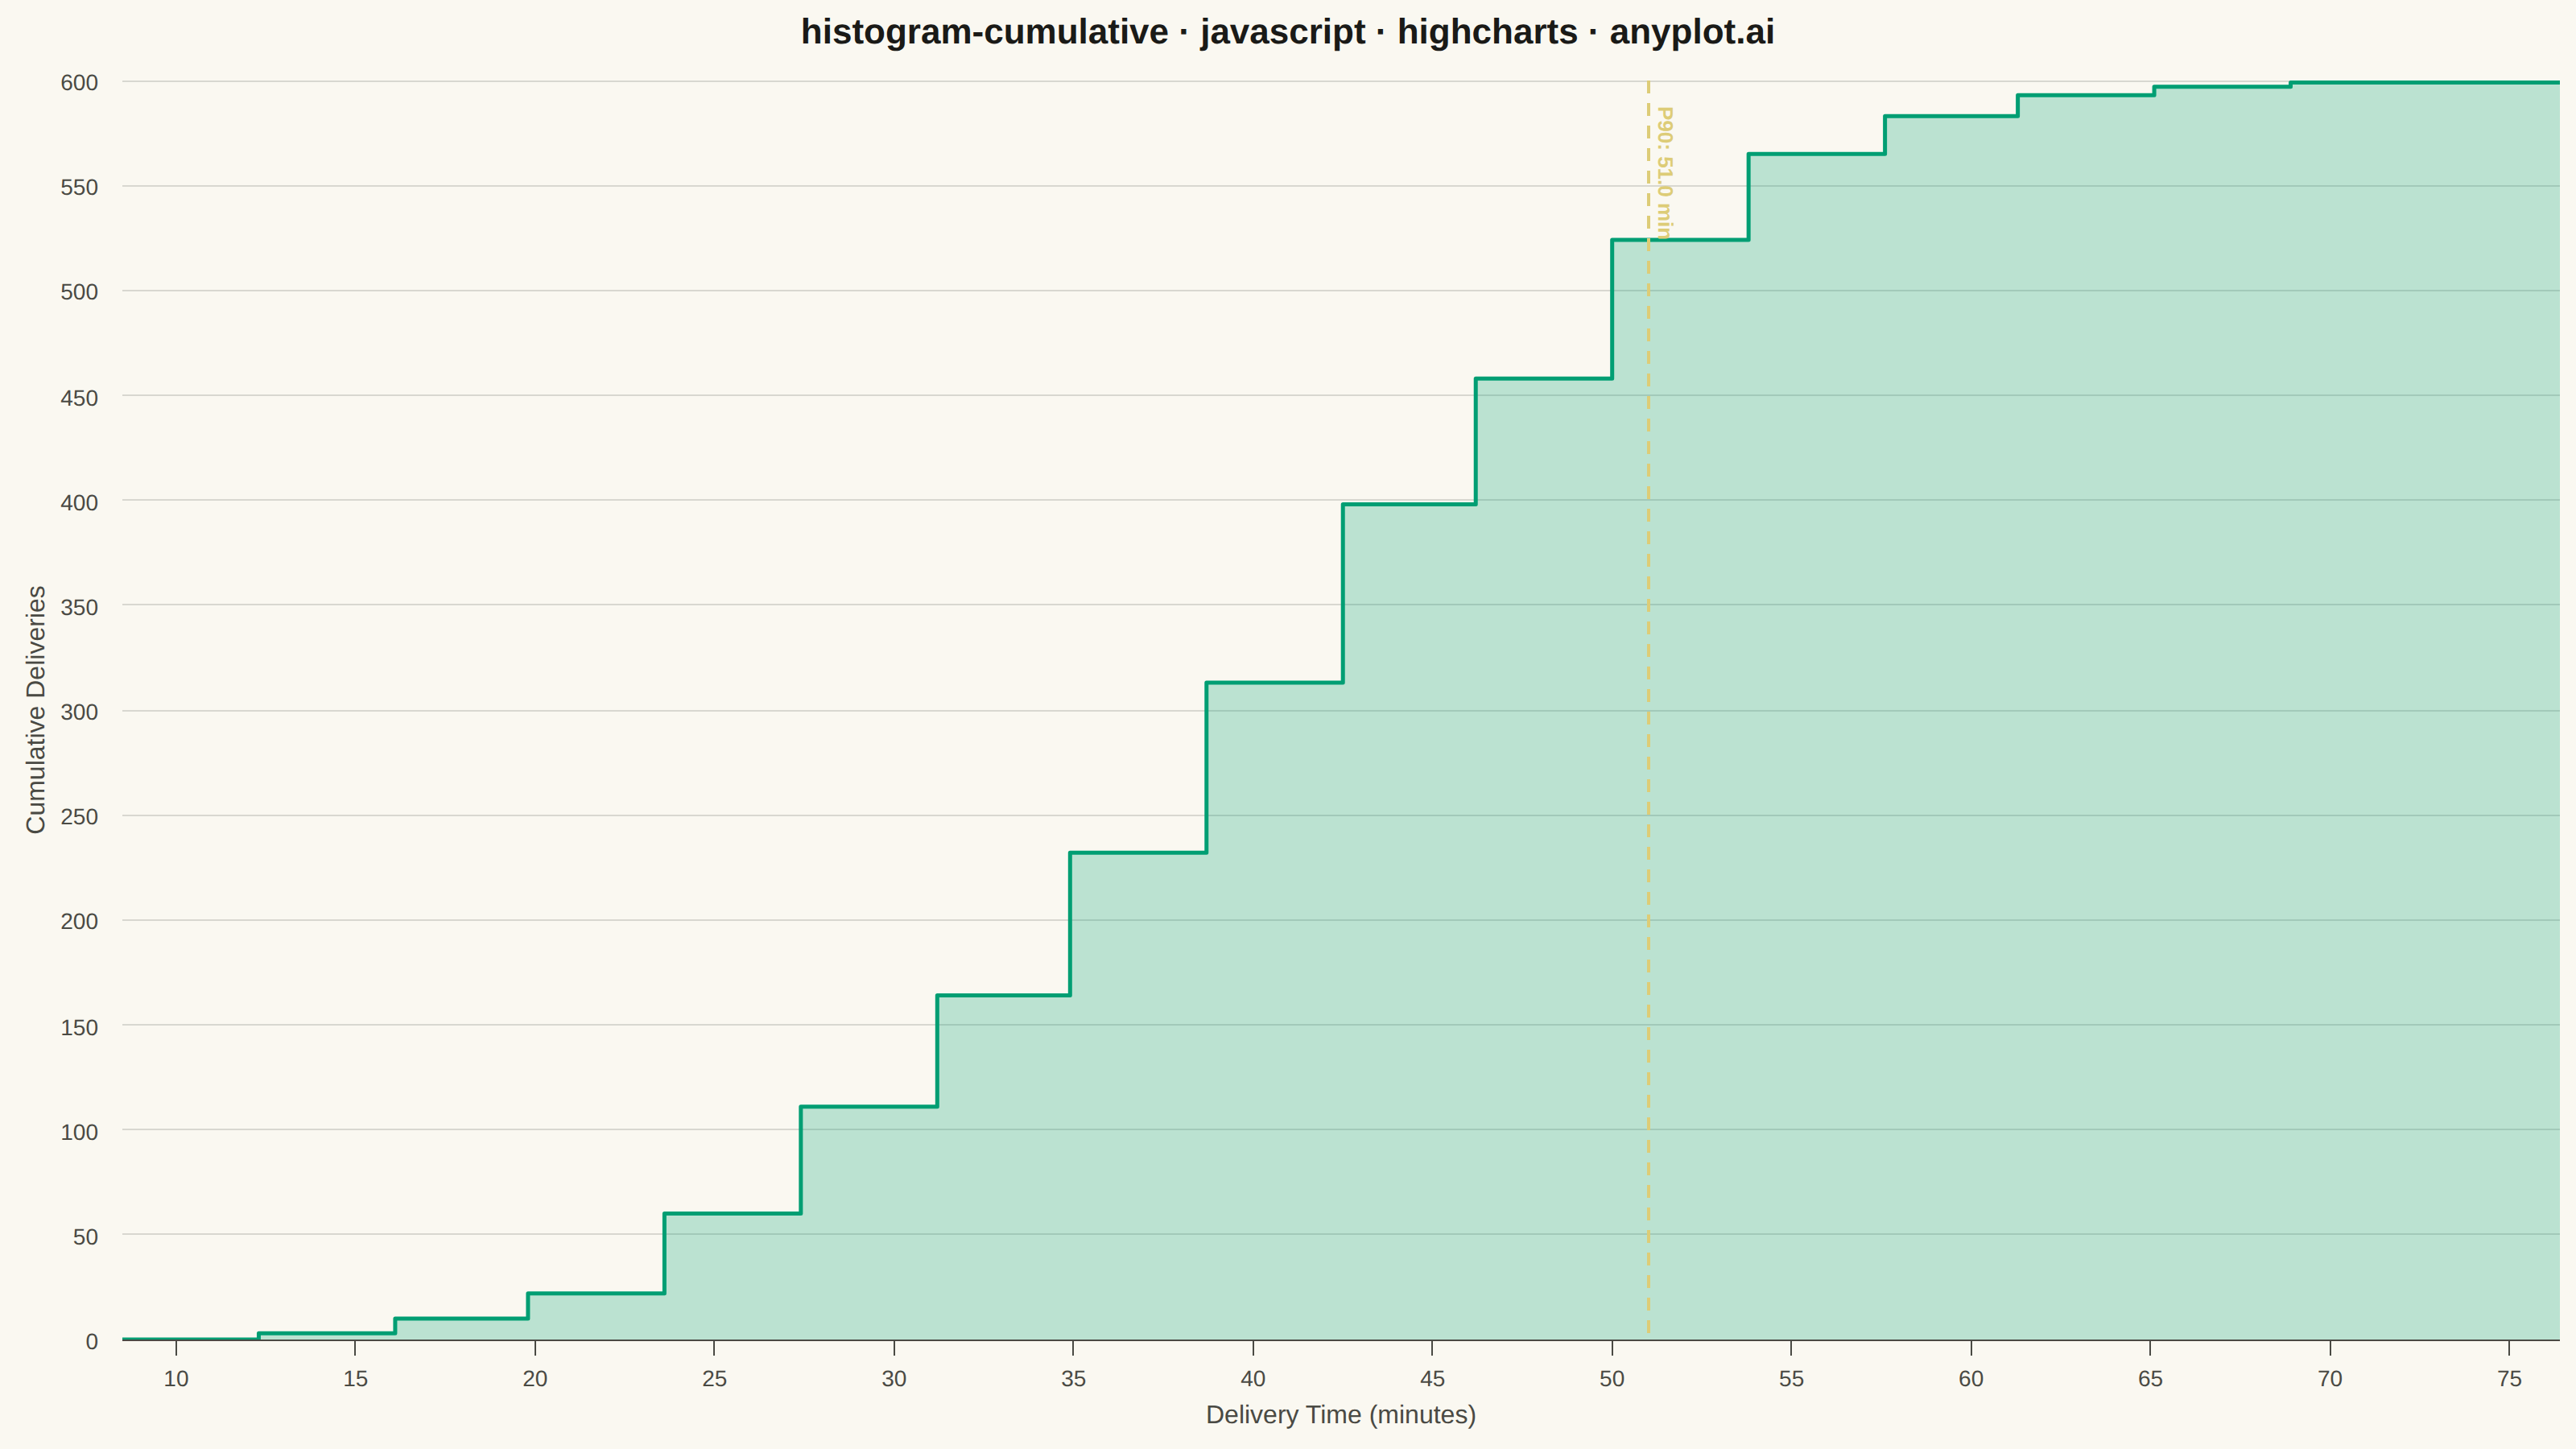
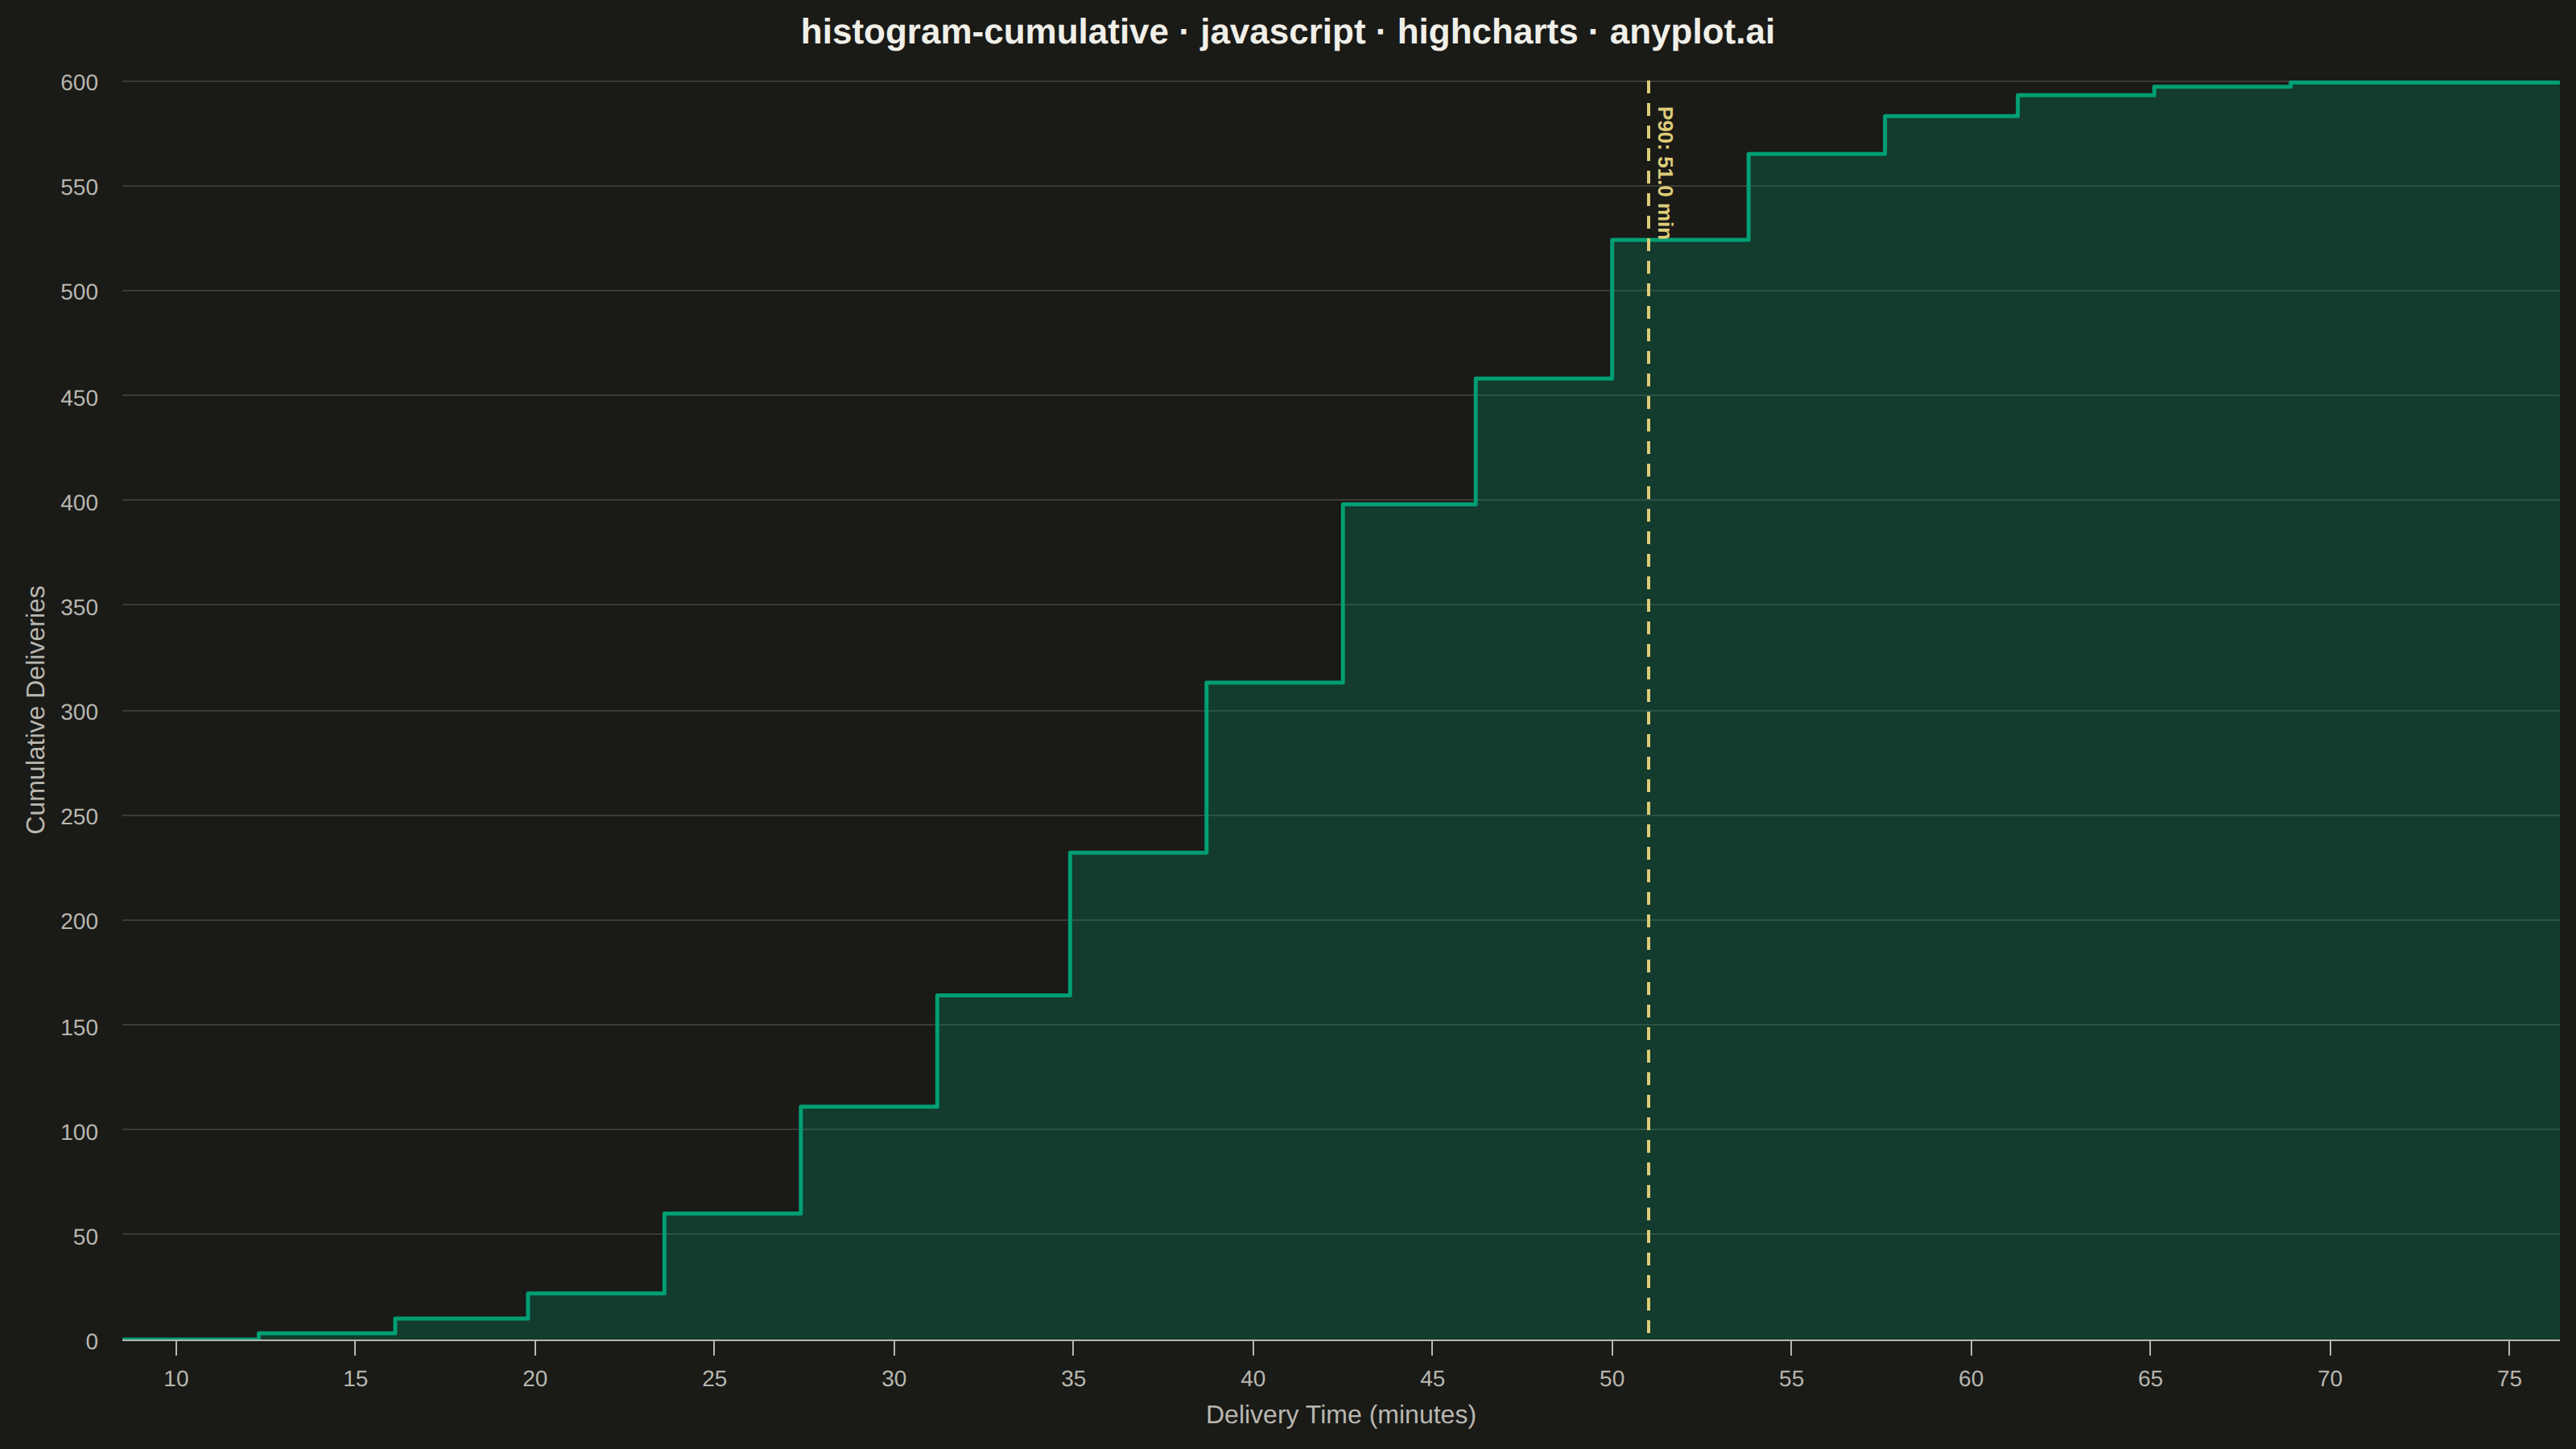
The same plot in 14 other libraries — JavaScript: Chart.js, D3.js, Apache ECharts, MUI X Charts; Python: Altair, Bokeh, lets-plot, Matplotlib, Plotly, plotnine, Pygal, Seaborn; R: ggplot2; Julia: Makie.jl. Compare all 15 side by side: Cumulative Histogram in Python, R, Julia and JavaScript.
A cumulative histogram (also known as an ogive or cumulative frequency histogram) displays the running total of observations up to each bin boundary. The y-axis shows cumulative count or proportion, creating a monotonically increasing step function that reaches the total sample size (or 1.0 for normalized).
// anyplot.ai
// histogram-cumulative: Cumulative Histogram
// Library: highcharts 12.6.0 | JavaScript 22.23.2
// Quality: 84/100 | Created: 2026-09-05
//# anyplot-orientation: landscape
const t = window.ANYPLOT_TOKENS;
// --- Data (in-memory, deterministic) ---------------------------------------
// Fixed-seed LCG — the browser has no seeded RNG, so this stands in for
// np.random.seed(42) to keep the sample reproducible across renders.
let seed = 42;
function lcgRandom() {
seed = (seed * 1664525 + 1013904223) % 4294967296;
return seed / 4294967296;
}
function randomNormal(mean, std) {
const u1 = lcgRandom() || 1e-9;
const u2 = lcgRandom();
const z = Math.sqrt(-2 * Math.log(u1)) * Math.cos(2 * Math.PI * u2);
return mean + z * std;
}
const sampleSize = 600;
const deliveryTimes = Array.from({ length: sampleSize }, () =>
Math.max(5, randomNormal(38, 11))
);
const binCount = 18;
const minValue = Math.min(...deliveryTimes);
const maxValue = Math.max(...deliveryTimes);
const binWidth = (maxValue - minValue) / binCount;
const binCounts = new Array(binCount).fill(0);
deliveryTimes.forEach((value) => {
const index = Math.min(binCount - 1, Math.floor((value - minValue) / binWidth));
binCounts[index] += 1;
});
let running = 0;
const cumulativeData = binCounts.map((count, i) => {
running += count;
const binEdge = minValue + (i + 1) * binWidth;
return [Math.round(binEdge * 10) / 10, running];
});
// Anchor the curve at the first bin's lower edge so the ogive starts at zero.
cumulativeData.unshift([Math.round(minValue * 10) / 10, 0]);
const firstX = cumulativeData[0][0];
const lastX = cumulativeData[cumulativeData.length - 1][0];
// 90th percentile delivery time — the spec's VaR/quantile use case, called
// out as a distinctive plotLines marker.
const sortedTimes = [...deliveryTimes].sort((a, b) => a - b);
const p90 = sortedTimes[Math.floor(0.9 * (sortedTimes.length - 1))];
// --- Chart -----------------------------------------------------------------
Highcharts.chart("container", {
chart: {
type: "area",
backgroundColor: "transparent",
animation: false,
style: { fontFamily: "inherit" },
},
credits: { enabled: false },
colors: t.palette,
title: {
text: "histogram-cumulative · javascript · highcharts · anyplot.ai",
style: { color: t.ink, fontSize: "22px", fontWeight: "600" },
},
xAxis: {
title: { text: "Delivery Time (minutes)", style: { color: t.inkSoft, fontSize: "16px" } },
lineColor: t.inkSoft,
tickColor: t.inkSoft,
gridLineColor: t.grid,
labels: { style: { color: t.inkSoft, fontSize: "14px" } },
min: firstX,
max: lastX,
plotLines: [
{
value: p90,
color: t.amber,
width: 2,
dashStyle: "Dash",
zIndex: 5,
label: {
text: `P90: ${p90.toFixed(1)} min`,
style: { color: t.amber, fontSize: "13px", fontWeight: "600" },
align: "left",
x: 6,
y: 16,
},
},
],
},
yAxis: {
title: { text: "Cumulative Deliveries", style: { color: t.inkSoft, fontSize: "16px" } },
gridLineColor: t.grid,
min: 0,
max: sampleSize,
labels: { style: { color: t.inkSoft, fontSize: "14px" } },
},
legend: { enabled: false },
tooltip: {
backgroundColor: t.elevatedBg,
borderColor: t.inkSoft,
style: { color: t.ink, fontSize: "14px" },
formatter() {
const pct = ((this.y / sampleSize) * 100).toFixed(1);
return `<b>≤ ${this.x} min</b><br/>Cumulative: ${this.y} deliveries (${pct}%)`;
},
},
plotOptions: {
series: { animation: false },
area: {
step: "left",
lineWidth: 2.5,
fillOpacity: 0.25,
marker: { enabled: false },
},
},
series: [
{
name: "Cumulative deliveries",
data: cumulativeData,
color: t.palette[0],
},
],
});
Runnable source as JSON, for any HTTP client: https://api.anyplot.ai/specs/histogram-cumulative/highcharts/code. Any spec id and library id listed in llms-full.txt fit the same URL shape; every URL below is complete and callable.
{
  "spec_id": "histogram-cumulative",
  "language": "javascript",
  "library": "highcharts",
  "page": "https://anyplot.ai/histogram-cumulative/javascript/highcharts",
  "hub": "https://anyplot.ai/histogram-cumulative",
  "code_json": "https://api.anyplot.ai/specs/histogram-cumulative/highcharts/code",
  "spec_json": "https://api.anyplot.ai/specs/histogram-cumulative",
  "render_light_png": "https://storage.googleapis.com/anyplot-images/plots/histogram-cumulative/javascript/highcharts/plot-light.png",
  "render_dark_png": "https://storage.googleapis.com/anyplot-images/plots/histogram-cumulative/javascript/highcharts/plot-dark.png",
  "interactive_light_html": "https://storage.googleapis.com/anyplot-images/plots/histogram-cumulative/javascript/highcharts/plot-light.html",
  "interactive_dark_html": "https://storage.googleapis.com/anyplot-images/plots/histogram-cumulative/javascript/highcharts/plot-dark.html",
  "quality_score": 84.0,
  "license": "MIT",
  "guide": "https://anyplot.ai/llms.txt"
}
Part of Cumulative Histogram on anyplot.ai.