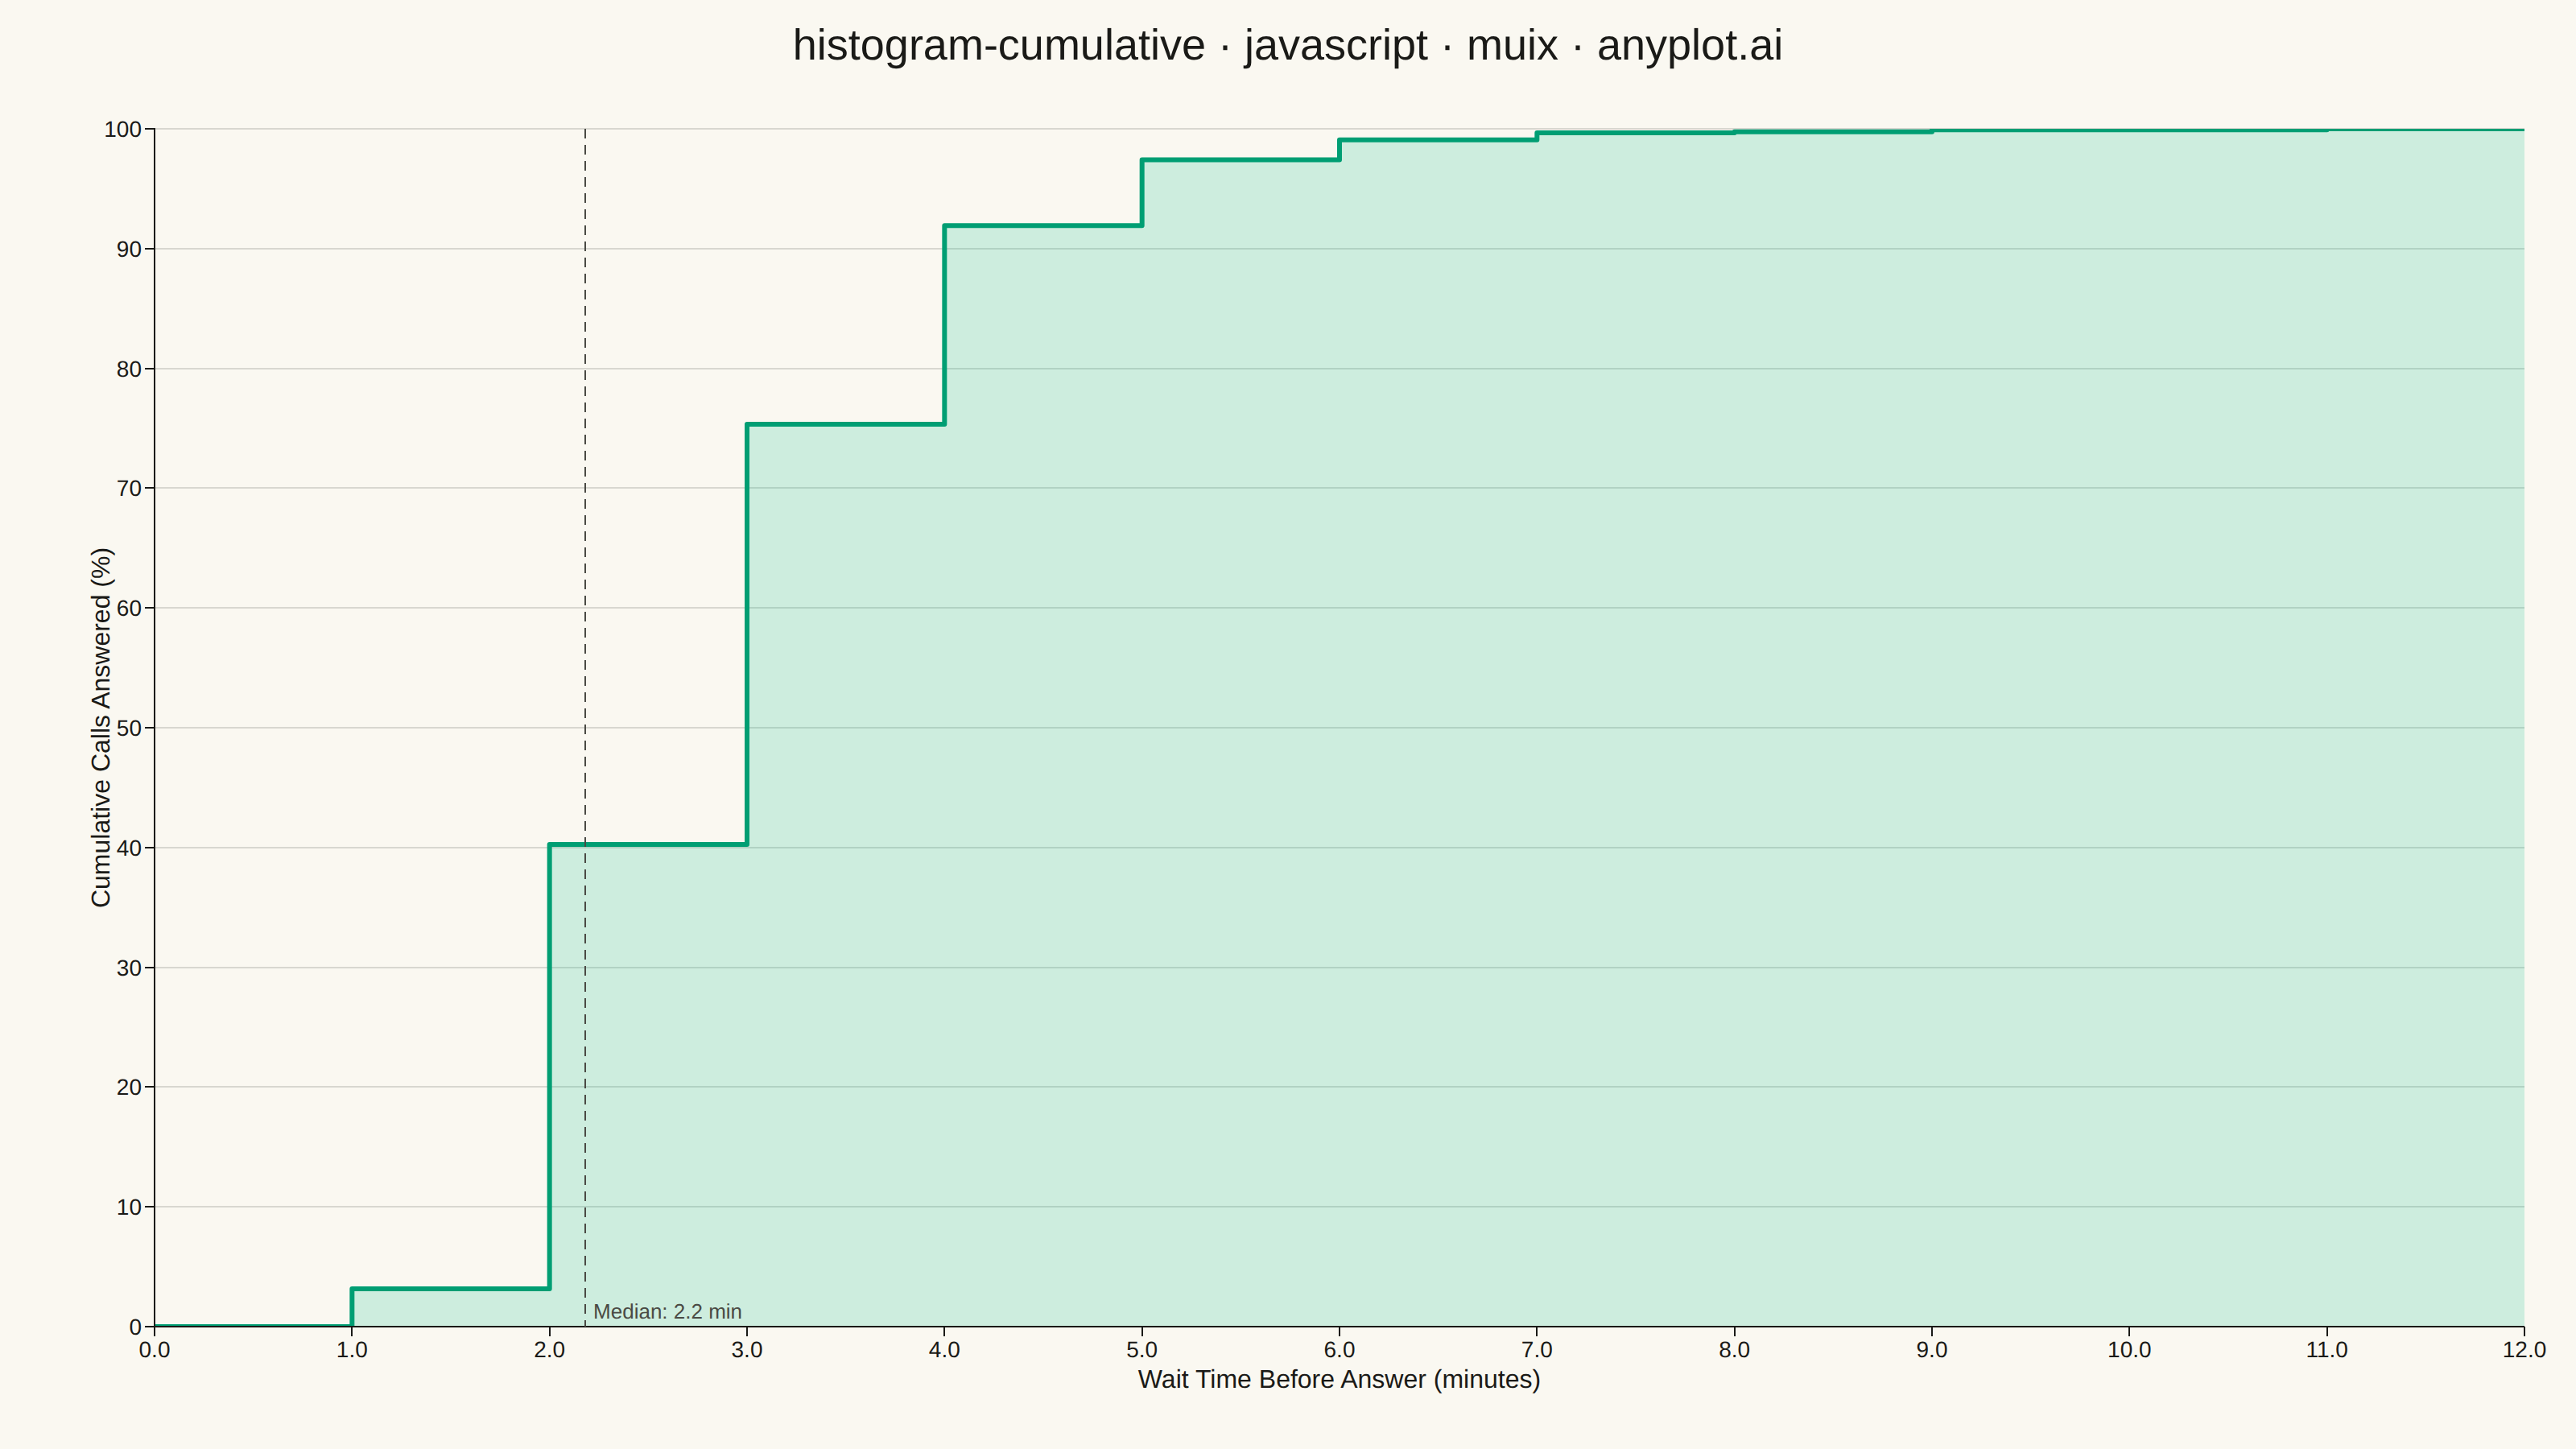
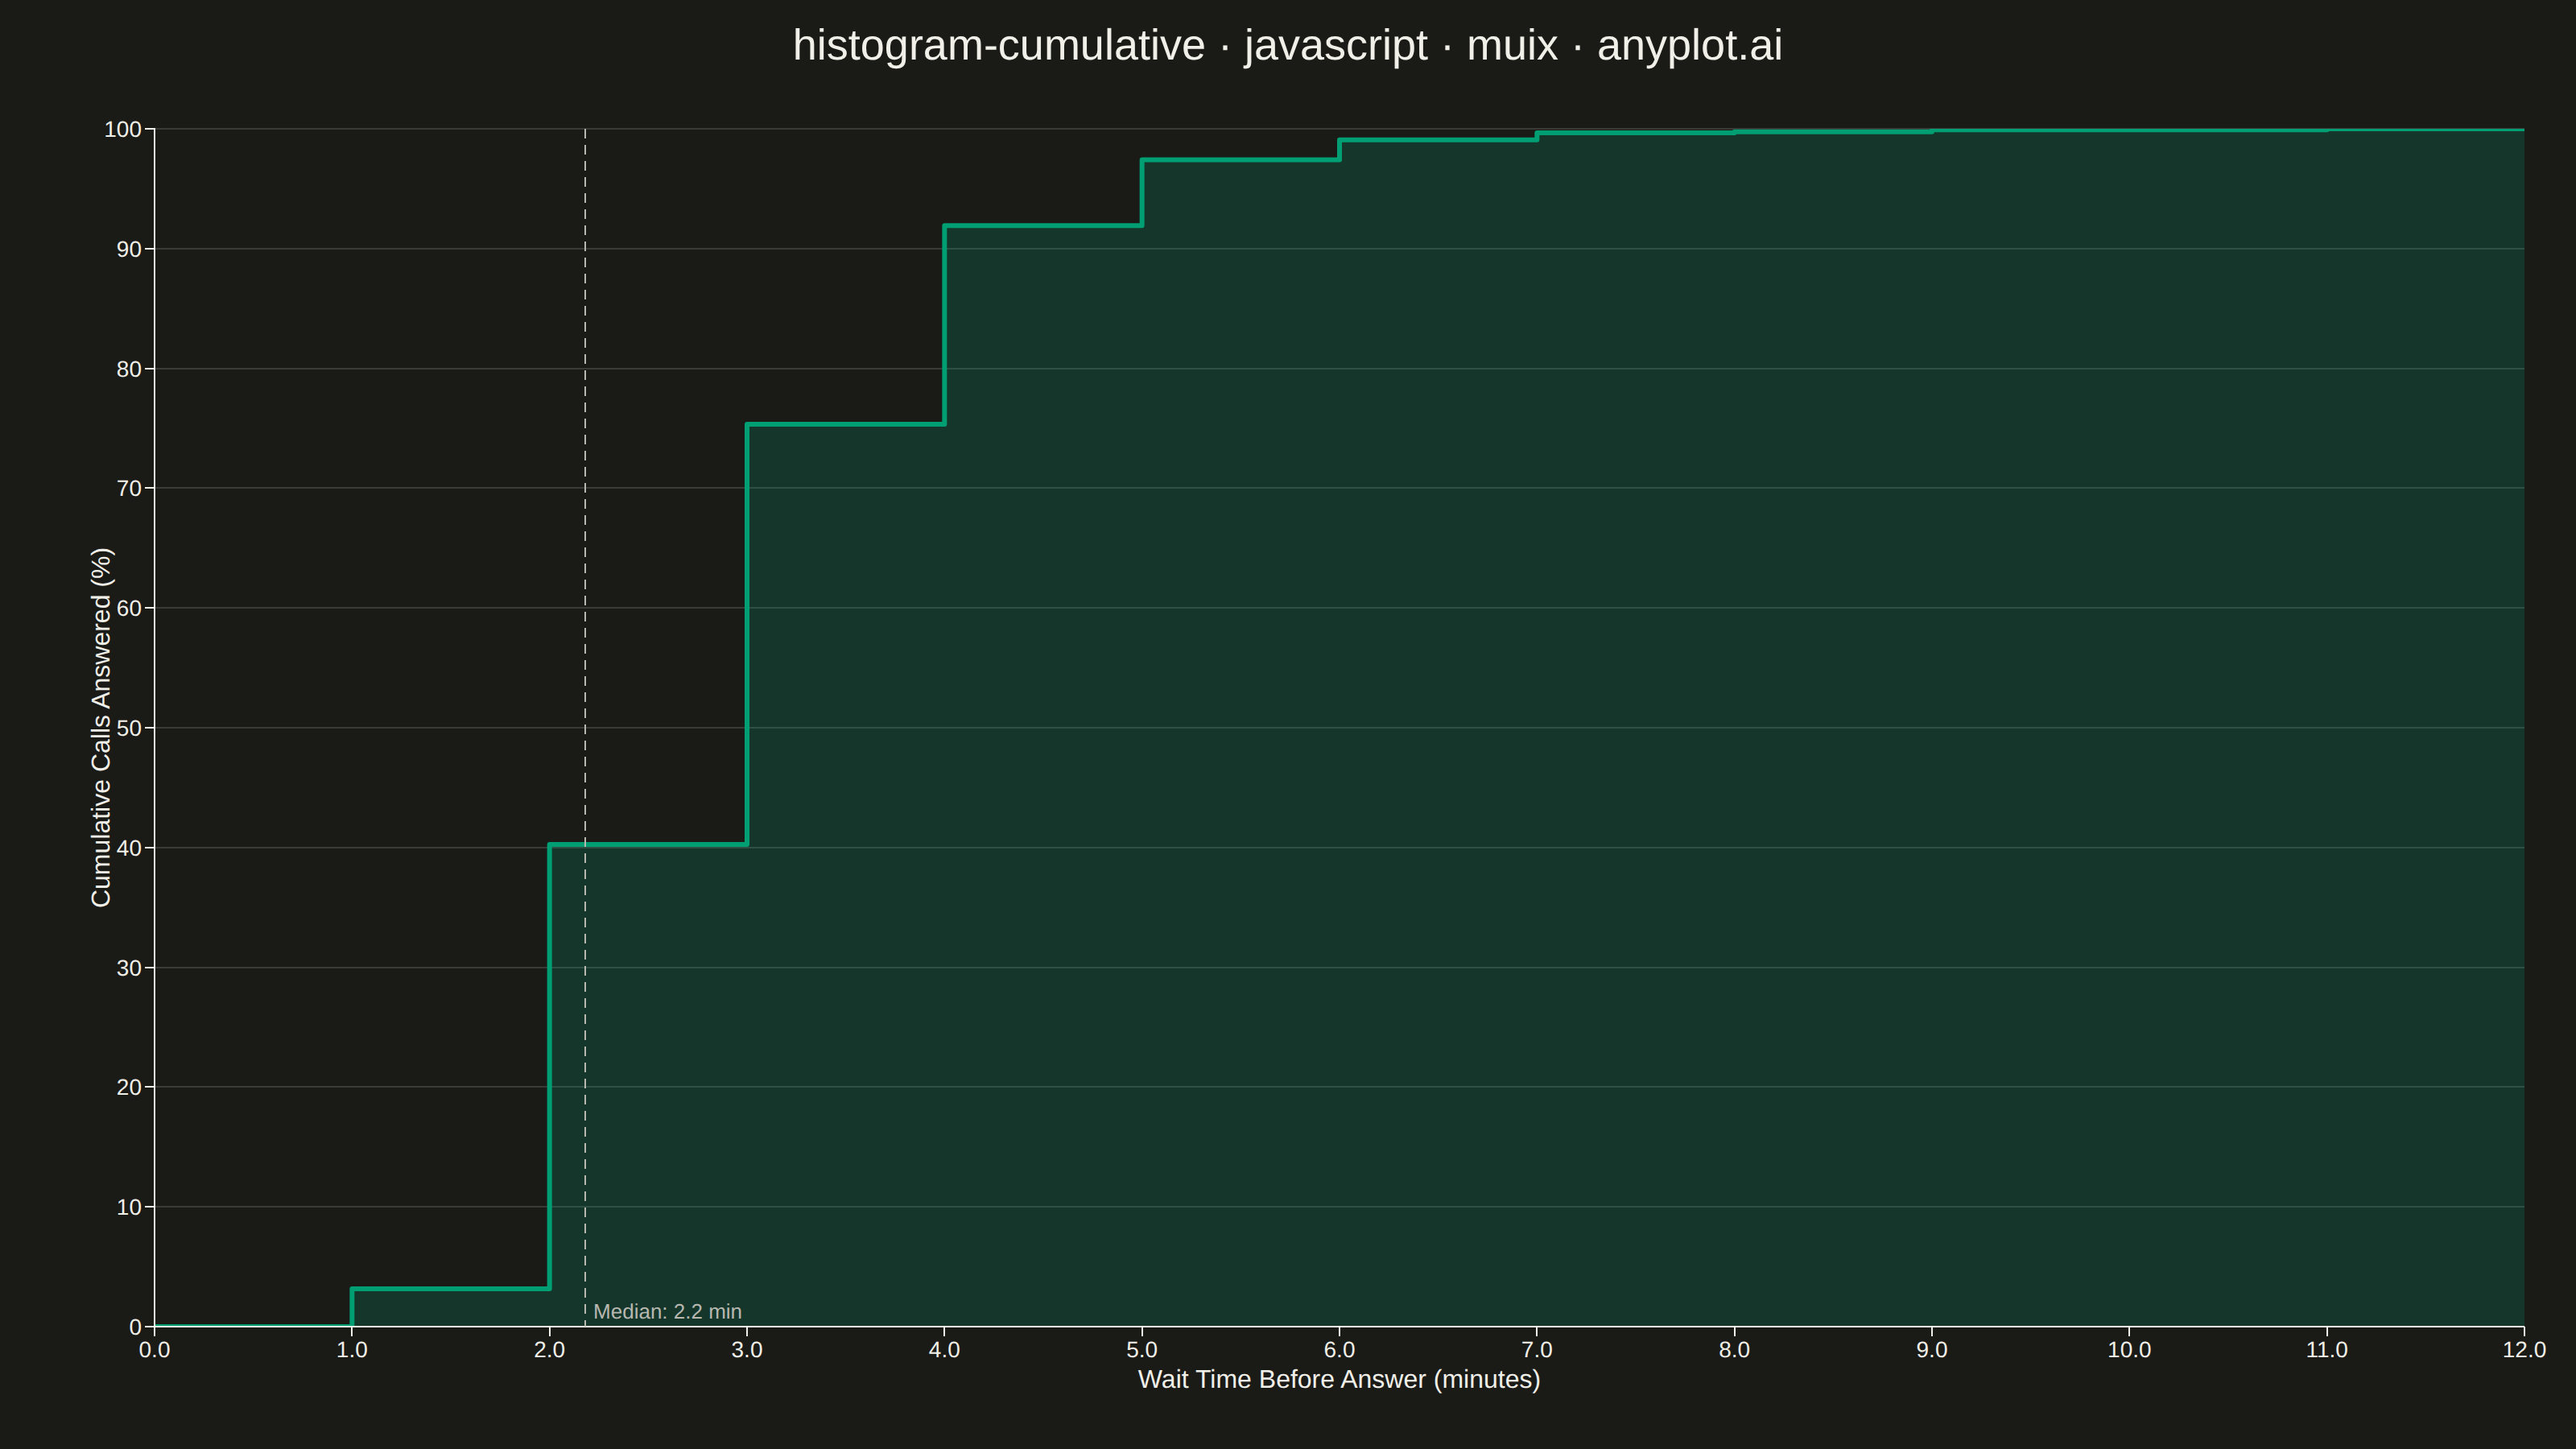
The same plot in 14 other libraries — JavaScript: Chart.js, D3.js, Apache ECharts, Highcharts; Python: Altair, Bokeh, lets-plot, Matplotlib, Plotly, plotnine, Pygal, Seaborn; R: ggplot2; Julia: Makie.jl. Compare all 15 side by side: Cumulative Histogram in Python, R, Julia and JavaScript.
A cumulative histogram (also known as an ogive or cumulative frequency histogram) displays the running total of observations up to each bin boundary. The y-axis shows cumulative count or proportion, creating a monotonically increasing step function that reaches the total sample size (or 1.0 for normalized).
// anyplot.ai
// histogram-cumulative: Cumulative Histogram
// Library: muix 7.29.1 | JavaScript 22.23.2
// Quality: 87/100 | Created: 2026-09-05
import { LineChart } from "@mui/x-charts/LineChart";
import { ChartsReferenceLine } from "@mui/x-charts/ChartsReferenceLine";

const t = window.ANYPLOT_TOKENS;
const TITLE = "histogram-cumulative · javascript · muix · anyplot.ai";
const TITLE_HEIGHT = 56;

// --- Data (in-memory, deterministic): call-center wait times before an agent
// answers. Deterministic LCG so the sampled distribution is stable across
// renders — the browser has no seeded Math.random().
function makeLcg(seed) {
  let state = seed >>> 0;
  return function next() {
    state = (state * 1664525 + 1013904223) >>> 0;
    return state / 4294967296;
  };
}
const rand = makeLcg(42);
function gaussianSample() {
  const u1 = Math.max(rand(), 1e-9);
  const u2 = rand();
  return Math.sqrt(-2 * Math.log(u1)) * Math.cos(2 * Math.PI * u2);
}

// Log-normal draw: most callers wait only a couple of minutes, with a modest
// tail of calls stuck in queue during peak load.
const CALL_COUNT = 1200;
const LOG_MU = Math.log(2.2);
const LOG_SIGMA = 0.45;
const waitMinutes = Array.from({ length: CALL_COUNT }, () => {
  const raw = Math.exp(LOG_MU + LOG_SIGMA * gaussianSample());
  return Math.min(12, raw);
});

// Bin into 1-minute buckets covering the observed range, then accumulate.
const BIN_WIDTH = 1;
const maxWait = Math.max(...waitMinutes);
const binCount = Math.ceil(maxWait / BIN_WIDTH) + 1;
const counts = new Array(binCount).fill(0);
waitMinutes.forEach((minutes) => {
  const idx = Math.min(binCount - 1, Math.floor(minutes / BIN_WIDTH));
  counts[idx] += 1;
});

// Running total up to each bin's right edge, expressed as a percentage of
// all calls — the monotonically non-decreasing ogive.
const binEdges = Array.from({ length: binCount + 1 }, (_, i) => i * BIN_WIDTH);
const cumulativePct = [0];
let running = 0;
counts.forEach((count) => {
  running += count;
  cumulativePct.push((running / CALL_COUNT) * 100);
});

// Median wait time, used as a reference-line focal point for the curve.
const sortedWaits = [...waitMinutes].sort((a, b) => a - b);
const medianWait = sortedWaits[Math.floor(sortedWaits.length / 2)];

// --- Chart (default-exported component — the harness mounts it) -------------
export default function Chart() {
  const { width, height } = window.ANYPLOT_SIZE;
  const chartHeight = height - TITLE_HEIGHT;

  return (
    <div style={{ width, height }}>
      <div
        style={{
          height: TITLE_HEIGHT,
          lineHeight: `${TITLE_HEIGHT}px`,
          textAlign: "center",
          fontSize: 27,
          fontWeight: 500,
          color: t.ink,
        }}
      >
        {TITLE}
      </div>
      <LineChart
        width={width}
        height={chartHeight}
        skipAnimation
        series={[
          {
            data: cumulativePct,
            label: "Calls Answered",
            color: t.palette[0],
            curve: "stepAfter",
            area: true,
            showMark: false,
            valueFormatter: (v) => `${v.toFixed(1)}% of calls`,
          },
        ]}
        xAxis={[
          {
            data: binEdges,
            scaleType: "linear",
            label: "Wait Time Before Answer (minutes)",
            labelStyle: { fontSize: 16, fontWeight: 500 },
            tickLabelStyle: { fontSize: 14 },
            min: 0,
            max: binEdges[binEdges.length - 1],
            // Force whole-minute ticks (binEdges) instead of the auto-generated
            // 0.5-minute increments, which crowd once scaled down for mobile.
            tickInterval: binEdges,
          },
        ]}
        yAxis={[
          {
            label: "Cumulative Calls Answered (%)",
            labelStyle: { fontSize: 16, fontWeight: 500 },
            tickLabelStyle: { fontSize: 14 },
            min: 0,
            max: 100,
          },
        ]}
        grid={{ horizontal: true }}
        margin={{ left: 96, right: 32, top: 24, bottom: 76 }}
        slotProps={{ legend: { hidden: true } }}
        sx={{
          "& .MuiAreaElement-root": { fillOpacity: 0.18 },
          "& .MuiLineElement-root": { strokeWidth: 3 },
          "& .MuiChartsAxis-tickLabel": { fontSize: "14px" },
        }}
      >
        <ChartsReferenceLine
          x={medianWait}
          label={`Median: ${medianWait.toFixed(1)} min`}
          labelAlign="end"
          labelStyle={{ fontSize: 13, fill: t.inkSoft }}
          lineStyle={{ stroke: t.inkSoft, strokeDasharray: "6 4" }}
        />
      </LineChart>
    </div>
  );
}
Runnable source as JSON, for any HTTP client: https://api.anyplot.ai/specs/histogram-cumulative/muix/code. Any spec id and library id listed in llms-full.txt fit the same URL shape; every URL below is complete and callable.
{
  "spec_id": "histogram-cumulative",
  "language": "javascript",
  "library": "muix",
  "page": "https://anyplot.ai/histogram-cumulative/javascript/muix",
  "hub": "https://anyplot.ai/histogram-cumulative",
  "code_json": "https://api.anyplot.ai/specs/histogram-cumulative/muix/code",
  "spec_json": "https://api.anyplot.ai/specs/histogram-cumulative",
  "render_light_png": "https://storage.googleapis.com/anyplot-images/plots/histogram-cumulative/javascript/muix/plot-light.png",
  "render_dark_png": "https://storage.googleapis.com/anyplot-images/plots/histogram-cumulative/javascript/muix/plot-dark.png",
  "interactive_light_html": "https://storage.googleapis.com/anyplot-images/plots/histogram-cumulative/javascript/muix/plot-light.html",
  "interactive_dark_html": "https://storage.googleapis.com/anyplot-images/plots/histogram-cumulative/javascript/muix/plot-dark.html",
  "quality_score": 87.0,
  "license": "MIT",
  "guide": "https://anyplot.ai/llms.txt"
}
Part of Cumulative Histogram on anyplot.ai.