The same plot in 14 other libraries — Python: Altair, Bokeh, lets-plot, Matplotlib, Plotly, plotnine, Pygal, Seaborn; R: ggplot2; JavaScript: Chart.js, D3.js, Apache ECharts, Highcharts, MUI X Charts. Compare all 15 side by side: Cumulative Histogram in Python, R, Julia and JavaScript.
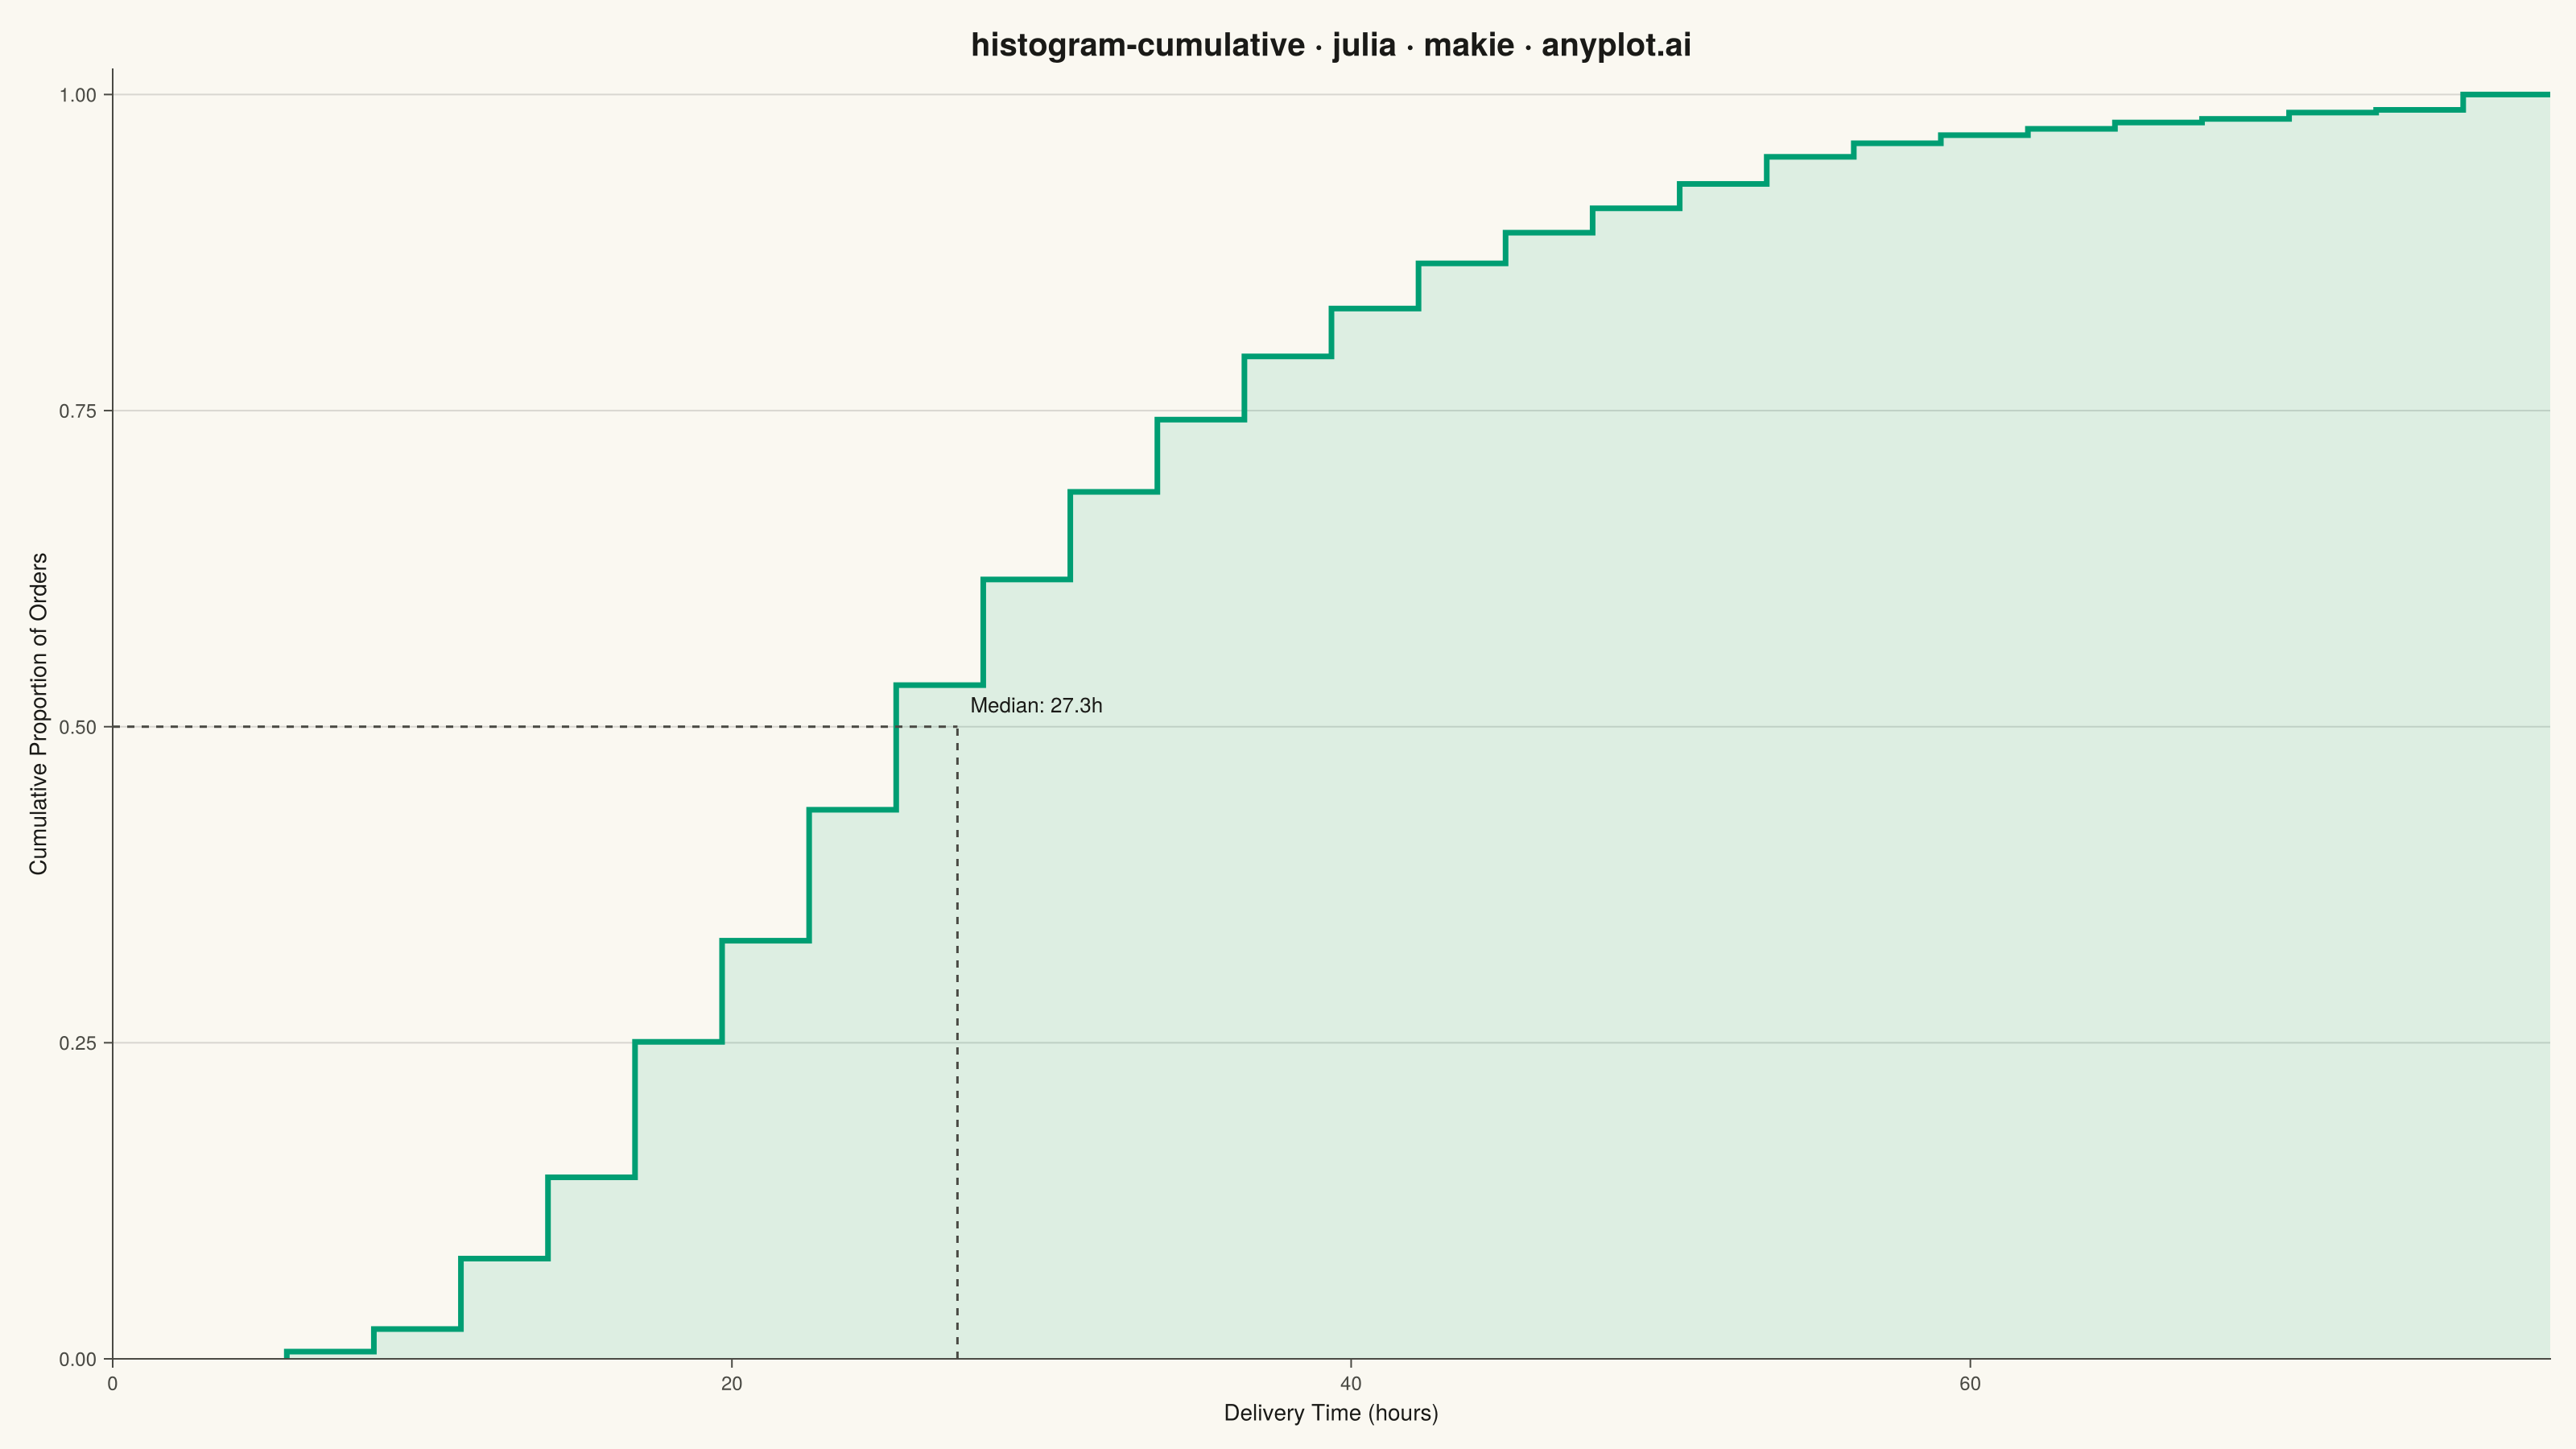
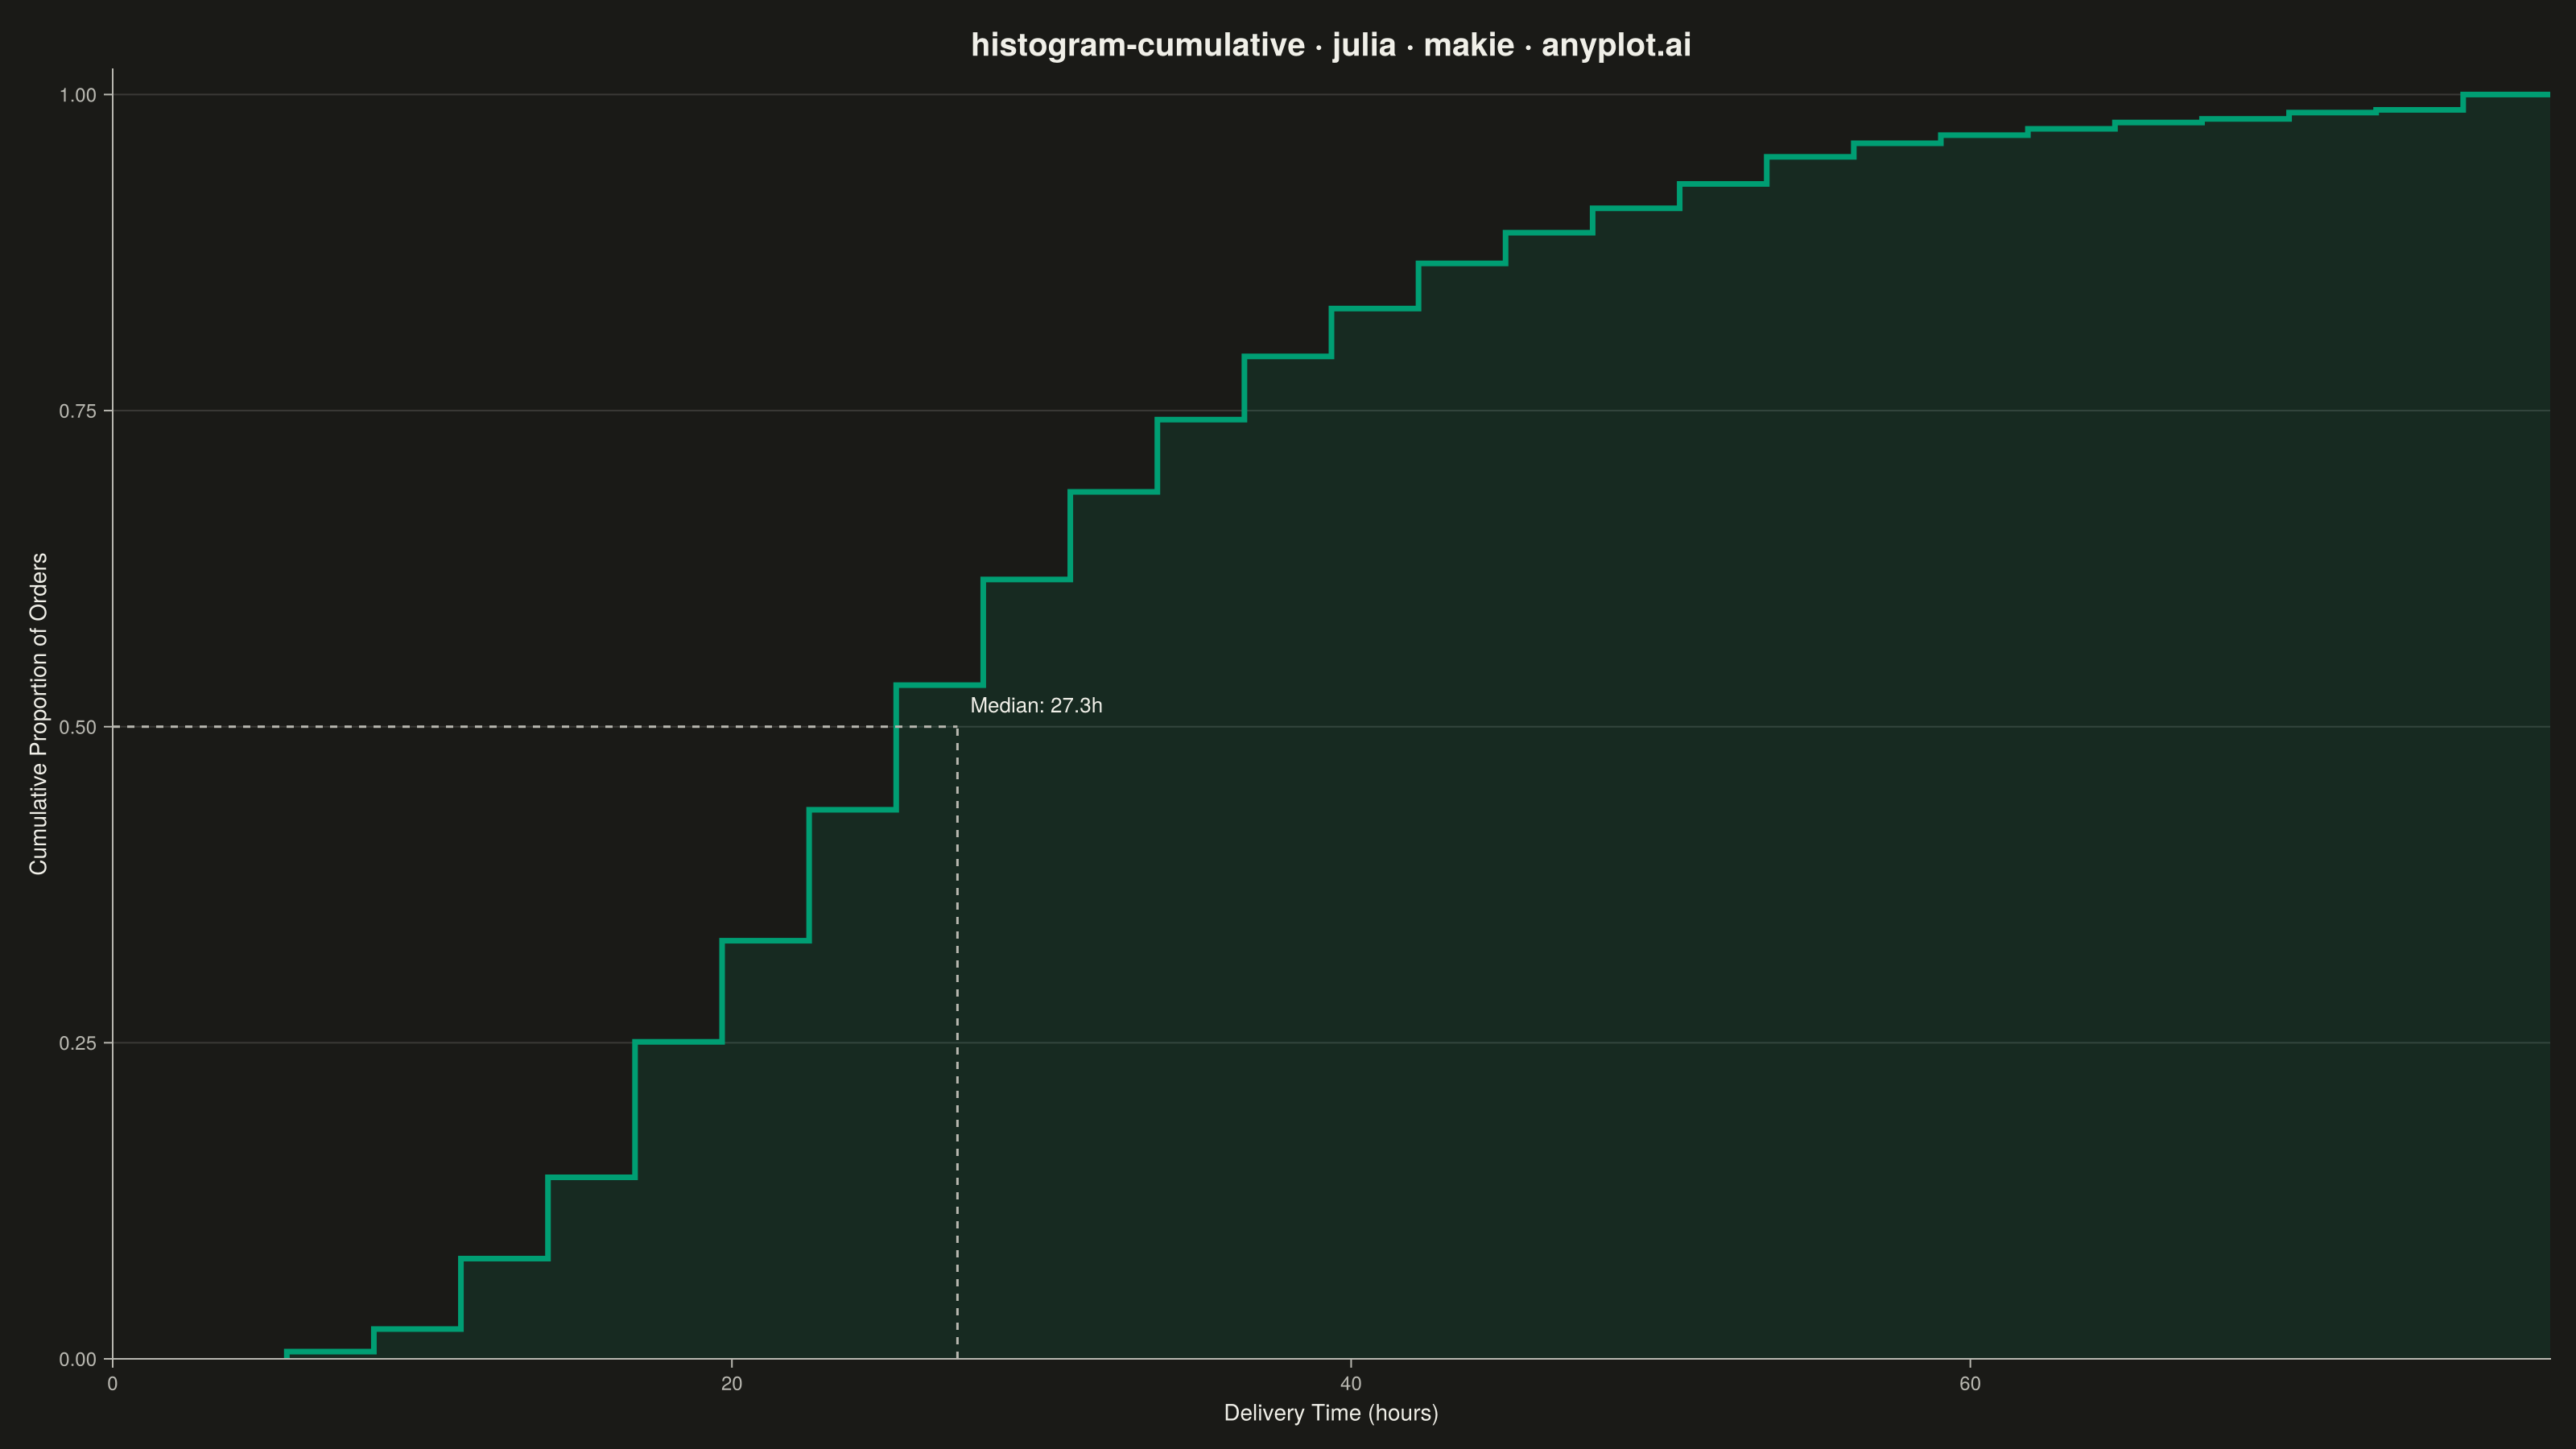
A cumulative histogram (also known as an ogive or cumulative frequency histogram) displays the running total of observations up to each bin boundary. The y-axis shows cumulative count or proportion, creating a monotonically increasing step function that reaches the total sample size (or 1.0 for normalized).
# anyplot.ai
# histogram-cumulative: Cumulative Histogram
# Library: makie 0.21.9 | Julia 1.11.9
# Quality: 91/100 | Created: 2026-09-05

using CairoMakie
using Colors
using Random
using Statistics

Random.seed!(42)

# --- Theme tokens ------------------------------------------------------------
const THEME    = get(ENV, "ANYPLOT_THEME", "light")
const PAGE_BG  = THEME == "light" ? colorant"#FAF8F1" : colorant"#1A1A17"
const INK      = THEME == "light" ? colorant"#1A1A17" : colorant"#F0EFE8"
const INK_SOFT = THEME == "light" ? colorant"#4A4A44" : colorant"#B8B7B0"
const BRAND    = colorant"#009E73"  # Imprint palette position 1 — ALWAYS first series

# --- Data ----------------------------------------------------------------
# Parcel delivery times (hours) for an e-commerce carrier — a right-skewed
# lead-time distribution typical of logistics data.
n_orders = 1400
delivery_hours = exp.(0.45 .* randn(n_orders) .+ log(28.0))

n_bins = 28
edges = range(0.0, quantile(delivery_hours, 0.99), length = n_bins + 1)
counts = zeros(Int, n_bins)
for t in delivery_hours
    # Values past the 99th-percentile edge fall into the last bin, so the
    # tail is still counted while the axis stays focused on the bulk of it.
    idx = clamp(searchsortedlast(edges, t), 1, n_bins)
    counts[idx] += 1
end
cum_proportion = cumsum(counts) ./ n_orders

# Ogive polyline: flat within each bin at its cumulative level, with a
# vertical rise at every bin edge — the standard cumulative-histogram step.
step_x = Float64[edges[1]]
step_y = Float64[0.0]
for i in 1:n_bins
    push!(step_x, edges[i]); push!(step_y, cum_proportion[i])
    push!(step_x, edges[i + 1]); push!(step_y, cum_proportion[i])
end

# --- Plot ----------------------------------------------------------------
fig = Figure(
    size            = (1600, 900),
    fontsize        = 14,
    backgroundcolor = PAGE_BG,
)

ax = Axis(
    fig[1, 1];
    title             = "histogram-cumulative · julia · makie · anyplot.ai",
    titlesize         = 20,
    titlecolor        = INK,
    xlabel            = "Delivery Time (hours)",
    ylabel            = "Cumulative Proportion of Orders",
    xlabelsize        = 14,
    ylabelsize        = 14,
    xlabelcolor       = INK,
    ylabelcolor       = INK,
    xticklabelsize    = 12,
    yticklabelsize    = 12,
    xticklabelcolor   = INK_SOFT,
    yticklabelcolor   = INK_SOFT,
    xtickcolor        = INK_SOFT,
    ytickcolor        = INK_SOFT,
    backgroundcolor   = PAGE_BG,
    topspinevisible   = false,
    rightspinevisible = false,
    leftspinecolor    = INK_SOFT,
    bottomspinecolor  = INK_SOFT,
    xgridvisible      = false,
    ygridcolor        = RGBAf(INK.r, INK.g, INK.b, 0.15),
    yminorgridvisible = false,
    yticks            = 0:0.25:1.0,
)

band!(ax, step_x, zeros(length(step_x)), step_y; color = (BRAND, 0.12))

# The step LINE itself uses Makie's native `stairs!` recipe (step = :pre)
# rather than a hand-drawn polyline — `:pre` jumps to each bin's cumulative
# level right at its left edge, reproducing the same ogive shape as step_x/
# step_y above while showcasing a Makie-distinctive step-plot primitive.
stairs!(ax, edges, vcat(0.0, cum_proportion); step = :pre, color = BRAND, linewidth = 3.5)

xlims!(ax, edges[1], edges[end])
ylims!(ax, 0.0, 1.02)

# --- Median reference guide ------------------------------------------------
# The spec calls out percentile-reading as a primary application; a dashed
# median guide with an inline label lets the viewer read a concrete value
# off the curve instead of eyeballing the shape alone.
median_hours = quantile(delivery_hours, 0.5)
lines!(ax, [median_hours, median_hours], [0.0, 0.5]; color = INK_SOFT, linestyle = :dash, linewidth = 1.5)
lines!(ax, [edges[1], median_hours], [0.5, 0.5]; color = INK_SOFT, linestyle = :dash, linewidth = 1.5)
text!(
    ax, median_hours, 0.5;
    text = "Median: $(round(median_hours, digits = 1))h",
    align = (:left, :bottom),
    offset = (8, 6),
    color = INK,
    fontsize = 13,
)

# --- Save ----------------------------------------------------------------
save("plot-$(THEME).png", fig; px_per_unit = 2)
Runnable source as JSON, for any HTTP client: https://api.anyplot.ai/specs/histogram-cumulative/makie/code. Any spec id and library id listed in llms-full.txt fit the same URL shape; every URL below is complete and callable.
{
  "spec_id": "histogram-cumulative",
  "language": "julia",
  "library": "makie",
  "page": "https://anyplot.ai/histogram-cumulative/julia/makie",
  "hub": "https://anyplot.ai/histogram-cumulative",
  "code_json": "https://api.anyplot.ai/specs/histogram-cumulative/makie/code",
  "spec_json": "https://api.anyplot.ai/specs/histogram-cumulative",
  "render_light_png": "https://storage.googleapis.com/anyplot-images/plots/histogram-cumulative/julia/makie/plot-light.png",
  "render_dark_png": "https://storage.googleapis.com/anyplot-images/plots/histogram-cumulative/julia/makie/plot-dark.png",
  "quality_score": 91.0,
  "license": "MIT",
  "guide": "https://anyplot.ai/llms.txt"
}
Part of Cumulative Histogram on anyplot.ai.