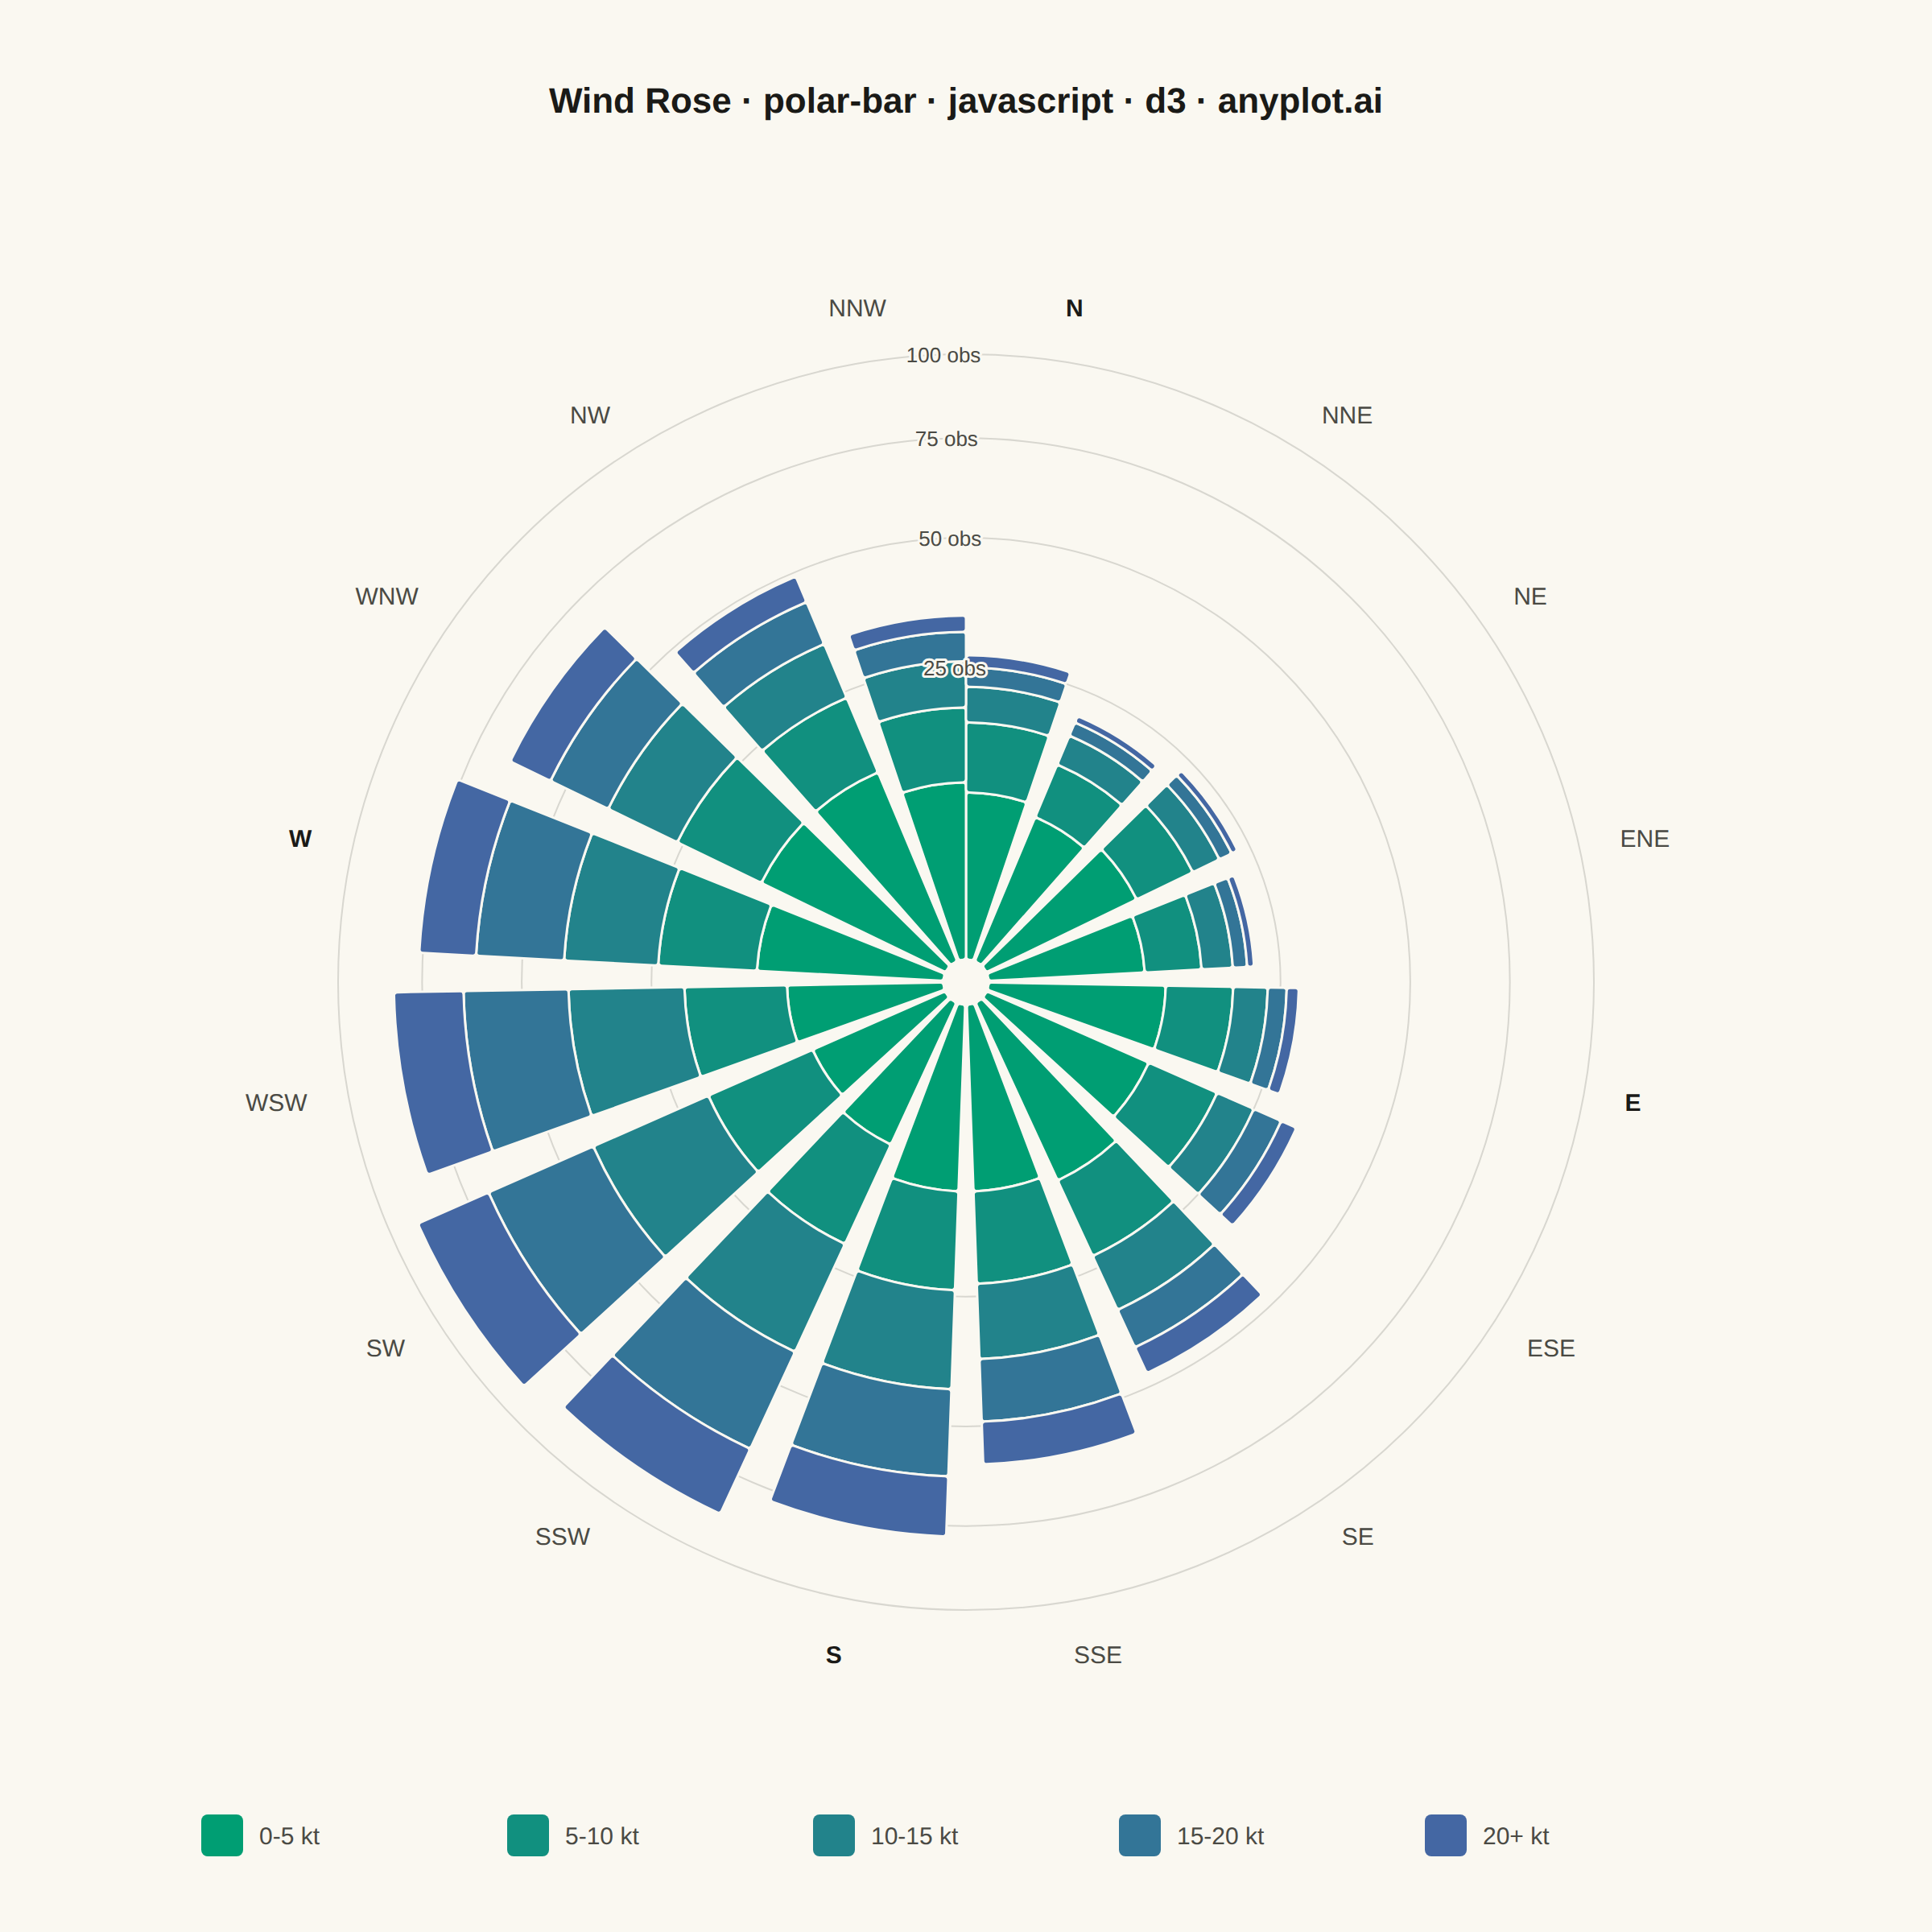
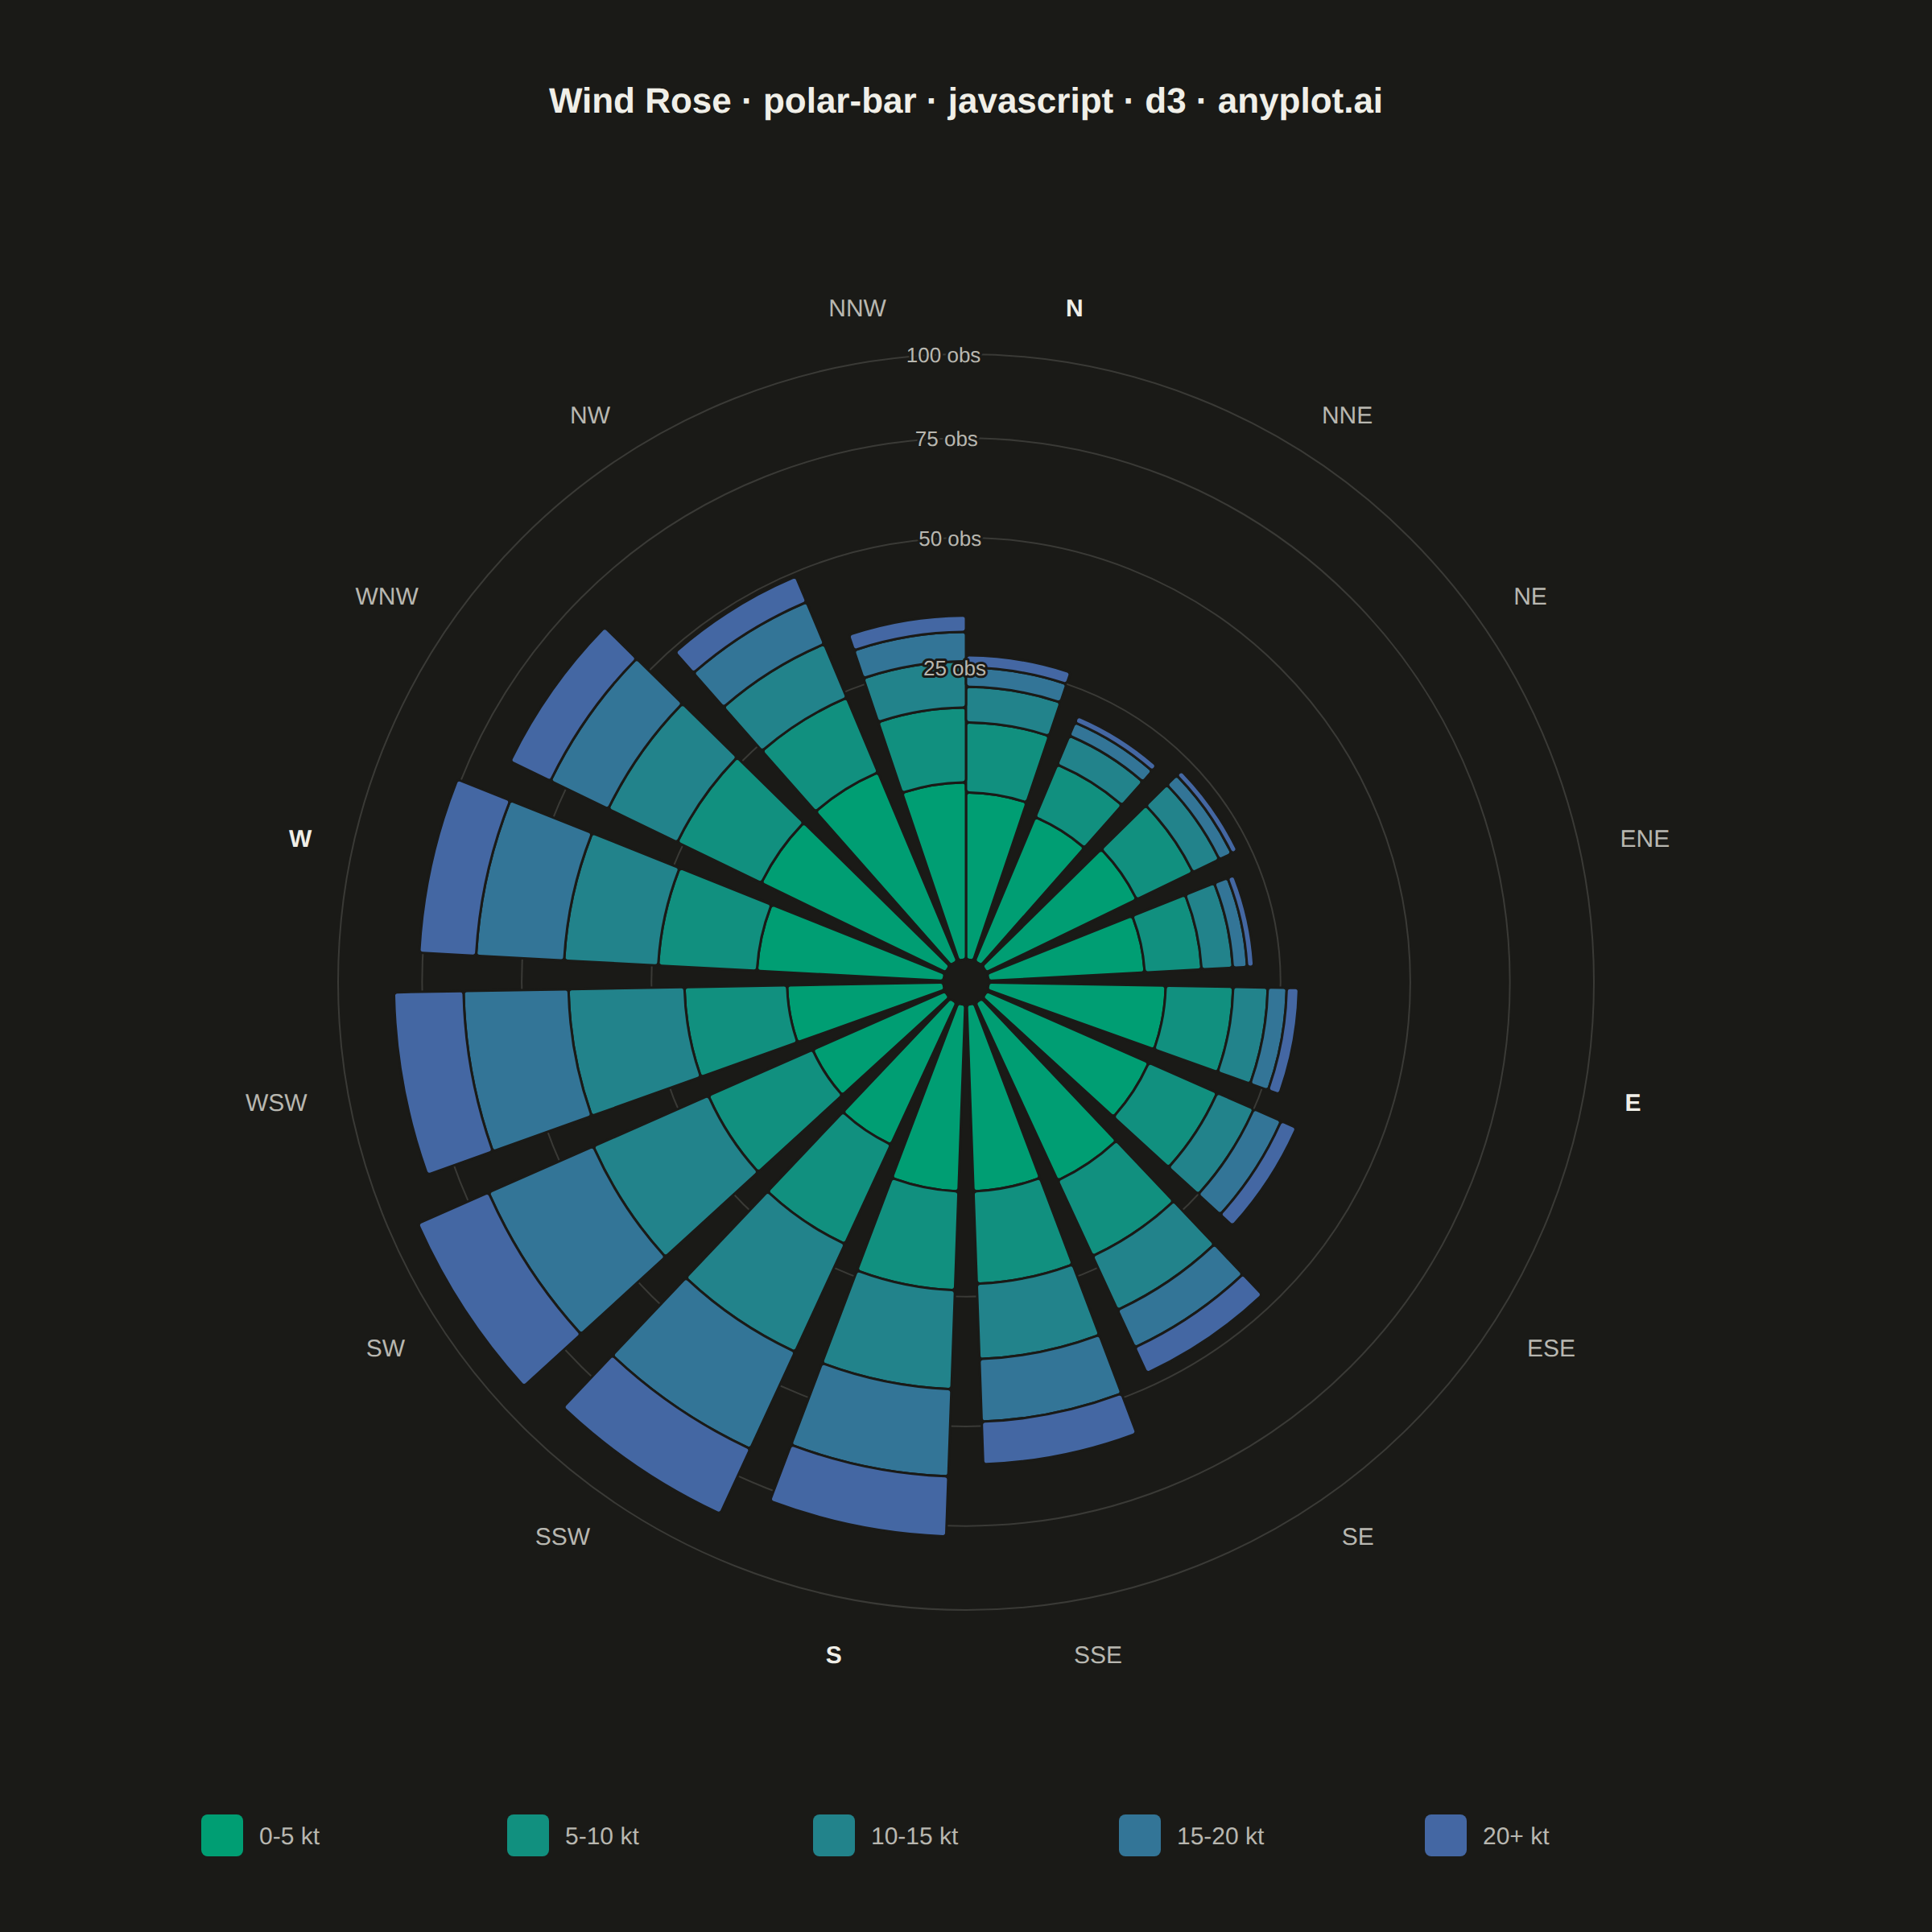
The same plot in 14 other libraries — JavaScript: Chart.js, Apache ECharts, Highcharts, MUI X Charts; Python: Altair, Bokeh, lets-plot, Matplotlib, Plotly, plotnine, Pygal, Seaborn; R: ggplot2; Julia: Makie.jl. Compare all 15 side by side: Polar Bar Chart (Wind Rose) in Python, R, Julia and JavaScript.
A bar chart arranged in a circle with bars radiating outward from the center. Each bar's angle represents a category (often direction) and length represents magnitude. Commonly used as a wind rose for meteorological data.
// anyplot.ai
// polar-bar: Polar Bar Chart (Wind Rose)
// Library: d3 7.9.0 | JavaScript 22.23.2
// Quality: 92/100 | Created: 2026-09-05

//# anyplot-orientation: square

const t = window.ANYPLOT_TOKENS;
const { width, height } = window.ANYPLOT_SIZE;

// --- Data (in-memory, deterministic) ----------------------------------------
// A small LCG stands in for a seeded RNG (the browser has no Math.random seed).
function lcg(seed) {
  let state = seed;
  return () => {
    state = (state * 1664525 + 1013904223) % 4294967296;
    return state / 4294967296;
  };
}
const random = lcg(42);

const DIRECTIONS = [
  "N", "NNE", "NE", "ENE", "E", "ESE", "SE", "SSE",
  "S", "SSW", "SW", "WSW", "W", "WNW", "NW", "NNW",
];
const SPEED_BINS = ["0-5 kt", "5-10 kt", "10-15 kt", "15-20 kt", "20+ kt"];
const PREVAILING_INDEX = DIRECTIONS.indexOf("SW"); // prevailing wind direction
const SPREAD = 3; // concentration of frequency around the prevailing direction

const windData = DIRECTIONS.map((direction, i) => {
  const rawDist = Math.abs(i - PREVAILING_INDEX);
  const circularDist = Math.min(rawDist, DIRECTIONS.length - rawDist);
  const intensity = Math.exp(-(circularDist ** 2) / (2 * SPREAD * SPREAD));
  const observations = Math.round(16 + 68 * intensity + random() * 8);

  // Calm directions skew toward the lowest speed bins; the prevailing
  // direction skews toward the highest — a realistic wind-rose shape.
  const lowWeights = [0.38, 0.3, 0.18, 0.09, 0.05];
  const highWeights = [0.08, 0.14, 0.24, 0.3, 0.24];
  const weights = lowWeights.map((w, k) => w + (highWeights[k] - w) * intensity);
  const weightSum = weights.reduce((a, b) => a + b, 0);

  const row = { direction };
  SPEED_BINS.forEach((bin, k) => {
    row[bin] = Math.round((observations * weights[k]) / weightSum);
  });
  return row;
});

// --- Layout ------------------------------------------------------------------
const margin = { top: 150, bottom: 130 };
const plotHeight = height - margin.top - margin.bottom;
const cx = width / 2;
const cy = margin.top + plotHeight / 2;
const outerRadius = Math.min(width / 2, plotHeight / 2) - 70;
const innerRadius = 14;

const rowTotal = (row) => SPEED_BINS.reduce((sum, bin) => sum + row[bin], 0);
const domainMax = Math.ceil(d3.max(windData, rowTotal) / 20) * 20;

const angle = d3.scaleBand().domain(DIRECTIONS).range([0, 2 * Math.PI]).paddingInner(0.18);
const radius = d3.scaleRadial().domain([0, domainMax]).range([innerRadius, outerRadius]);
const seqColor = d3.interpolateRgbBasis(t.seq);
const binColor = (k) => seqColor(k / (SPEED_BINS.length - 1));

function toPoint(theta, r) {
  return [cx + r * Math.sin(theta), cy - r * Math.cos(theta)];
}

// --- SVG mount ----------------------------------------------------------------
const svg = d3.select("#container").append("svg").attr("width", width).attr("height", height);

// --- Radial grid --------------------------------------------------------------
const tickValues = d3.range(1, 5).map((k) => Math.round((domainMax * k) / 4));
const gapAngle = angle.step() - angle.bandwidth();
const tickAngle = angle("N") - gapAngle / 2;

const gridCircles = svg.append("g");
gridCircles
  .selectAll("circle")
  .data(tickValues)
  .join("circle")
  .attr("cx", cx)
  .attr("cy", cy)
  .attr("r", (d) => radius(d))
  .attr("fill", "none")
  .attr("stroke", t.grid)
  .attr("stroke-width", 1);

// --- Stacked radial bars --------------------------------------------------------
const stacked = d3.stack().keys(SPEED_BINS)(windData);
const arcGen = d3
  .arc()
  .innerRadius((d) => radius(d[0]))
  .outerRadius((d) => radius(d[1]))
  .startAngle((d) => angle(d.data.direction))
  .endAngle((d) => angle(d.data.direction) + angle.bandwidth())
  .cornerRadius(2);

svg
  .append("g")
  .selectAll("g")
  .data(stacked)
  .join("g")
  .attr("fill", (d, i) => binColor(i))
  .selectAll("path")
  .data((d) => d)
  .join("path")
  .attr("transform", `translate(${cx},${cy})`)
  .attr("d", arcGen)
  .attr("stroke", t.pageBg)
  .attr("stroke-width", 1.5);

// Grid tick labels are drawn after the bars (and with a page-background halo)
// so they stay legible even where the angular gap at small radii is narrower
// than the label text.
const gridLabels = svg.append("g");
gridLabels
  .selectAll("text")
  .data(tickValues)
  .join("text")
  .attr("x", (d) => toPoint(tickAngle, radius(d))[0])
  .attr("y", (d) => toPoint(tickAngle, radius(d))[1])
  .attr("text-anchor", "middle")
  .attr("dy", "0.35em")
  .style("font-size", "13px")
  .style("paint-order", "stroke")
  .attr("stroke", t.pageBg)
  .attr("stroke-width", 3)
  .attr("stroke-linejoin", "round")
  .attr("fill", t.inkSoft)
  .text((d) => `${d} obs`);

// --- Compass direction labels -----------------------------------------------
const compass = svg.append("g");
DIRECTIONS.forEach((direction, i) => {
  const theta = angle(direction) + angle.bandwidth() / 2;
  const [x, y] = toPoint(theta, outerRadius + 26);
  const sinT = Math.sin(theta);
  const cosT = Math.cos(theta);

  let textAnchor = "middle";
  if (sinT > 0.35) textAnchor = "start";
  else if (sinT < -0.35) textAnchor = "end";

  let dy = "0.35em";
  if (cosT > 0.85) dy = "-0.2em";
  else if (cosT < -0.85) dy = "1em";

  const isCardinal = i % 4 === 0; // N, E, S, W

  compass
    .append("text")
    .attr("x", x)
    .attr("y", y)
    .attr("text-anchor", textAnchor)
    .attr("dy", dy)
    .style("font-size", "15px")
    .style("font-weight", isCardinal ? "600" : "400")
    .attr("fill", isCardinal ? t.ink : t.inkSoft)
    .text(direction);
});

// --- Legend --------------------------------------------------------------------
const legendY = height - 60;
const itemWidth = 190;
const legendStart = cx - (SPEED_BINS.length * itemWidth) / 2;

const legend = svg.append("g");
SPEED_BINS.forEach((bin, i) => {
  const itemX = legendStart + i * itemWidth;
  legend
    .append("rect")
    .attr("x", itemX)
    .attr("y", legendY - 13)
    .attr("width", 26)
    .attr("height", 26)
    .attr("rx", 4)
    .attr("fill", binColor(i));
  legend
    .append("text")
    .attr("x", itemX + 36)
    .attr("y", legendY)
    .attr("dy", "0.35em")
    .style("font-size", "15px")
    .attr("fill", t.inkSoft)
    .text(bin);
});

// --- Title -----------------------------------------------------------------
svg
  .append("text")
  .attr("x", cx)
  .attr("y", 70)
  .attr("text-anchor", "middle")
  .style("font-size", "22px")
  .style("font-weight", "600")
  .attr("fill", t.ink)
  .text("Wind Rose · polar-bar · javascript · d3 · anyplot.ai");
Runnable source as JSON, for any HTTP client: https://api.anyplot.ai/specs/polar-bar/d3/code. Any spec id and library id listed in llms-full.txt fit the same URL shape; every URL below is complete and callable.
{
  "spec_id": "polar-bar",
  "language": "javascript",
  "library": "d3",
  "page": "https://anyplot.ai/polar-bar/javascript/d3",
  "hub": "https://anyplot.ai/polar-bar",
  "code_json": "https://api.anyplot.ai/specs/polar-bar/d3/code",
  "spec_json": "https://api.anyplot.ai/specs/polar-bar",
  "render_light_png": "https://storage.googleapis.com/anyplot-images/plots/polar-bar/javascript/d3/plot-light.png",
  "render_dark_png": "https://storage.googleapis.com/anyplot-images/plots/polar-bar/javascript/d3/plot-dark.png",
  "interactive_light_html": "https://storage.googleapis.com/anyplot-images/plots/polar-bar/javascript/d3/plot-light.html",
  "interactive_dark_html": "https://storage.googleapis.com/anyplot-images/plots/polar-bar/javascript/d3/plot-dark.html",
  "quality_score": 92.0,
  "license": "MIT",
  "guide": "https://anyplot.ai/llms.txt"
}
Part of Polar Bar Chart (Wind Rose) on anyplot.ai.