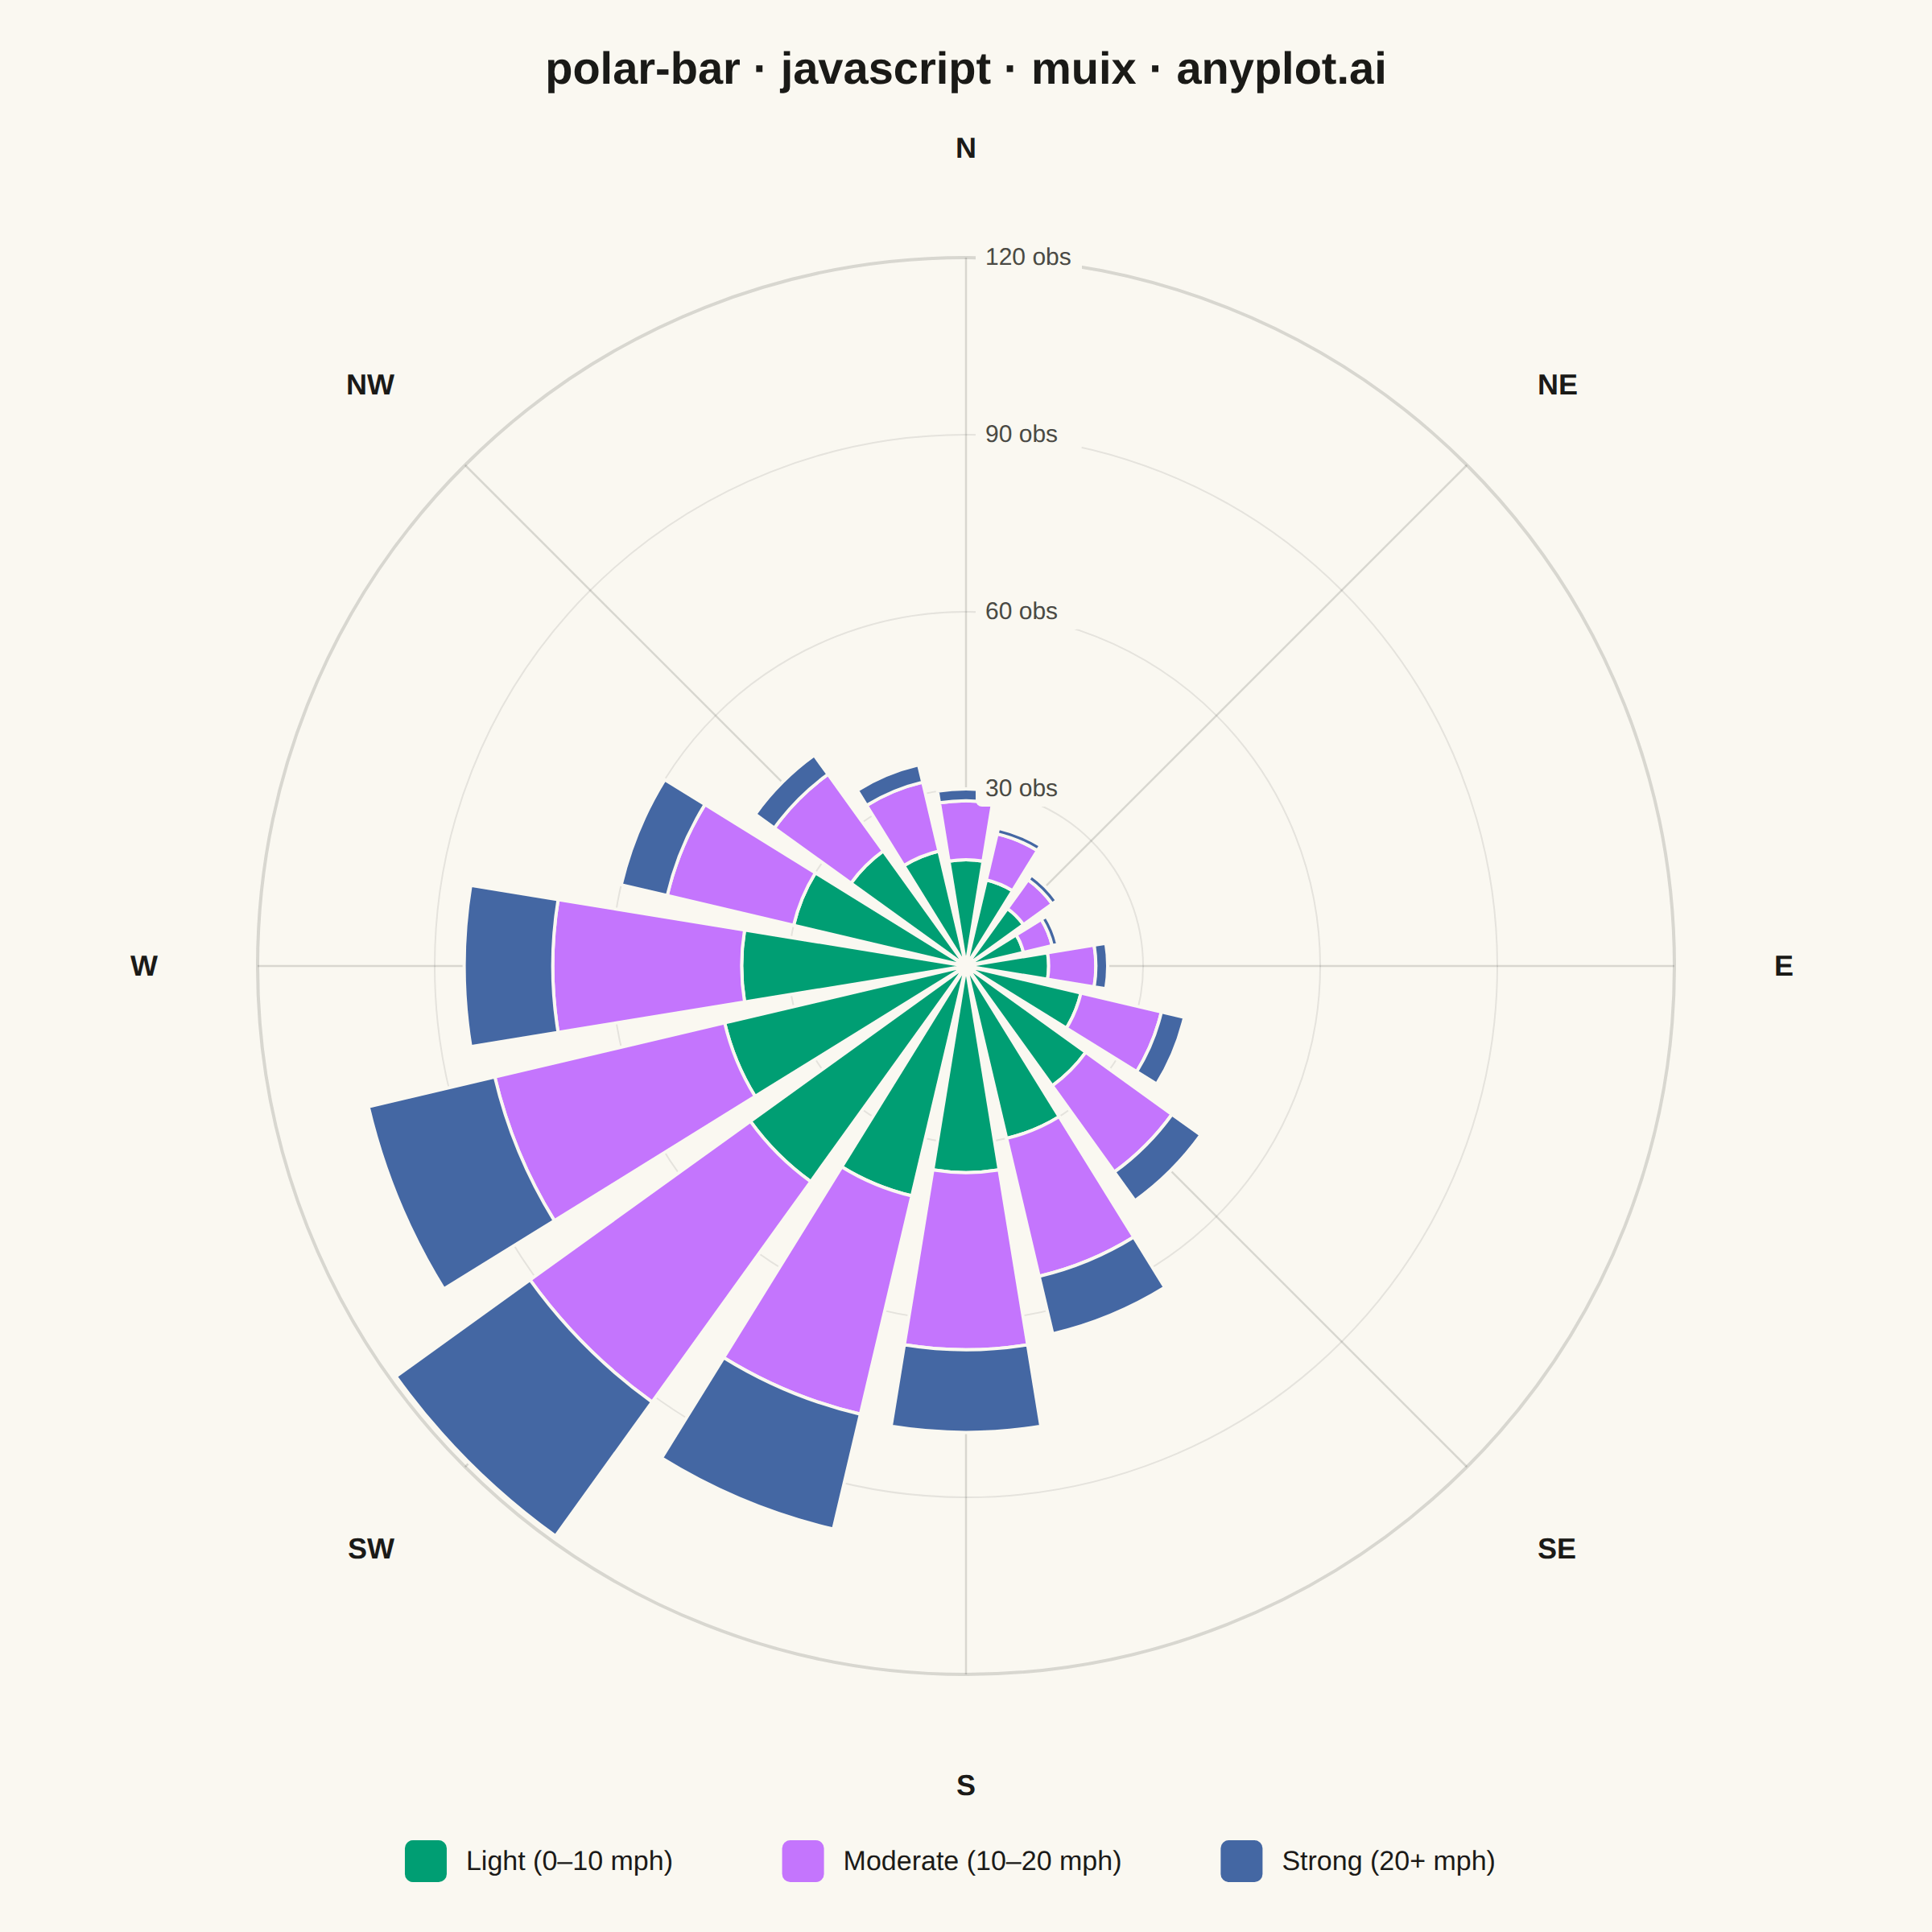
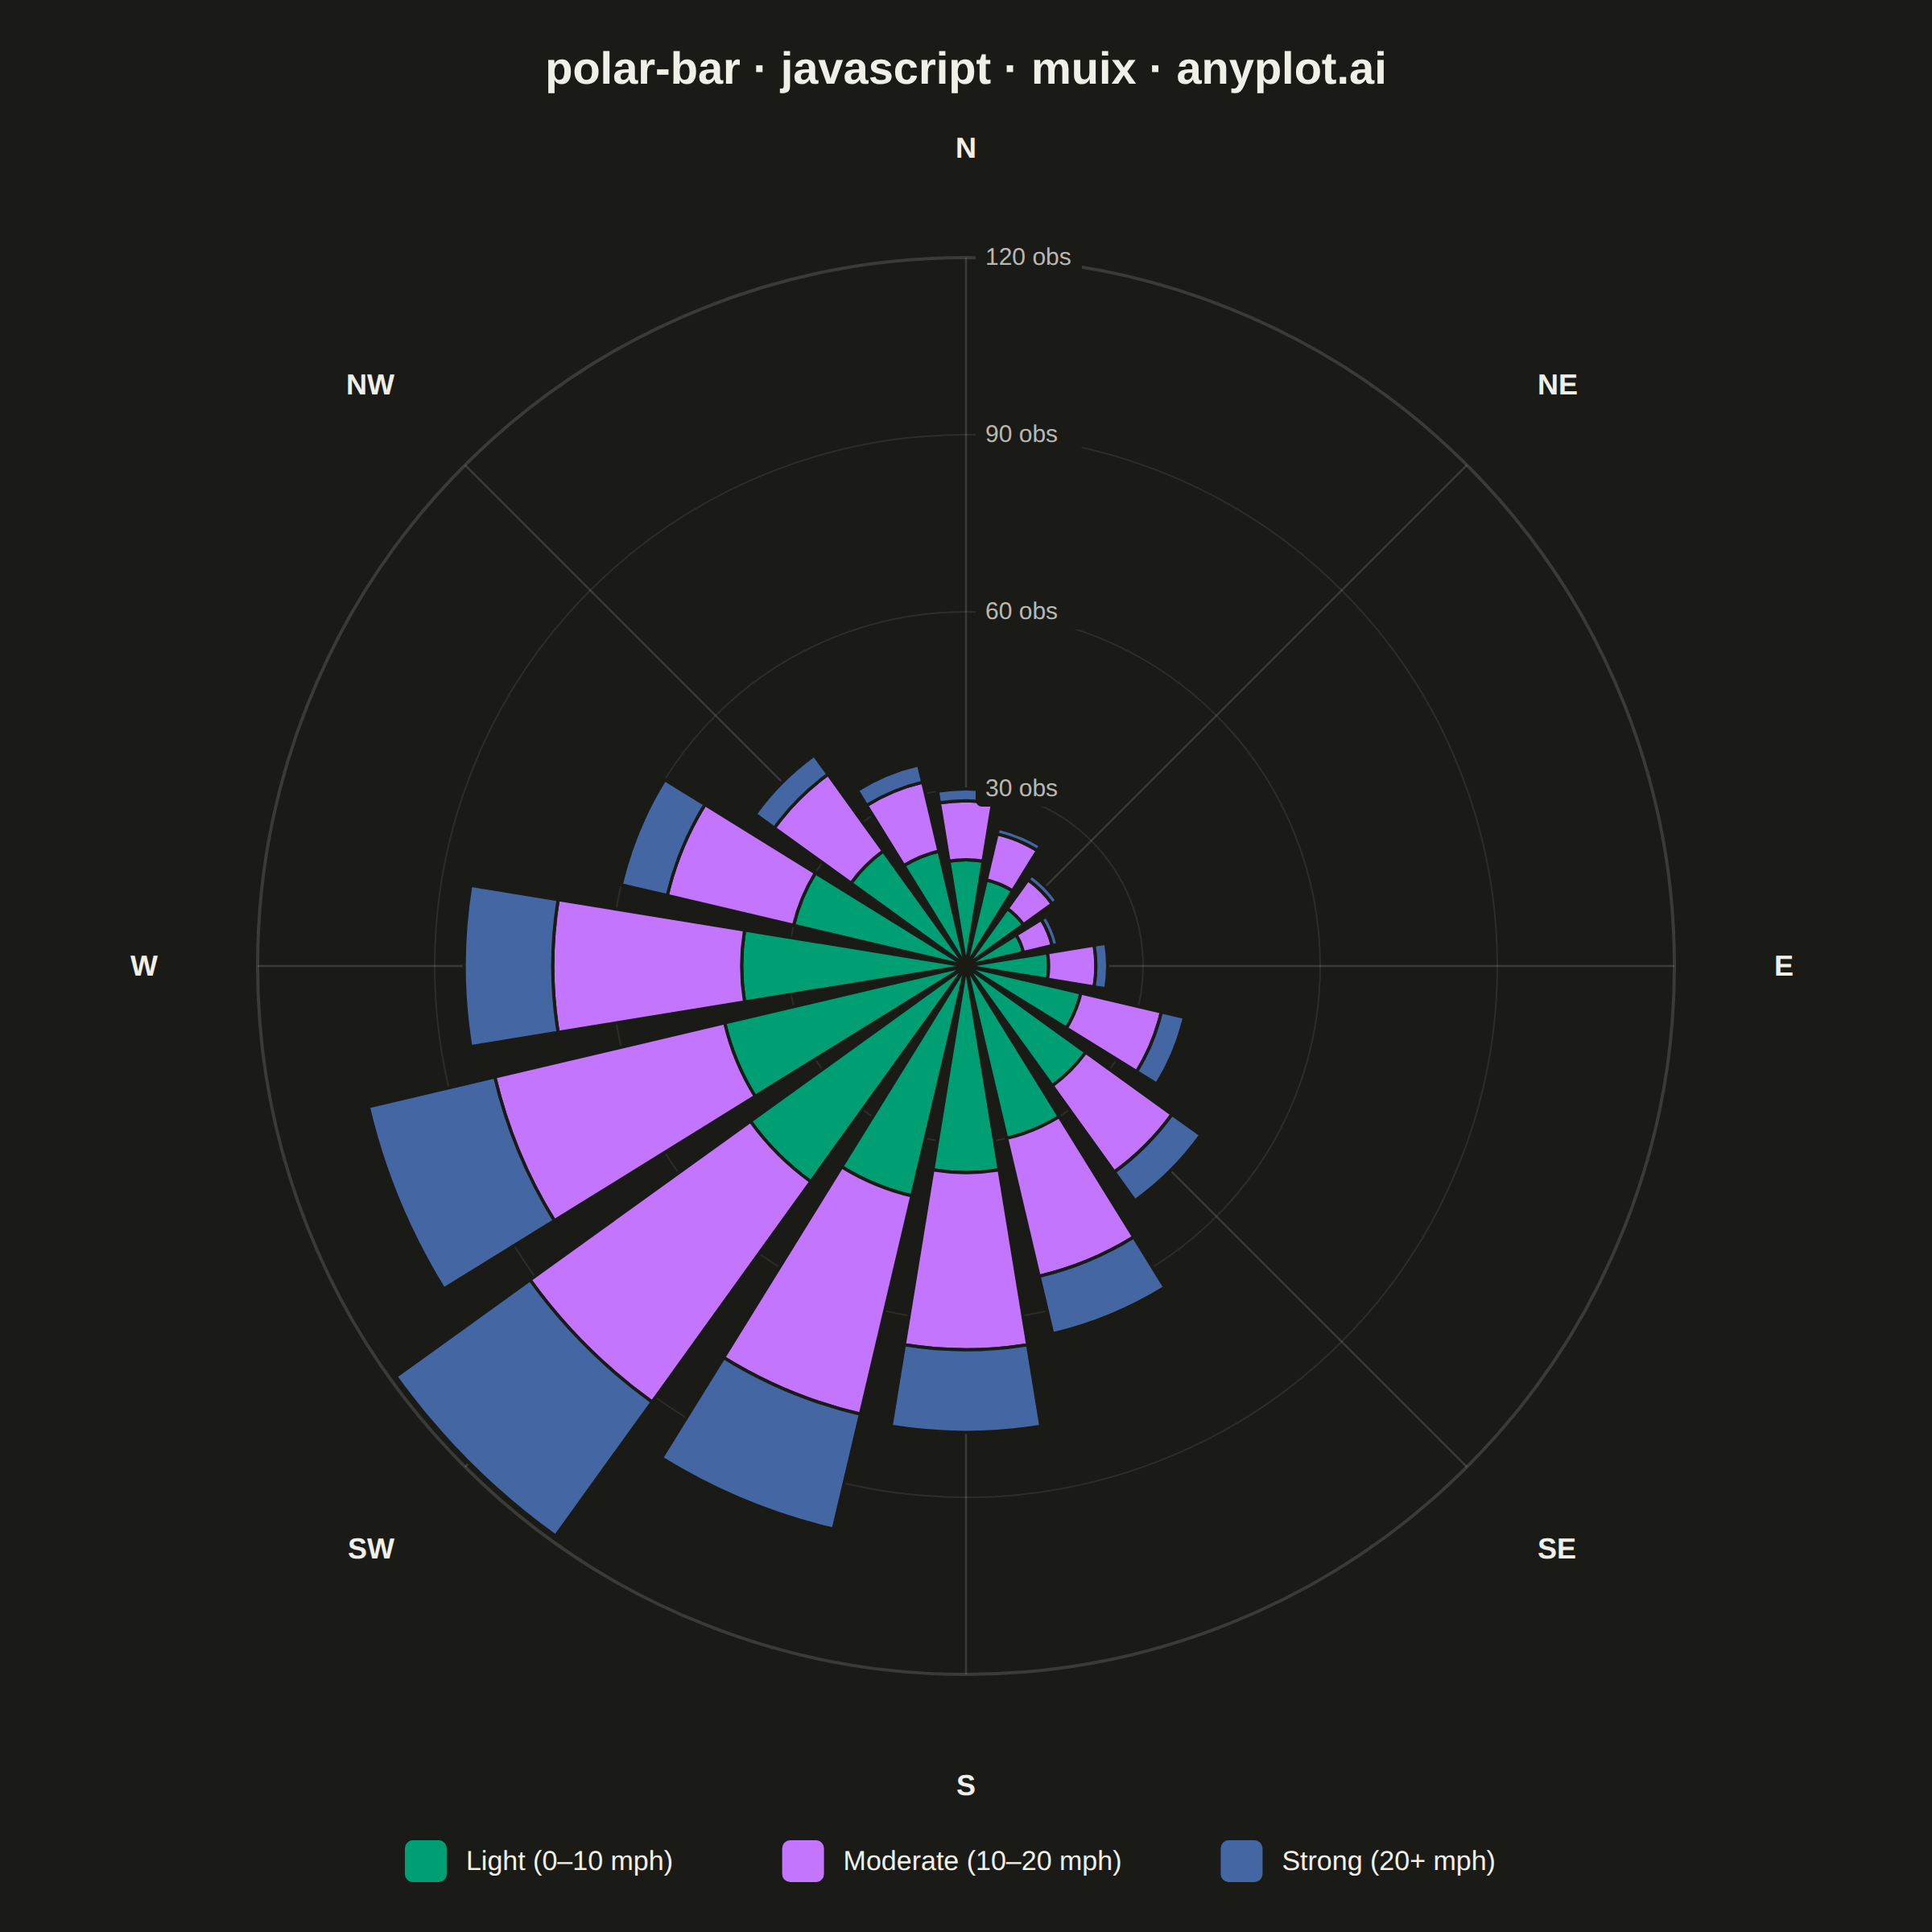
The same plot in 14 other libraries — JavaScript: Chart.js, D3.js, Apache ECharts, Highcharts; Python: Altair, Bokeh, lets-plot, Matplotlib, Plotly, plotnine, Pygal, Seaborn; R: ggplot2; Julia: Makie.jl. Compare all 15 side by side: Polar Bar Chart (Wind Rose) in Python, R, Julia and JavaScript.
A bar chart arranged in a circle with bars radiating outward from the center. Each bar's angle represents a category (often direction) and length represents magnitude. Commonly used as a wind rose for meteorological data.
// anyplot.ai
// polar-bar: Polar Bar Chart (Wind Rose)
// Library: muix 7.29.1 | JavaScript 22.23.2
// Quality: 92/100 | Created: 2026-09-05
//# anyplot-orientation: square
// anyplot.ai
// polar-bar: Polar Bar Chart (Wind Rose)
// Library: MUI X Charts | React | Node 22
// License: @mui/x-charts — MIT (community). Pro/Premium are out of scope.
// Quality: pending | Created: 2026-09-05

import { ChartContainer } from "@mui/x-charts/ChartContainer";
import { useDrawingArea } from "@mui/x-charts/hooks";

// @mui/x-charts 7.x community has no polar-bar / wind-rose component (BarChart
// only offers `layout: 'vertical' | 'horizontal'`, and PieChart encodes value as
// angle, not radius) — so the rose is composed on MUI X's own charting surface:
// ChartContainer sizes the theme-aware <svg>, and useDrawingArea() gives the plot
// rect the wedge/ring/spoke geometry is mapped onto, exactly like the polar-basic
// and radar-basic muix implementations in this catalog.

const t = window.ANYPLOT_TOKENS;
const size = window.ANYPLOT_SIZE;

// Theme-adaptive chrome (ThemeProvider handles MUI text; these are for our SVG).
const INK = t.ink;
const INK_SOFT = t.inkSoft;
const GRID = t.grid;
const PAGE_BG = t.pageBg;

// --- Data (in-memory, deterministic) — monthly wind observations by direction --
const DIRECTIONS = [
  "N", "NNE", "NE", "ENE", "E", "ESE", "SE", "SSE",
  "S", "SSW", "SW", "WSW", "W", "WNW", "NW", "NNW",
];
const SPEED_BINS = [
  { label: "Light (0–10 mph)", color: t.palette[0],
    values: [18, 15, 12, 10, 14, 20, 25, 30, 35, 40, 45, 42, 38, 30, 24, 20] },
  { label: "Moderate (10–20 mph)", color: t.palette[1],
    values: [10, 8, 6, 5, 8, 14, 18, 24, 30, 38, 46, 40, 32, 22, 16, 12] },
  { label: "Strong (20+ mph)", color: t.palette[2],
    values: [2, 1, 1, 1, 2, 4, 6, 10, 14, 20, 28, 22, 15, 8, 4, 3] },
];
const N = DIRECTIONS.length;
const RINGS = [30, 60, 90, 120];
const MAX_VALUE = 120;
// Only the 8 primary compass points get a spoke + label — a full 16-spoke grid
// would compete visually with the wedges themselves.
const MAJOR_INDICES = [0, 2, 4, 6, 8, 10, 12, 14];

// Direction 0 (N) points to the top (-90°); angle grows clockwise around the compass.
const angleOf = (i) => (-90 + (i * 360) / N) * (Math.PI / 180);
const SECTOR_HALF_WIDTH = Math.PI / N;
const WEDGE_GAP = 0.035; // radians of padding on each side of a wedge

function sectorPath(cx, cy, innerR, outerR, startAngle, endAngle) {
  const at = (r, a) => [cx + r * Math.cos(a), cy + r * Math.sin(a)];
  const [ox0, oy0] = at(outerR, startAngle);
  const [ox1, oy1] = at(outerR, endAngle);
  if (innerR < 0.5) {
    return `M ${cx},${cy} L ${ox0},${oy0} A ${outerR} ${outerR} 0 0 1 ${ox1},${oy1} Z`;
  }
  const [ix0, iy0] = at(innerR, startAngle);
  const [ix1, iy1] = at(innerR, endAngle);
  return (
    `M ${ix0},${iy0} L ${ox0},${oy0} ` +
    `A ${outerR} ${outerR} 0 0 1 ${ox1},${oy1} L ${ix1},${iy1} ` +
    `A ${innerR} ${innerR} 0 0 0 ${ix0},${iy0} Z`
  );
}

// --- Wind rose layer: rendered as children inside MUI X's ChartsSurface --------
function WindRose() {
  const area = useDrawingArea();
  const cx = area.left + area.width / 2;
  const cy = area.top + area.height / 2;
  const half = Math.min(area.width, area.height) / 2;
  const R = half - 70; // data radius; margin between R and half holds labels
  const labelR = half - 8;
  const pxPerUnit = R / MAX_VALUE;

  return (
    <g>
      {/* Concentric frequency rings — outer ring solid, inner rings lighter so
          the grid stays subtle near the center */}
      {RINGS.map((level) => (
        <circle
          key={`ring-${level}`}
          cx={cx}
          cy={cy}
          r={(level / MAX_VALUE) * R}
          fill="none"
          stroke={GRID}
          strokeWidth={level === MAX_VALUE ? 2 : 1}
          strokeOpacity={level === MAX_VALUE ? 1 : 0.6}
        />
      ))}

      {/* Spokes + labels at the 8 primary compass points */}
      {MAJOR_INDICES.map((i) => {
        const a = angleOf(i);
        const ox = cx + R * Math.cos(a);
        const oy = cy + R * Math.sin(a);
        const lx = cx + labelR * Math.cos(a);
        const ly = cy + labelR * Math.sin(a);
        const cos = Math.cos(a);
        const anchor = cos > 0.3 ? "start" : cos < -0.3 ? "end" : "middle";
        const sin = Math.sin(a);
        const baseline = sin > 0.5 ? "hanging" : sin < -0.5 ? "auto" : "central";
        return (
          <g key={`spoke-${DIRECTIONS[i]}`}>
            <line x1={cx} y1={cy} x2={ox} y2={oy} stroke={GRID} strokeWidth={1.25} />
            <text
              x={lx}
              y={ly}
              fill={INK}
              fontSize={18}
              fontWeight={600}
              textAnchor={anchor}
              dominantBaseline={baseline}
            >
              {DIRECTIONS[i]}
            </text>
          </g>
        );
      })}

      {/* Stacked wedges: each direction's speed bins radiate outward from the
          center, radius encoding cumulative observation count */}
      {DIRECTIONS.map((label, i) => {
        const a0 = angleOf(i) - SECTOR_HALF_WIDTH + WEDGE_GAP;
        const a1 = angleOf(i) + SECTOR_HALF_WIDTH - WEDGE_GAP;
        let cum = 0;
        return SPEED_BINS.map((bin) => {
          const r0 = cum * pxPerUnit;
          cum += bin.values[i];
          const r1 = cum * pxPerUnit;
          return (
            <path
              key={`wedge-${label}-${bin.label}`}
              d={sectorPath(cx, cy, r0, r1, a0, a1)}
              fill={bin.color}
              stroke={PAGE_BG}
              strokeWidth={2}
            />
          );
        });
      })}

      {/* Frequency tick labels along the top spoke, with a backing chip so they
          stay legible over whatever wedge color sits underneath */}
      {RINGS.map((level) => {
        const ty = cy - (level / MAX_VALUE) * R;
        return (
          <g key={`tick-${level}`}>
            <rect x={cx + 6} y={ty - 11} width={66} height={22} rx={4} fill={PAGE_BG} />
            <text
              x={cx + 12}
              y={ty}
              fill={INK_SOFT}
              fontSize={15}
              textAnchor="start"
              dominantBaseline="central"
            >
              {`${level} obs`}
            </text>
          </g>
        );
      })}
    </g>
  );
}

// --- Title + legend drawn on the surface, then the wind-rose layer ------------
function Chrome() {
  const swatch = 26;
  const swatchGap = 12;
  const itemGap = 44;
  const fontSize = 17;
  const charWidth = fontSize * 0.56;
  const itemWidths = SPEED_BINS.map((bin) => swatch + swatchGap + bin.label.length * charWidth);
  const totalWidth = itemWidths.reduce((sum, w) => sum + w, 0) + itemGap * (SPEED_BINS.length - 1);
  const legendY = size.height - 44;
  let x = size.width / 2 - totalWidth / 2;

  return (
    <g>
      <text
        x={size.width / 2}
        y={52}
        fill={INK}
        fontSize={28}
        fontWeight={700}
        textAnchor="middle"
      >
        polar-bar · javascript · muix · anyplot.ai
      </text>
      {SPEED_BINS.map((bin, i) => {
        const itemX = x;
        x += itemWidths[i] + itemGap;
        return (
          <g key={`legend-${bin.label}`}>
            <rect x={itemX} y={legendY - 13} width={swatch} height={swatch} rx={5} fill={bin.color} />
            <text
              x={itemX + swatch + swatchGap}
              y={legendY}
              fill={INK}
              fontSize={fontSize}
              textAnchor="start"
              dominantBaseline="central"
            >
              {bin.label}
            </text>
          </g>
        );
      })}
    </g>
  );
}

// --- Chart (default-exported component — the harness mounts it) ---------------
export default function Chart() {
  return (
    <ChartContainer
      width={size.width}
      height={size.height}
      series={[]}
      margin={{ top: 90, bottom: 90, left: 90, right: 90 }}
      skipAnimation
    >
      <Chrome />
      <WindRose />
    </ChartContainer>
  );
}
Runnable source as JSON, for any HTTP client: https://api.anyplot.ai/specs/polar-bar/muix/code. Any spec id and library id listed in llms-full.txt fit the same URL shape; every URL below is complete and callable.
{
  "spec_id": "polar-bar",
  "language": "javascript",
  "library": "muix",
  "page": "https://anyplot.ai/polar-bar/javascript/muix",
  "hub": "https://anyplot.ai/polar-bar",
  "code_json": "https://api.anyplot.ai/specs/polar-bar/muix/code",
  "spec_json": "https://api.anyplot.ai/specs/polar-bar",
  "render_light_png": "https://storage.googleapis.com/anyplot-images/plots/polar-bar/javascript/muix/plot-light.png",
  "render_dark_png": "https://storage.googleapis.com/anyplot-images/plots/polar-bar/javascript/muix/plot-dark.png",
  "interactive_light_html": "https://storage.googleapis.com/anyplot-images/plots/polar-bar/javascript/muix/plot-light.html",
  "interactive_dark_html": "https://storage.googleapis.com/anyplot-images/plots/polar-bar/javascript/muix/plot-dark.html",
  "quality_score": 92.0,
  "license": "MIT",
  "guide": "https://anyplot.ai/llms.txt"
}
Part of Polar Bar Chart (Wind Rose) on anyplot.ai.