The same plot in 14 other libraries — JavaScript: Chart.js, D3.js, Apache ECharts, MUI X Charts; Python: Altair, Bokeh, lets-plot, Matplotlib, Plotly, plotnine, Pygal, Seaborn; R: ggplot2; Julia: Makie.jl. Compare all 15 side by side: Polar Bar Chart (Wind Rose) in Python, R, Julia and JavaScript.
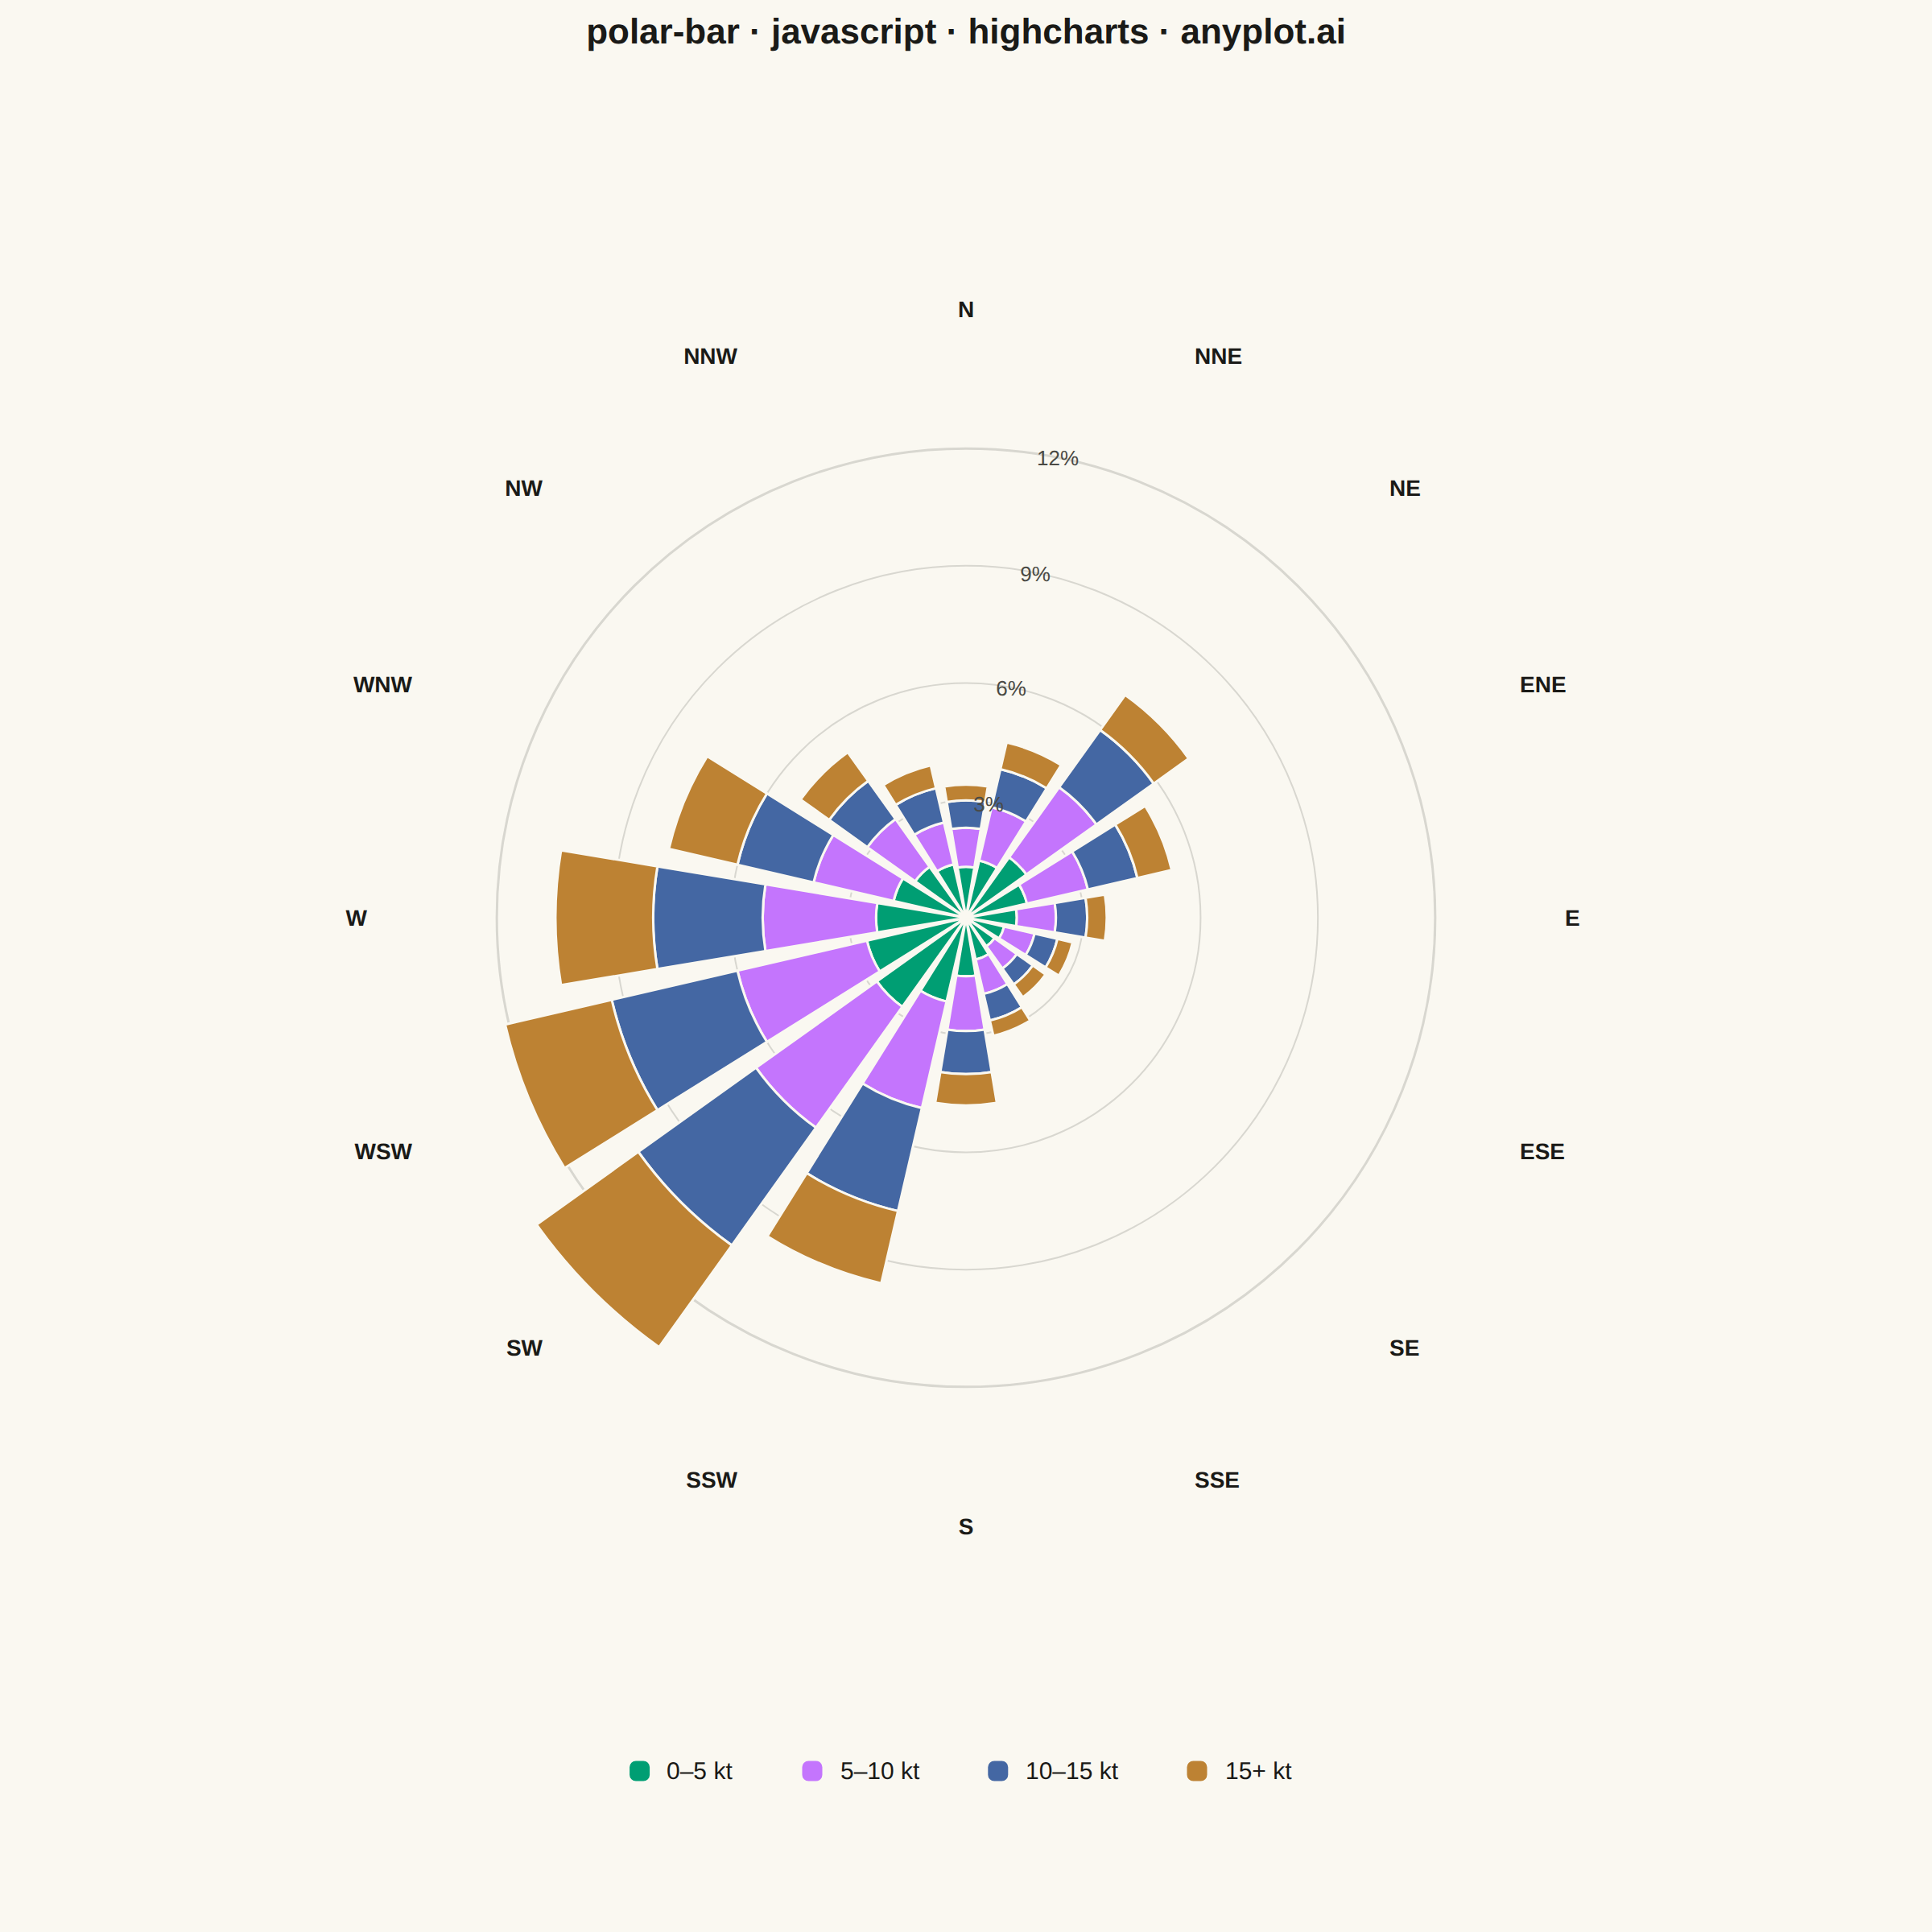
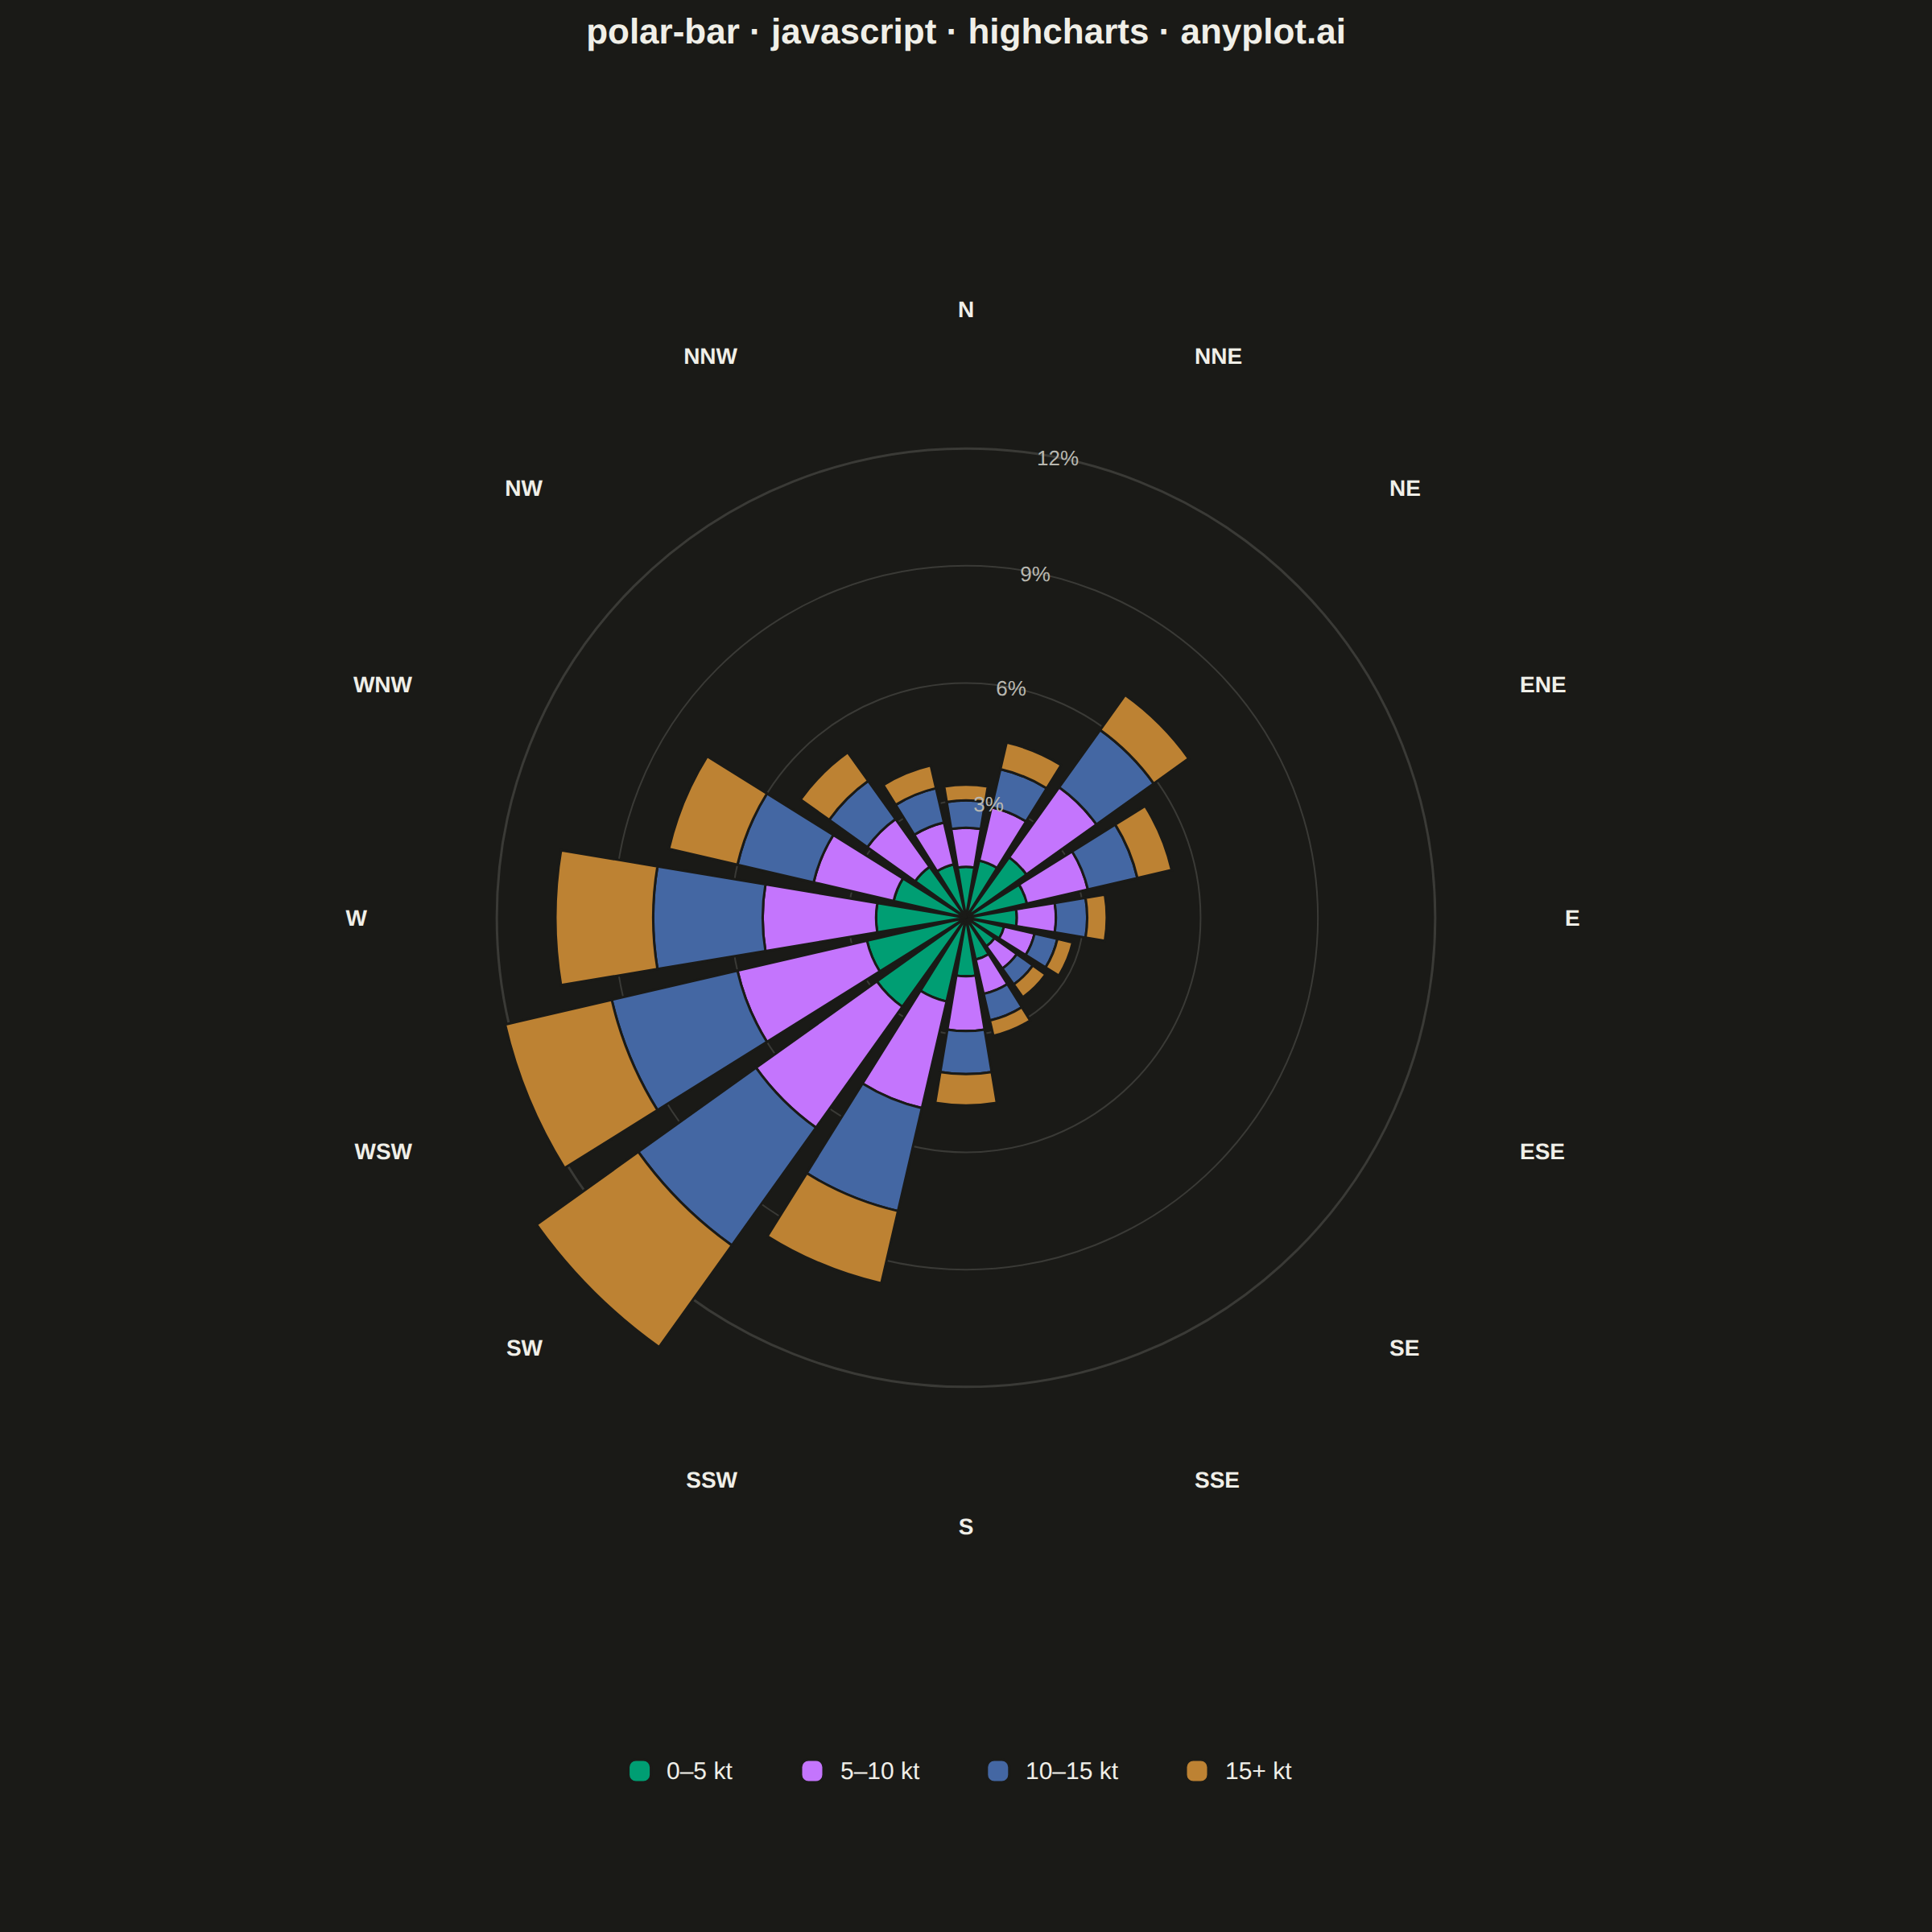
A bar chart arranged in a circle with bars radiating outward from the center. Each bar's angle represents a category (often direction) and length represents magnitude. Commonly used as a wind rose for meteorological data.
// anyplot.ai
// polar-bar: Polar Bar Chart (Wind Rose)
// Library: highcharts 12.6.0 | JavaScript 22.23.2
// Quality: 88/100 | Created: 2026-09-05
//# anyplot-orientation: square

// Only the core `highcharts` bundle is loaded (no highcharts-more), and the
// PolarComposition that drives `chart.polar` (and thus native polar-column
// wind roses) lives in highcharts-more.js. As with anyplot's other
// polar-coordinate Highcharts specs, each stacked wedge is drawn directly as
// an annular sector with the core SVG renderer — the same `symbols.arc` path
// primitive Highcharts itself uses internally to draw pie/donut slices — so
// the chart is real geometry, not a simulation.
const t = window.ANYPLOT_TOKENS;

// --- Data (wind rose: % of hourly observations by direction × speed bin) --
const DIRECTIONS = [
  "N", "NNE", "NE", "ENE", "E", "ESE", "SE", "SSE",
  "S", "SSW", "SW", "WSW", "W", "WNW", "NW", "NNW",
];
const SPEED_BINS = ["0–5 kt", "5–10 kt", "10–15 kt", "15+ kt"];

// Rows follow DIRECTIONS order; columns follow SPEED_BINS order. A bimodal
// regime: the dominant onshore southwesterly (rows 9–12) carries both the
// highest frequency and the highest share of strong gusts, and a lighter
// secondary northeasterly land breeze (rows 1–3) reverses it part of the day.
const FREQUENCY = [
  [1.3, 1.0, 0.7, 0.4], // N
  [1.5, 1.4, 1.0, 0.7], // NNE
  [1.9, 2.2, 1.8, 1.1], // NE
  [1.6, 1.6, 1.3, 0.9], // ENE
  [1.3, 1.0, 0.8, 0.5], // E
  [1.0, 0.8, 0.6, 0.4], // ESE
  [0.9, 0.7, 0.5, 0.4], // SE
  [1.1, 0.9, 0.7, 0.4], // SSE
  [1.5, 1.4, 1.1, 0.8], // S
  [2.2, 2.8, 2.7, 1.9], // SSW
  [2.8, 3.8, 3.7, 3.2], // SW
  [2.6, 3.4, 3.3, 2.8], // WSW
  [2.3, 2.9, 2.8, 2.5], // W
  [1.9, 2.1, 2.0, 1.8], // WNW
  [1.6, 1.5, 1.2, 0.9], // NW
  [1.4, 1.1, 0.9, 0.6], // NNW
];

const SCALE_MAX = 14;
const RINGS = [3, 6, 9, 12];
const dirCount = DIRECTIONS.length;

const TITLE = "polar-bar · javascript · highcharts · anyplot.ai";
const titleFontSize = Math.max(15, Math.round(22 * Math.min(1, 67 / TITLE.length))) + "px";

// --- Chart shell (core-only; the wind rose overlay is drawn below) --------
const chart = Highcharts.chart("container", {
  chart: {
    backgroundColor: "transparent",
    animation: false,
    style: { fontFamily: "inherit" },
    margin: [130, 110, 190, 110],
  },
  credits: { enabled: false },
  title: {
    text: TITLE,
    style: { color: t.ink, fontSize: titleFontSize, fontWeight: "600" },
  },
  xAxis: { visible: false, gridLineWidth: 0, lineWidth: 0, tickLength: 0 },
  yAxis: { visible: false, gridLineWidth: 0, lineWidth: 0, tickLength: 0 },
  legend: { enabled: false },
  tooltip: {
    enabled: true,
    backgroundColor: t.elevatedBg,
    borderColor: t.grid,
    style: { color: t.ink },
    formatter() {
      const p = this.point.custom;
      return `<b>${p.direction}</b><br/>${p.bin}: ${p.value.toFixed(1)}%`;
    },
  },
  plotOptions: { series: { animation: false } },
  series: [],
});

// Pin the hidden axes to a known pixel extent so real scatter points can be
// data-bound at each wedge's centroid — the PNG stays untouched, but the
// interactive HTML gets genuine tooltips over the rendered geometry.
chart.xAxis[0].setExtremes(0, chart.plotWidth, false);
chart.yAxis[0].setExtremes(0, chart.plotHeight, false);

// --- Polar → Cartesian projection ------------------------------------------
const centerX = chart.plotLeft + chart.plotWidth / 2;
const centerY = chart.plotTop + chart.plotHeight / 2;
const radiusMax = Math.min(chart.plotWidth, chart.plotHeight) / 2 - 100;
const sectorAngle = (2 * Math.PI) / dirCount;
const halfBarWidth = sectorAngle * 0.42;

// Bearing 0 (N) points straight up; bearings proceed clockwise.
function angleFor(dirIndex) {
  return -Math.PI / 2 + dirIndex * sectorAngle;
}
function radiusFor(value) {
  return (radiusMax * value) / SCALE_MAX;
}
function project(angle, radius) {
  return [centerX + radius * Math.cos(angle), centerY + radius * Math.sin(angle)];
}

// --- Concentric grid rings + scale labels -----------------------------------
RINGS.forEach((level, i) => {
  chart.renderer
    .circle(centerX, centerY, radiusFor(level))
    .attr({
      fill: "none",
      stroke: t.grid,
      "stroke-width": i === RINGS.length - 1 ? 1.5 : 1,
      zIndex: 1,
    })
    .add();
});

// Ring labels sit in the gap between N and NNE, clear of every wedge.
const ringLabelAngle = angleFor(0) + sectorAngle / 2;
RINGS.forEach((level) => {
  const [lx, ly] = project(ringLabelAngle, radiusFor(level));
  chart.renderer
    .text(`${level}%`, lx, ly + 5)
    .attr({ align: "center", zIndex: 4 })
    .css({ fontSize: "13px", fontWeight: "500", color: t.inkSoft, fontFamily: "inherit" })
    .add();
});

// --- Direction labels around the perimeter ----------------------------------
DIRECTIONS.forEach((label, i) => {
  const angle = angleFor(i);
  const [lx, ly] = project(angle, radiusMax + 32);
  const cos = Math.cos(angle);
  const sin = Math.sin(angle);
  const align = cos > 0.3 ? "left" : cos < -0.3 ? "right" : "center";
  chart.renderer
    .text(label, lx, ly + sin * 6 + 5)
    .attr({ align, zIndex: 4 })
    .css({ fontSize: "14px", fontWeight: "600", color: t.ink, fontFamily: "inherit" })
    .add();
});

// --- Stacked wedges + real (hidden-marker) scatter points for tooltips -----
const tooltipData = [];

DIRECTIONS.forEach((direction, i) => {
  const startAngle = angleFor(i) - halfBarWidth;
  const endAngle = angleFor(i) + halfBarWidth;
  let cumulative = 0;

  SPEED_BINS.forEach((bin, j) => {
    const value = FREQUENCY[i][j];
    const innerR = radiusFor(cumulative);
    const outerR = radiusFor(cumulative + value);
    cumulative += value;

    const wedgePath = chart.renderer.symbols.arc(centerX, centerY, outerR, outerR, {
      start: startAngle,
      end: endAngle,
      innerR,
      r: outerR,
      open: false,
    });
    chart.renderer
      .path(wedgePath)
      .attr({ fill: t.palette[j], stroke: t.pageBg, "stroke-width": 1.5, zIndex: 3 })
      .add();

    const midAngle = angleFor(i);
    const midRadius = (innerR + outerR) / 2;
    const chordWidth = 2 * midRadius * Math.sin(halfBarWidth);
    const markerRadius = Math.max(8, Math.min(outerR - innerR, chordWidth) / 2);
    const [px, py] = project(midAngle, midRadius);

    tooltipData.push({
      x: px - chart.plotLeft,
      y: chart.plotTop + chart.plotHeight - py,
      markerRadius,
      custom: { direction, bin, value },
    });
  });
});

chart.addSeries(
  {
    type: "scatter",
    name: "Frequency",
    color: t.palette[0],
    enableMouseTracking: true,
    stickyTracking: false,
    animation: false,
    marker: {
      enabled: false,
      states: { hover: { enabled: true, lineWidth: 2, lineColor: t.pageBg, fillColor: t.ink } },
    },
    data: tooltipData.map((d) => ({
      x: d.x,
      y: d.y,
      marker: { radius: d.markerRadius, states: { hover: { radius: d.markerRadius } } },
      custom: d.custom,
    })),
  },
  false
);
chart.redraw();

// --- Legend (speed bins) -----------------------------------------------------
const swatchSize = 14;
const itemGap = 34;
const legendFontSize = 15;
const labelWidths = SPEED_BINS.map((label) => label.length * 8.2);
const legendTotalWidth = SPEED_BINS.reduce(
  (sum, _label, i) => sum + swatchSize + 10 + labelWidths[i] + (i < SPEED_BINS.length - 1 ? itemGap : 0),
  0
);
let cursorX = centerX - legendTotalWidth / 2;
const legendY = chart.plotTop + chart.plotHeight + 90;

SPEED_BINS.forEach((label, i) => {
  chart.renderer
    .rect(cursorX, legendY - swatchSize / 2, swatchSize, swatchSize, swatchSize / 3)
    .attr({ fill: t.palette[i], stroke: t.pageBg, "stroke-width": 1.5, zIndex: 5 })
    .add();
  chart.renderer
    .text(label, cursorX + swatchSize + 10, legendY + swatchSize / 2 - 2)
    .attr({ align: "left", zIndex: 5 })
    .css({ fontSize: `${legendFontSize}px`, fontWeight: "500", color: t.ink, fontFamily: "inherit" })
    .add();
  cursorX += swatchSize + 10 + labelWidths[i] + itemGap;
});
Runnable source as JSON, for any HTTP client: https://api.anyplot.ai/specs/polar-bar/highcharts/code. Any spec id and library id listed in llms-full.txt fit the same URL shape; every URL below is complete and callable.
{
  "spec_id": "polar-bar",
  "language": "javascript",
  "library": "highcharts",
  "page": "https://anyplot.ai/polar-bar/javascript/highcharts",
  "hub": "https://anyplot.ai/polar-bar",
  "code_json": "https://api.anyplot.ai/specs/polar-bar/highcharts/code",
  "spec_json": "https://api.anyplot.ai/specs/polar-bar",
  "render_light_png": "https://storage.googleapis.com/anyplot-images/plots/polar-bar/javascript/highcharts/plot-light.png",
  "render_dark_png": "https://storage.googleapis.com/anyplot-images/plots/polar-bar/javascript/highcharts/plot-dark.png",
  "interactive_light_html": "https://storage.googleapis.com/anyplot-images/plots/polar-bar/javascript/highcharts/plot-light.html",
  "interactive_dark_html": "https://storage.googleapis.com/anyplot-images/plots/polar-bar/javascript/highcharts/plot-dark.html",
  "quality_score": 88.0,
  "license": "MIT",
  "guide": "https://anyplot.ai/llms.txt"
}
Part of Polar Bar Chart (Wind Rose) on anyplot.ai.