The same plot in 14 other libraries — JavaScript: Chart.js, D3.js, Highcharts, MUI X Charts; Python: Altair, Bokeh, lets-plot, Matplotlib, Plotly, plotnine, Pygal, Seaborn; R: ggplot2; Julia: Makie.jl. Compare all 15 side by side: Polar Bar Chart (Wind Rose) in Python, R, Julia and JavaScript.
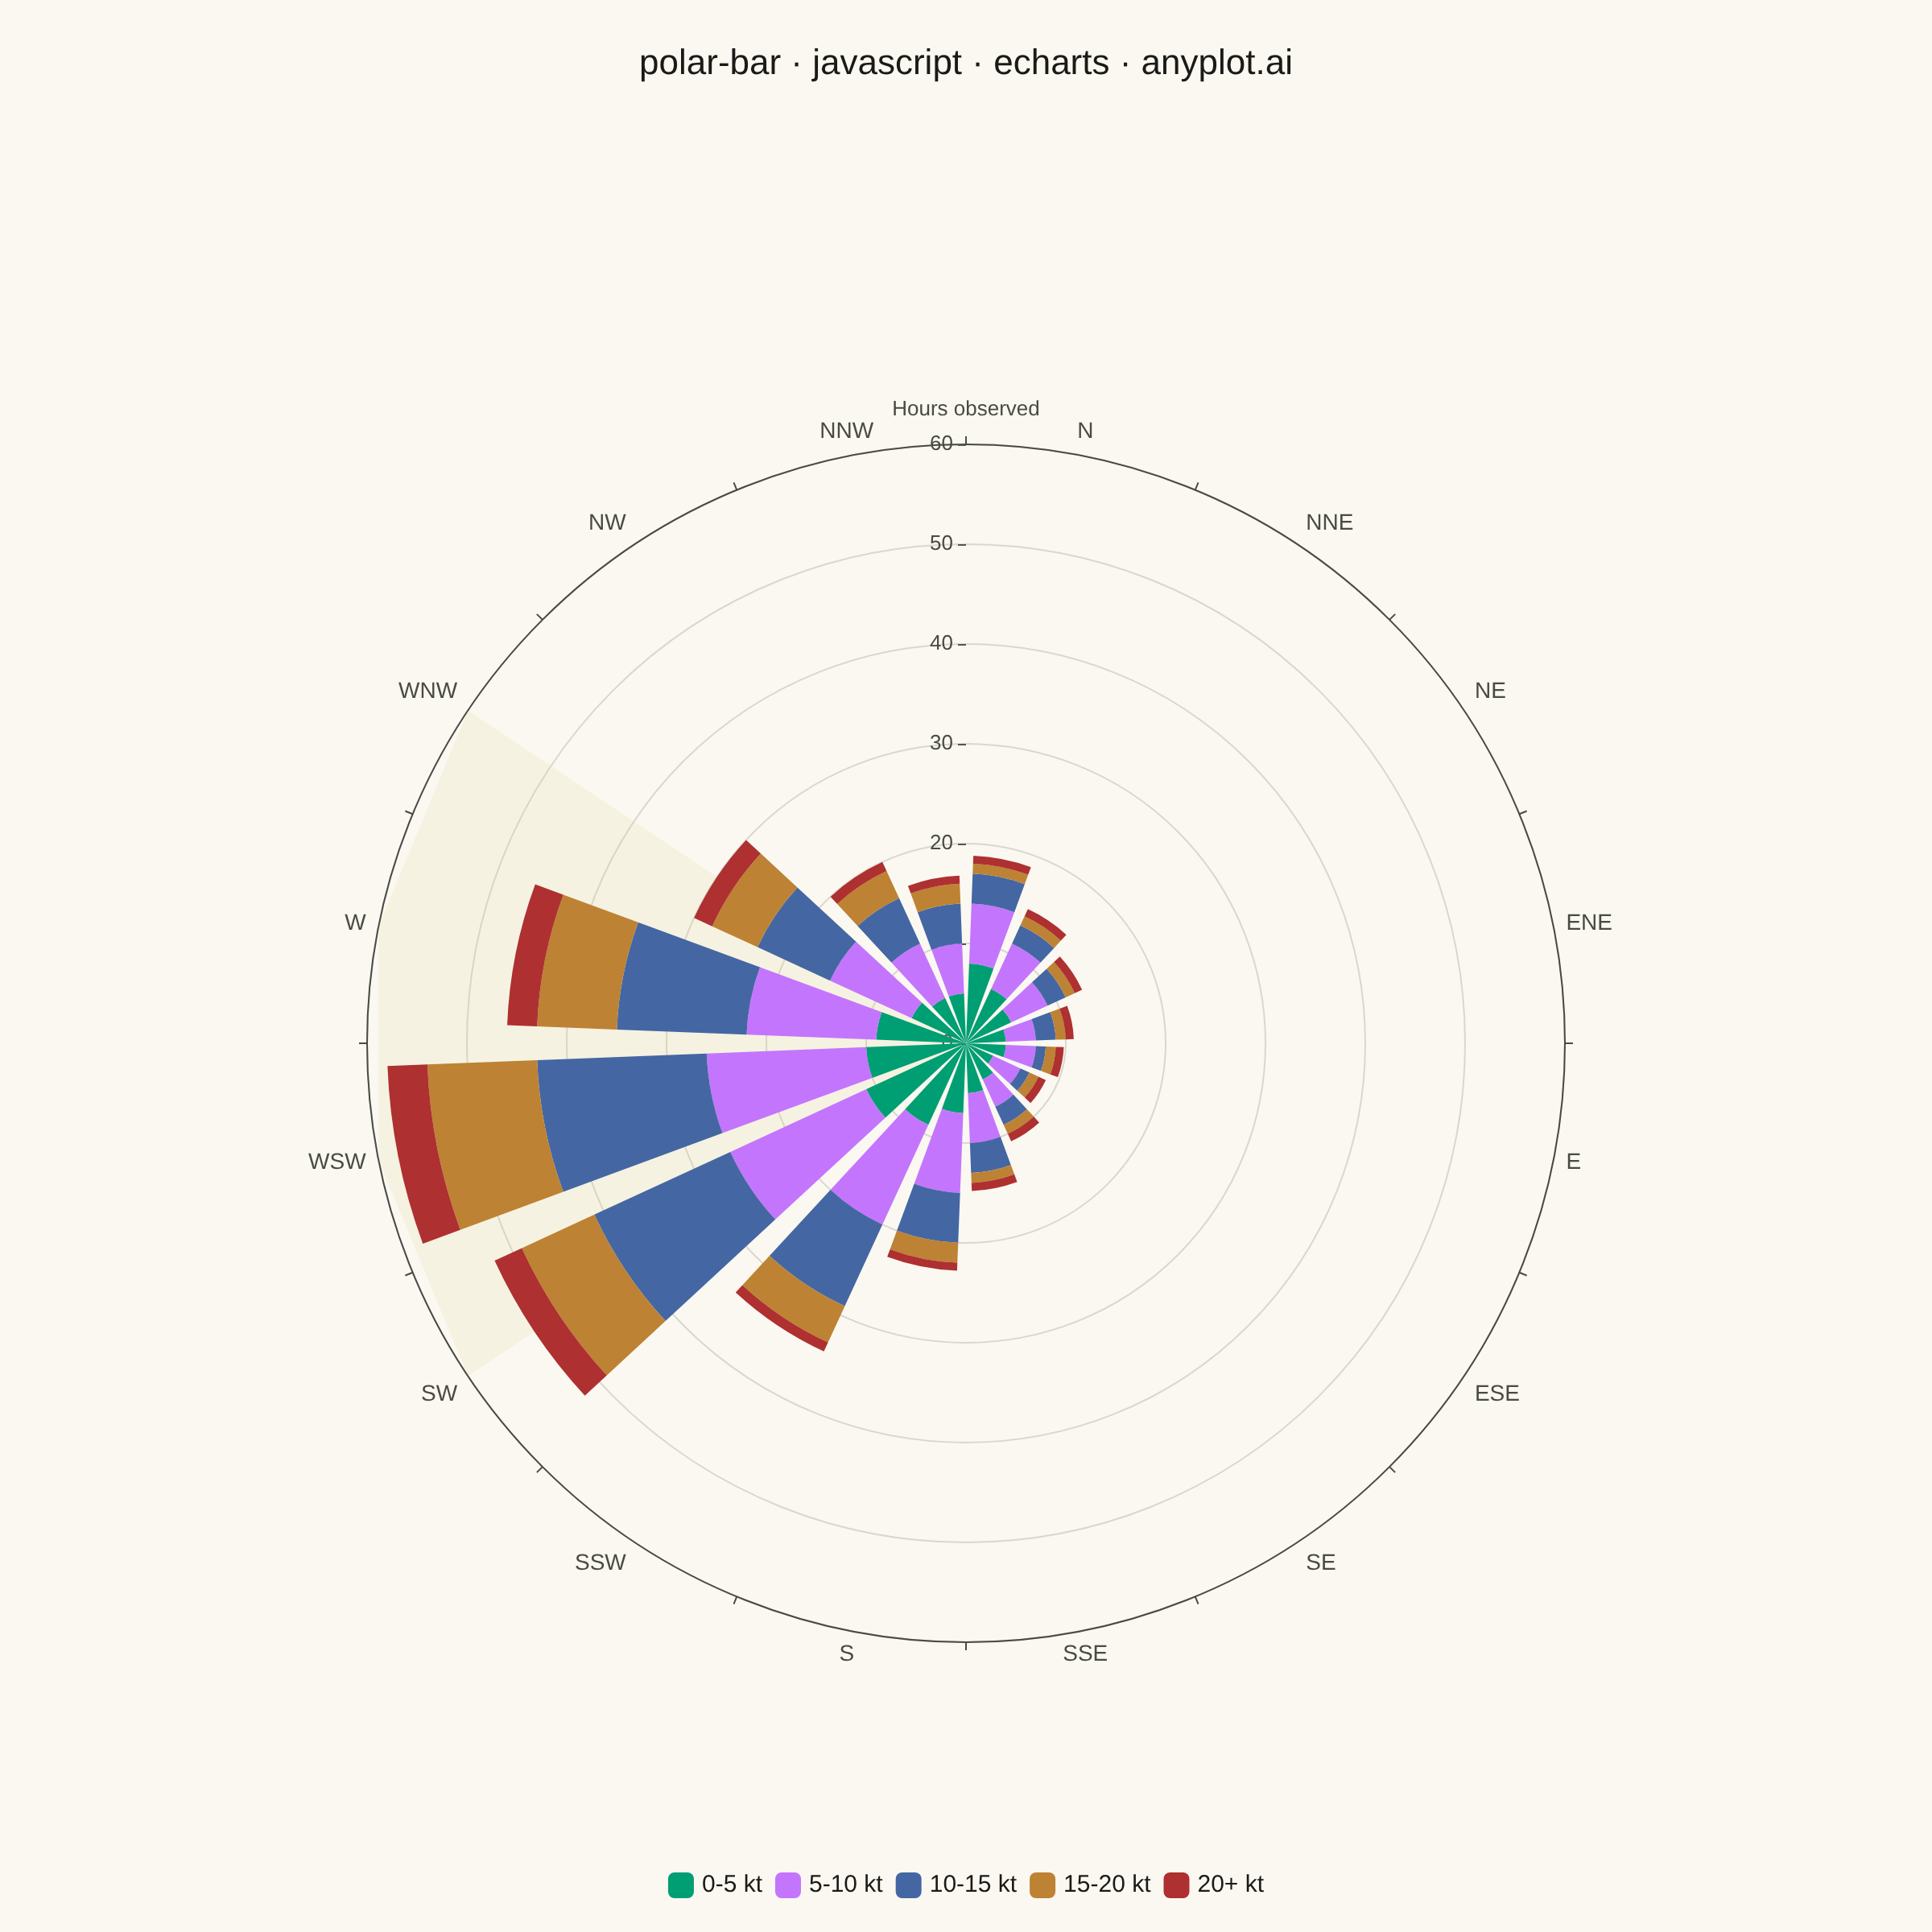
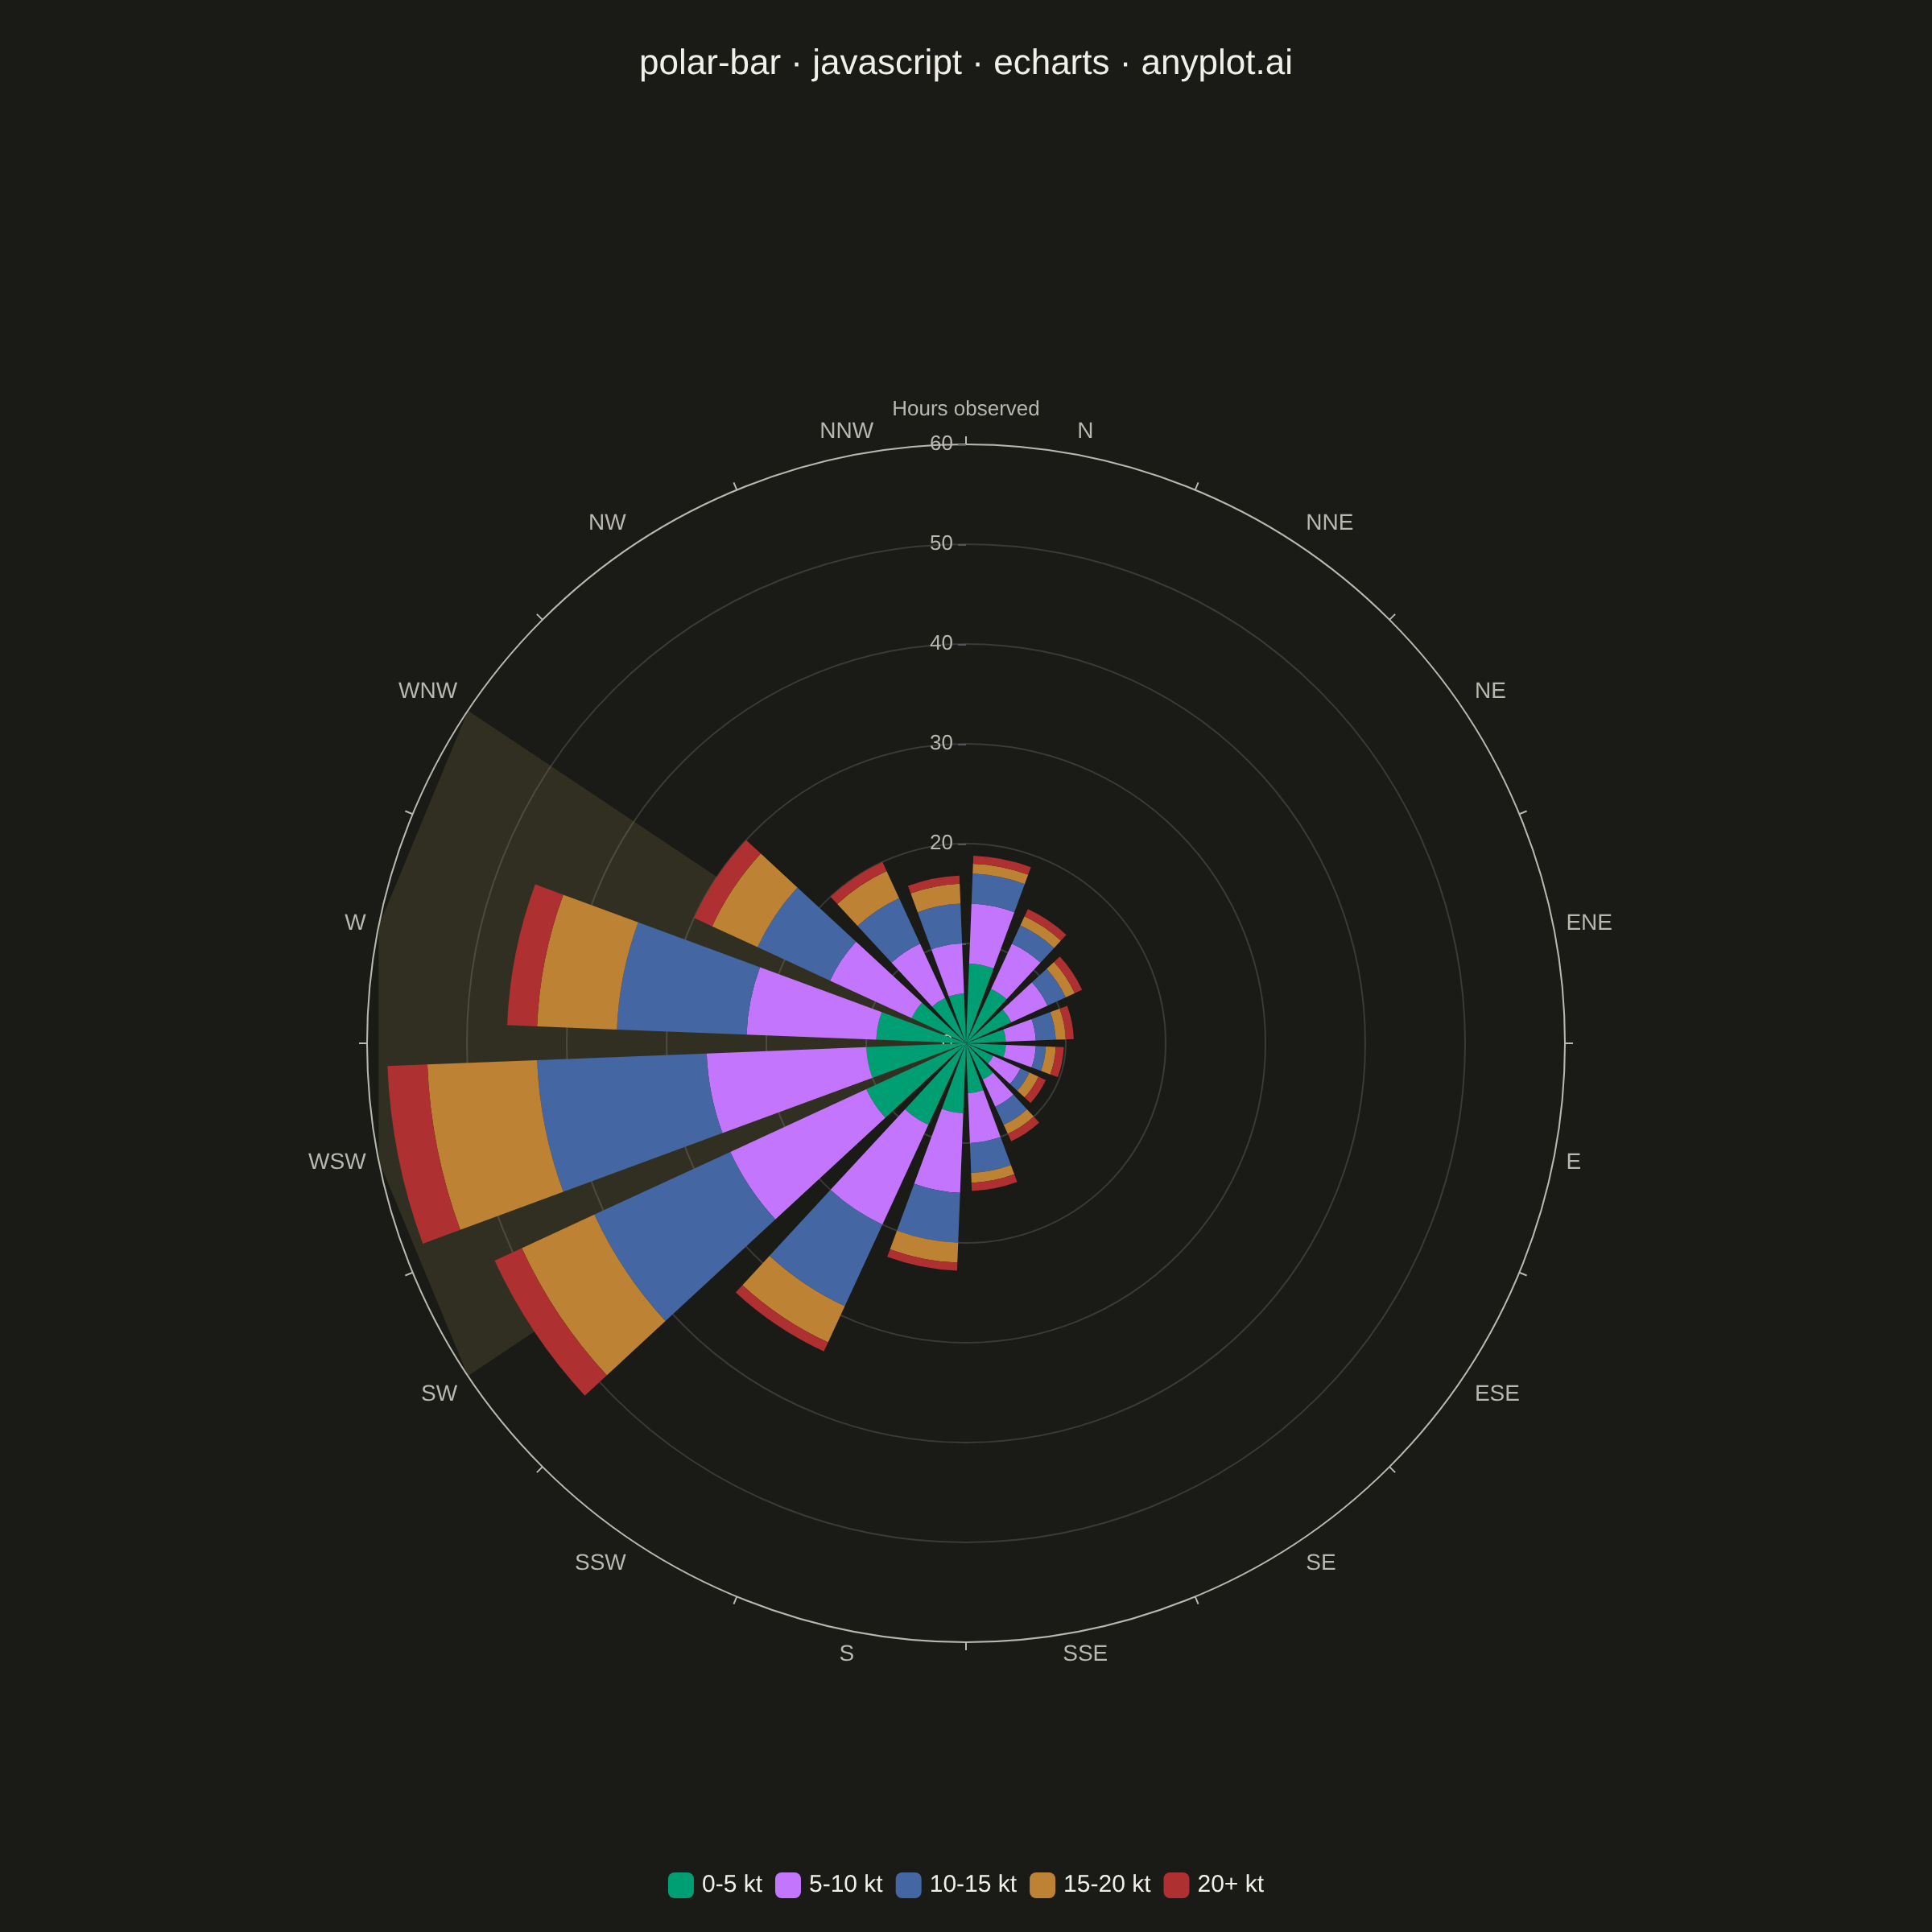
A bar chart arranged in a circle with bars radiating outward from the center. Each bar's angle represents a category (often direction) and length represents magnitude. Commonly used as a wind rose for meteorological data.
// anyplot.ai
// polar-bar: Polar Bar Chart (Wind Rose)
// Library: echarts 6.1.0 | JavaScript 22.23.2
// Quality: 91/100 | Created: 2026-09-05

//# anyplot-orientation: square
const t = window.ANYPLOT_TOKENS;

// --- Data (in-memory, deterministic) ----------------------------------------
// Wind-rose observations: hourly frequency counts by compass direction and
// wind-speed bin. Prevailing westerlies with a secondary southerly lobe.
const directions = [
  "N", "NNE", "NE", "ENE", "E", "ESE", "SE", "SSE",
  "S", "SSW", "SW", "WSW", "W", "WNW", "NW", "NNW",
];
const speedBins = ["0-5 kt", "5-10 kt", "10-15 kt", "15-20 kt", "20+ kt"];
const frequencies = [
  [8, 6, 3, 1, 0], // N
  [6, 5, 2, 1, 0], // NNE
  [5, 4, 2, 1, 0], // NE
  [4, 3, 2, 1, 0], // ENE
  [4, 3, 1, 1, 0], // E
  [3, 3, 1, 1, 0], // ESE
  [4, 3, 2, 1, 0], // SE
  [5, 5, 3, 1, 0], // SSE
  [7, 8, 5, 2, 0], // S
  [9, 11, 9, 4, 1], // SSW
  [11, 15, 15, 8, 3], // SW
  [10, 16, 17, 11, 4], // WSW
  [9, 13, 13, 8, 3], // W
  [6, 9, 8, 5, 2], // WNW
  [5, 6, 5, 3, 1], // NW
  [5, 5, 4, 2, 0], // NNW
];

// --- Init --------------------------------------------------------------------
const chart = echarts.init(document.getElementById("container"));

// --- Option --------------------------------------------------------------------
// barMinHeight reserves a visible radial band for thin stack segments so the
// calm-direction wind-speed colors stay distinguishable near the center.
const series = speedBins.map((bin, binIndex) => ({
  name: bin,
  type: "bar",
  coordinateSystem: "polar",
  stack: "wind",
  barMinHeight: 5,
  data: frequencies.map((row) => row[binIndex]),
  itemStyle: { color: t.palette[binIndex] },
}));

// Subtle amber corridor behind the prevailing SW-WSW-W wind sector — the
// chart's natural focal point — drawn as a custom polar series so it sits
// underneath the stacked bars (echarts' own markArea does not support the
// polar coordinate system). Built as a sampled polygon from api.coord(),
// which already applies the angleAxis/radiusAxis transform used by the
// bars, so the wedge always lines up with the SW/WSW/W category bands.
const sectorStart = directions.indexOf("SW") - 0.5;
const sectorEnd = directions.indexOf("W") + 0.5;
const arcSamples = 24;
const highlightSector = {
  // No `name` — keeps this annotation series out of the legend.
  type: "custom",
  coordinateSystem: "polar",
  silent: true,
  renderItem: (_params, api) => {
    const [cx, cy] = api.coord([0, sectorStart]);
    const points = [[cx, cy]];
    for (let i = 0; i <= arcSamples; i += 1) {
      const angle = sectorStart + ((sectorEnd - sectorStart) * i) / arcSamples;
      points.push(api.coord([60, angle]));
    }
    return { type: "polygon", shape: { points }, style: { fill: t.amber, opacity: 0.12 } };
  },
  data: [0],
};

chart.setOption({
  animation: false,
  backgroundColor: "transparent",
  title: {
    text: "polar-bar · javascript · echarts · anyplot.ai",
    left: "center",
    top: 24,
    textStyle: { color: t.ink, fontSize: 22, fontWeight: 500 },
  },
  legend: {
    bottom: 16,
    left: "center",
    itemWidth: 16,
    itemHeight: 16,
    textStyle: { color: t.ink, fontSize: 15 },
  },
  polar: { center: ["50%", "54%"], radius: "62%" },
  angleAxis: {
    type: "category",
    data: directions,
    startAngle: 90,
    clockwise: true,
    axisLabel: { color: t.inkSoft, fontSize: 14 },
    axisLine: { lineStyle: { color: t.inkSoft } },
    splitLine: { lineStyle: { color: t.grid } },
  },
  radiusAxis: {
    type: "value",
    name: "Hours observed",
    min: 0,
    max: 60,
    nameTextStyle: { color: t.inkSoft, fontSize: 13 },
    axisLabel: { color: t.inkSoft, fontSize: 13 },
    axisLine: { show: false },
    splitLine: { lineStyle: { color: t.grid } },
  },
  series: [highlightSector, ...series],
});
Runnable source as JSON, for any HTTP client: https://api.anyplot.ai/specs/polar-bar/echarts/code. Any spec id and library id listed in llms-full.txt fit the same URL shape; every URL below is complete and callable.
{
  "spec_id": "polar-bar",
  "language": "javascript",
  "library": "echarts",
  "page": "https://anyplot.ai/polar-bar/javascript/echarts",
  "hub": "https://anyplot.ai/polar-bar",
  "code_json": "https://api.anyplot.ai/specs/polar-bar/echarts/code",
  "spec_json": "https://api.anyplot.ai/specs/polar-bar",
  "render_light_png": "https://storage.googleapis.com/anyplot-images/plots/polar-bar/javascript/echarts/plot-light.png",
  "render_dark_png": "https://storage.googleapis.com/anyplot-images/plots/polar-bar/javascript/echarts/plot-dark.png",
  "interactive_light_html": "https://storage.googleapis.com/anyplot-images/plots/polar-bar/javascript/echarts/plot-light.html",
  "interactive_dark_html": "https://storage.googleapis.com/anyplot-images/plots/polar-bar/javascript/echarts/plot-dark.html",
  "quality_score": 91.0,
  "license": "MIT",
  "guide": "https://anyplot.ai/llms.txt"
}
Part of Polar Bar Chart (Wind Rose) on anyplot.ai.