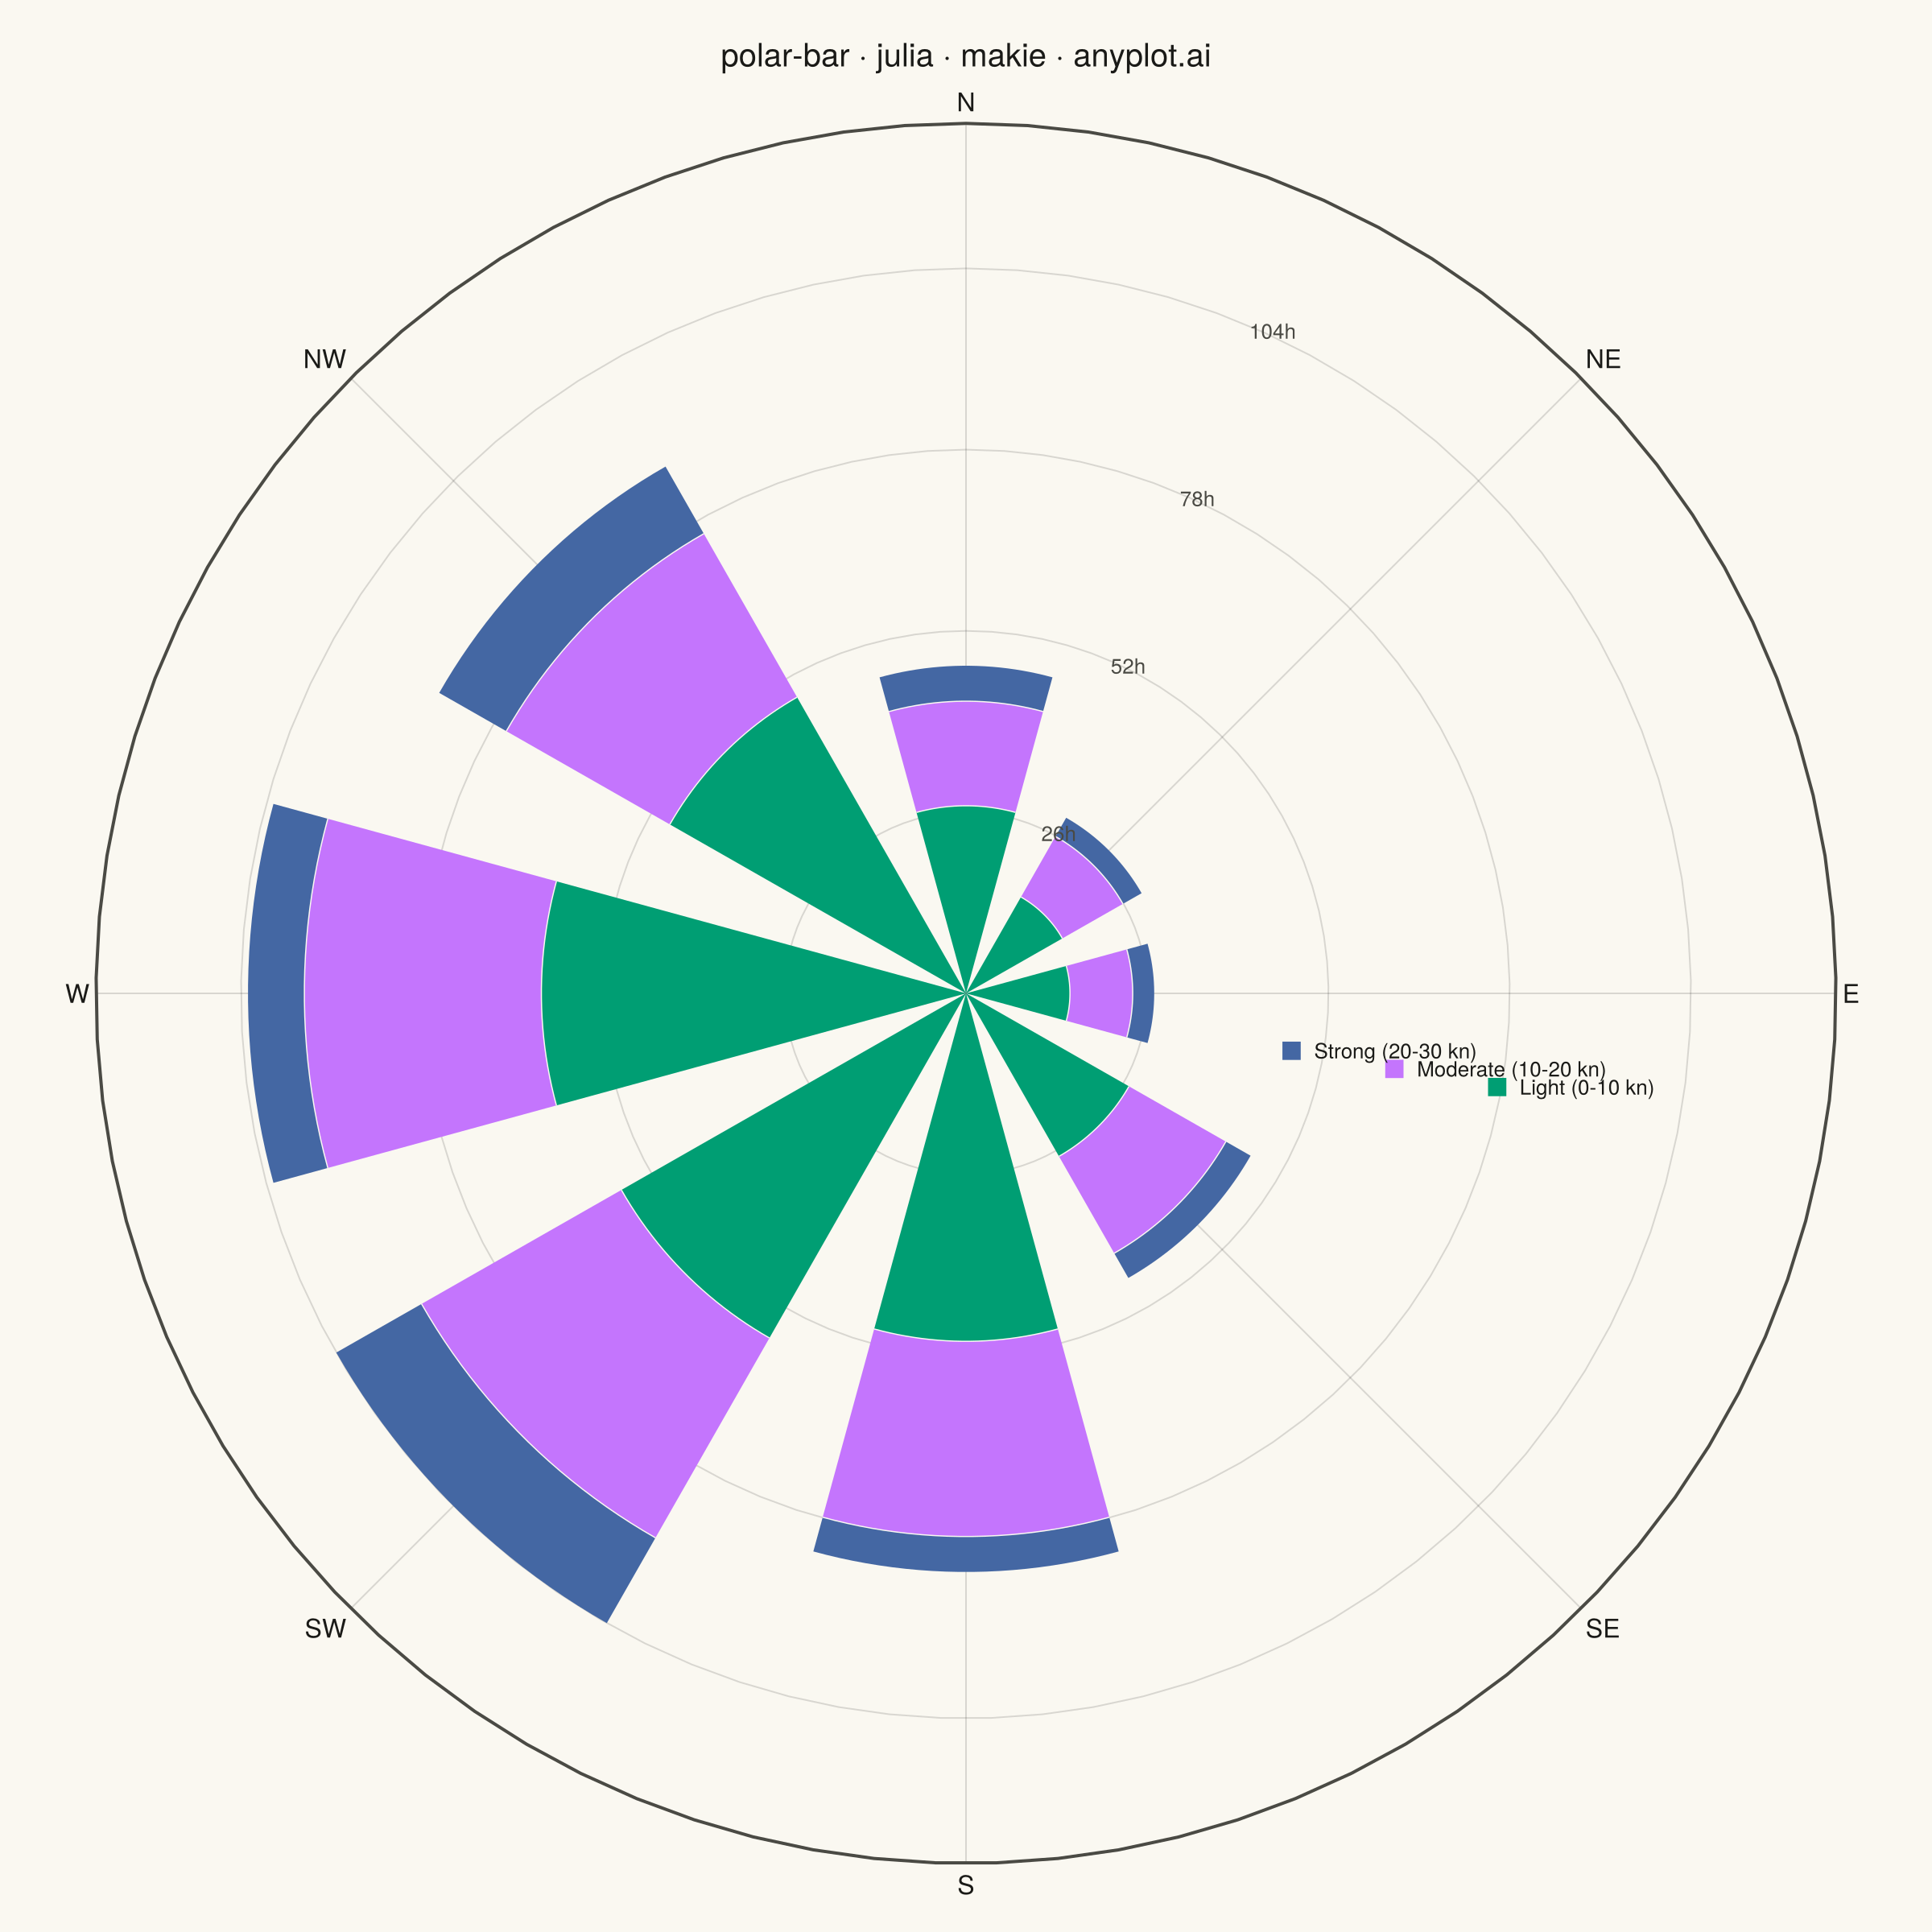
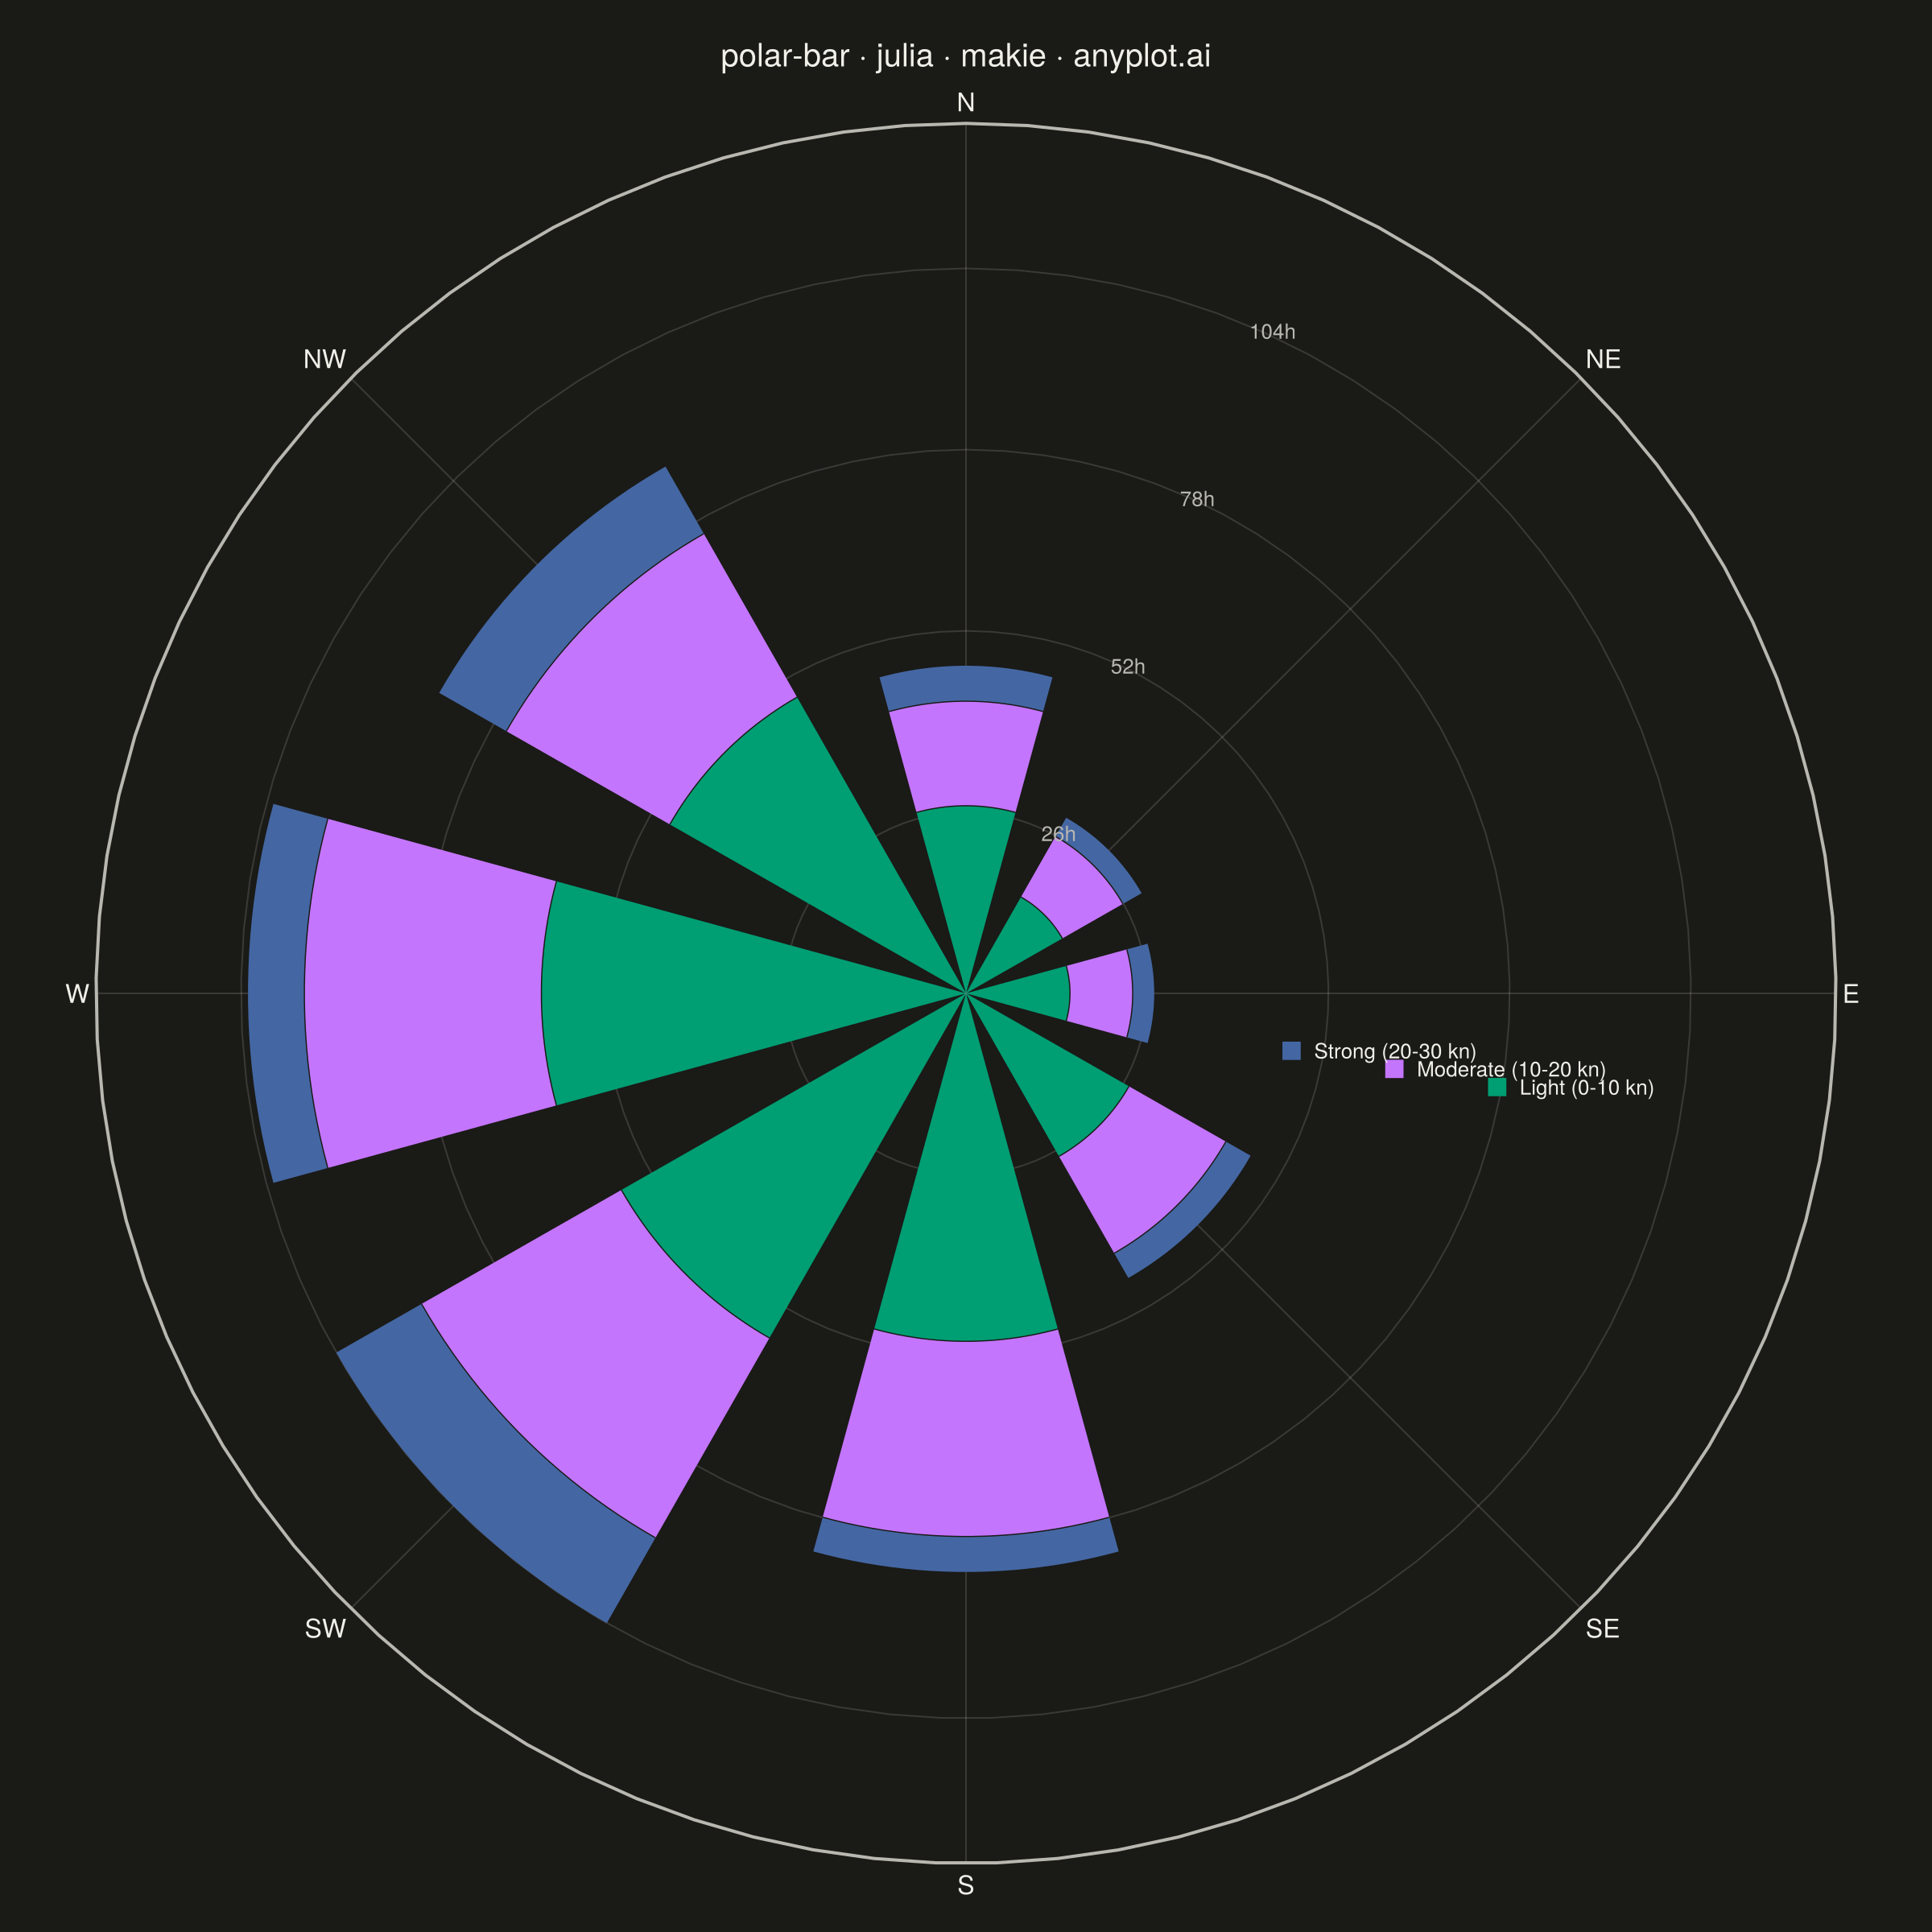
The same plot in 14 other libraries — Python: Altair, Bokeh, lets-plot, Matplotlib, Plotly, plotnine, Pygal, Seaborn; R: ggplot2; JavaScript: Chart.js, D3.js, Apache ECharts, Highcharts, MUI X Charts. Compare all 15 side by side: Polar Bar Chart (Wind Rose) in Python, R, Julia and JavaScript.
A bar chart arranged in a circle with bars radiating outward from the center. Each bar's angle represents a category (often direction) and length represents magnitude. Commonly used as a wind rose for meteorological data.
# anyplot.ai
# polar-bar: Polar Bar Chart (Wind Rose)
# Library: makie 0.21.9 | Julia 1.11.9
# Quality: 87/100 | Created: 2026-09-05

using CairoMakie
using Random

Random.seed!(42)

# --- Theme tokens -------------------------------------------------------
THEME = get(ENV, "ANYPLOT_THEME", "light")
PAGE_BG = THEME == "light" ? colorant"#FAF8F1" : colorant"#1A1A17"
INK = THEME == "light" ? colorant"#1A1A17" : colorant"#F0EFE8"
INK_SOFT = THEME == "light" ? colorant"#4A4A44" : colorant"#B8B7B0"
IMPRINT_PALETTE = [colorant"#009E73", colorant"#C475FD", colorant"#4467A3"]

# --- Data -----------------------------------------------------------------
# Meteorological station: hours per year a wind was observed, split by
# compass direction and speed band. Prevailing wind blows from the SW-W
# quadrant, a common mid-latitude pattern.
directions = ["N", "NE", "E", "SE", "S", "SW", "W", "NW"]
n_directions = length(directions)
bearings_deg = collect(0:45:315)
bearings_rad = deg2rad.(bearings_deg)

speed_bins = ["Light (0-10 kn)", "Moderate (10-20 kn)", "Strong (20-30 kn)"]
n_bins = length(speed_bins)

prevailing_bearing = 247.5
base_hours = 60.0 .+ 40.0 .* cosd.(bearings_deg .- prevailing_bearing)
total_hours = round.(Int, base_hours .+ rand(n_directions) .* 15.0)

light_hours = round.(Int, total_hours .* (0.55 .+ 0.05 .* rand(n_directions)))
moderate_hours = round.(Int, total_hours .* (0.30 .+ 0.05 .* rand(n_directions)))
strong_hours = max.(total_hours .- light_hours .- moderate_hours, 3)

hours_by_bin = hcat(light_hours, moderate_hours, strong_hours)  # n_directions x n_bins

# --- Plot -------------------------------------------------------------------
fig = Figure(size = (1200, 1200), fontsize = 14, backgroundcolor = PAGE_BG)

row_totals = vec(sum(hours_by_bin, dims = 2))
r_grid_max = maximum(row_totals)
r_ticks = round.(Int, range(0, r_grid_max, length = 5))[2:end]
r_display_max = r_grid_max * 1.2

sector_rad = 2pi / n_directions
bar_half_width = sector_rad * 0.34  # < sector/2 so adjacent direction wedges stay visibly separated

# PolarAxis (native since Makie 0.19) supplies the compass ticks, radial
# grid/ticks, and spine directly instead of hand-rolled sin/cos geometry.
# theta_0 = -pi/2, direction = -1 puts N at 12 o'clock and advances
# clockwise through E/S/W, matching a real compass rose.
ax = PolarAxis(
    fig[1, 1];
    theta_0 = -pi / 2,
    direction = -1,
    title = "polar-bar · julia · makie · anyplot.ai",
    titlesize = 20,
    titlecolor = INK,
    backgroundcolor = PAGE_BG,
    thetaticks = (bearings_rad, directions),
    thetaticklabelsize = 16,
    thetaticklabelcolor = INK,
    thetagridcolor = RGBAf(INK.r, INK.g, INK.b, 0.15),
    rticks = r_ticks,
    rtickformat = vs -> ["$(round(Int, v))h" for v in vs],
    rtickangle = sector_rad / 2,  # centered in the N-NE gap, clear of both bars
    rticklabelsize = 13,
    rticklabelcolor = INK_SOFT,
    rgridcolor = RGBAf(INK.r, INK.g, INK.b, 0.15),
    spinecolor = INK_SOFT,
    rlimits = (0, r_display_max),
)

# Stacked wedges — each direction is n_bins bands radiating from the center.
# `band!` (unlike `poly!`) respects PolarAxis's per-vertex transform, so
# sampling each band across an arc gives it a true curved outer edge instead
# of a straight-edged polygon.
n_arc = 24
for i in 1:n_directions
    center = bearings_rad[i]
    ts = collect(range(center - bar_half_width, center + bar_half_width, length = n_arc))
    r0 = 0.0
    for b in 1:n_bins
        r1 = r0 + hours_by_bin[i, b]
        band!(ax, ts, fill(r0, n_arc), fill(r1, n_arc); color = IMPRINT_PALETTE[b])
        if b < n_bins
            lines!(ax, ts, fill(r1, n_arc); color = PAGE_BG, linewidth = 1.5)
        end
        r0 = r1
    end
end

# Manual legend: PolarAxis does not support `axislegend`/an overlaid `Legend`
# block (its content lives in a different scene graph than a plain Axis), so
# the swatches are drawn directly on the polar axis in (theta, r) coordinates,
# placed in the NE/E gap where the prevailing-wind data leaves the bars short.
legend_theta = deg2rad(100)
legend_radii = r_display_max .* [0.62, 0.50, 0.38]
for (b, r) in enumerate(legend_radii)
    scatter!(ax, [legend_theta], [r]; marker = :rect, markersize = 18, color = IMPRINT_PALETTE[b])
    text!(ax, legend_theta, r; text = speed_bins[b], color = INK, fontsize = 13,
          align = (:left, :center), offset = (14, 0))
end

# --- Save -------------------------------------------------------------------
save("plot-$(THEME).png", fig; px_per_unit = 2)
Runnable source as JSON, for any HTTP client: https://api.anyplot.ai/specs/polar-bar/makie/code. Any spec id and library id listed in llms-full.txt fit the same URL shape; every URL below is complete and callable.
{
  "spec_id": "polar-bar",
  "language": "julia",
  "library": "makie",
  "page": "https://anyplot.ai/polar-bar/julia/makie",
  "hub": "https://anyplot.ai/polar-bar",
  "code_json": "https://api.anyplot.ai/specs/polar-bar/makie/code",
  "spec_json": "https://api.anyplot.ai/specs/polar-bar",
  "render_light_png": "https://storage.googleapis.com/anyplot-images/plots/polar-bar/julia/makie/plot-light.png",
  "render_dark_png": "https://storage.googleapis.com/anyplot-images/plots/polar-bar/julia/makie/plot-dark.png",
  "quality_score": 87.0,
  "license": "MIT",
  "guide": "https://anyplot.ai/llms.txt"
}
Part of Polar Bar Chart (Wind Rose) on anyplot.ai.