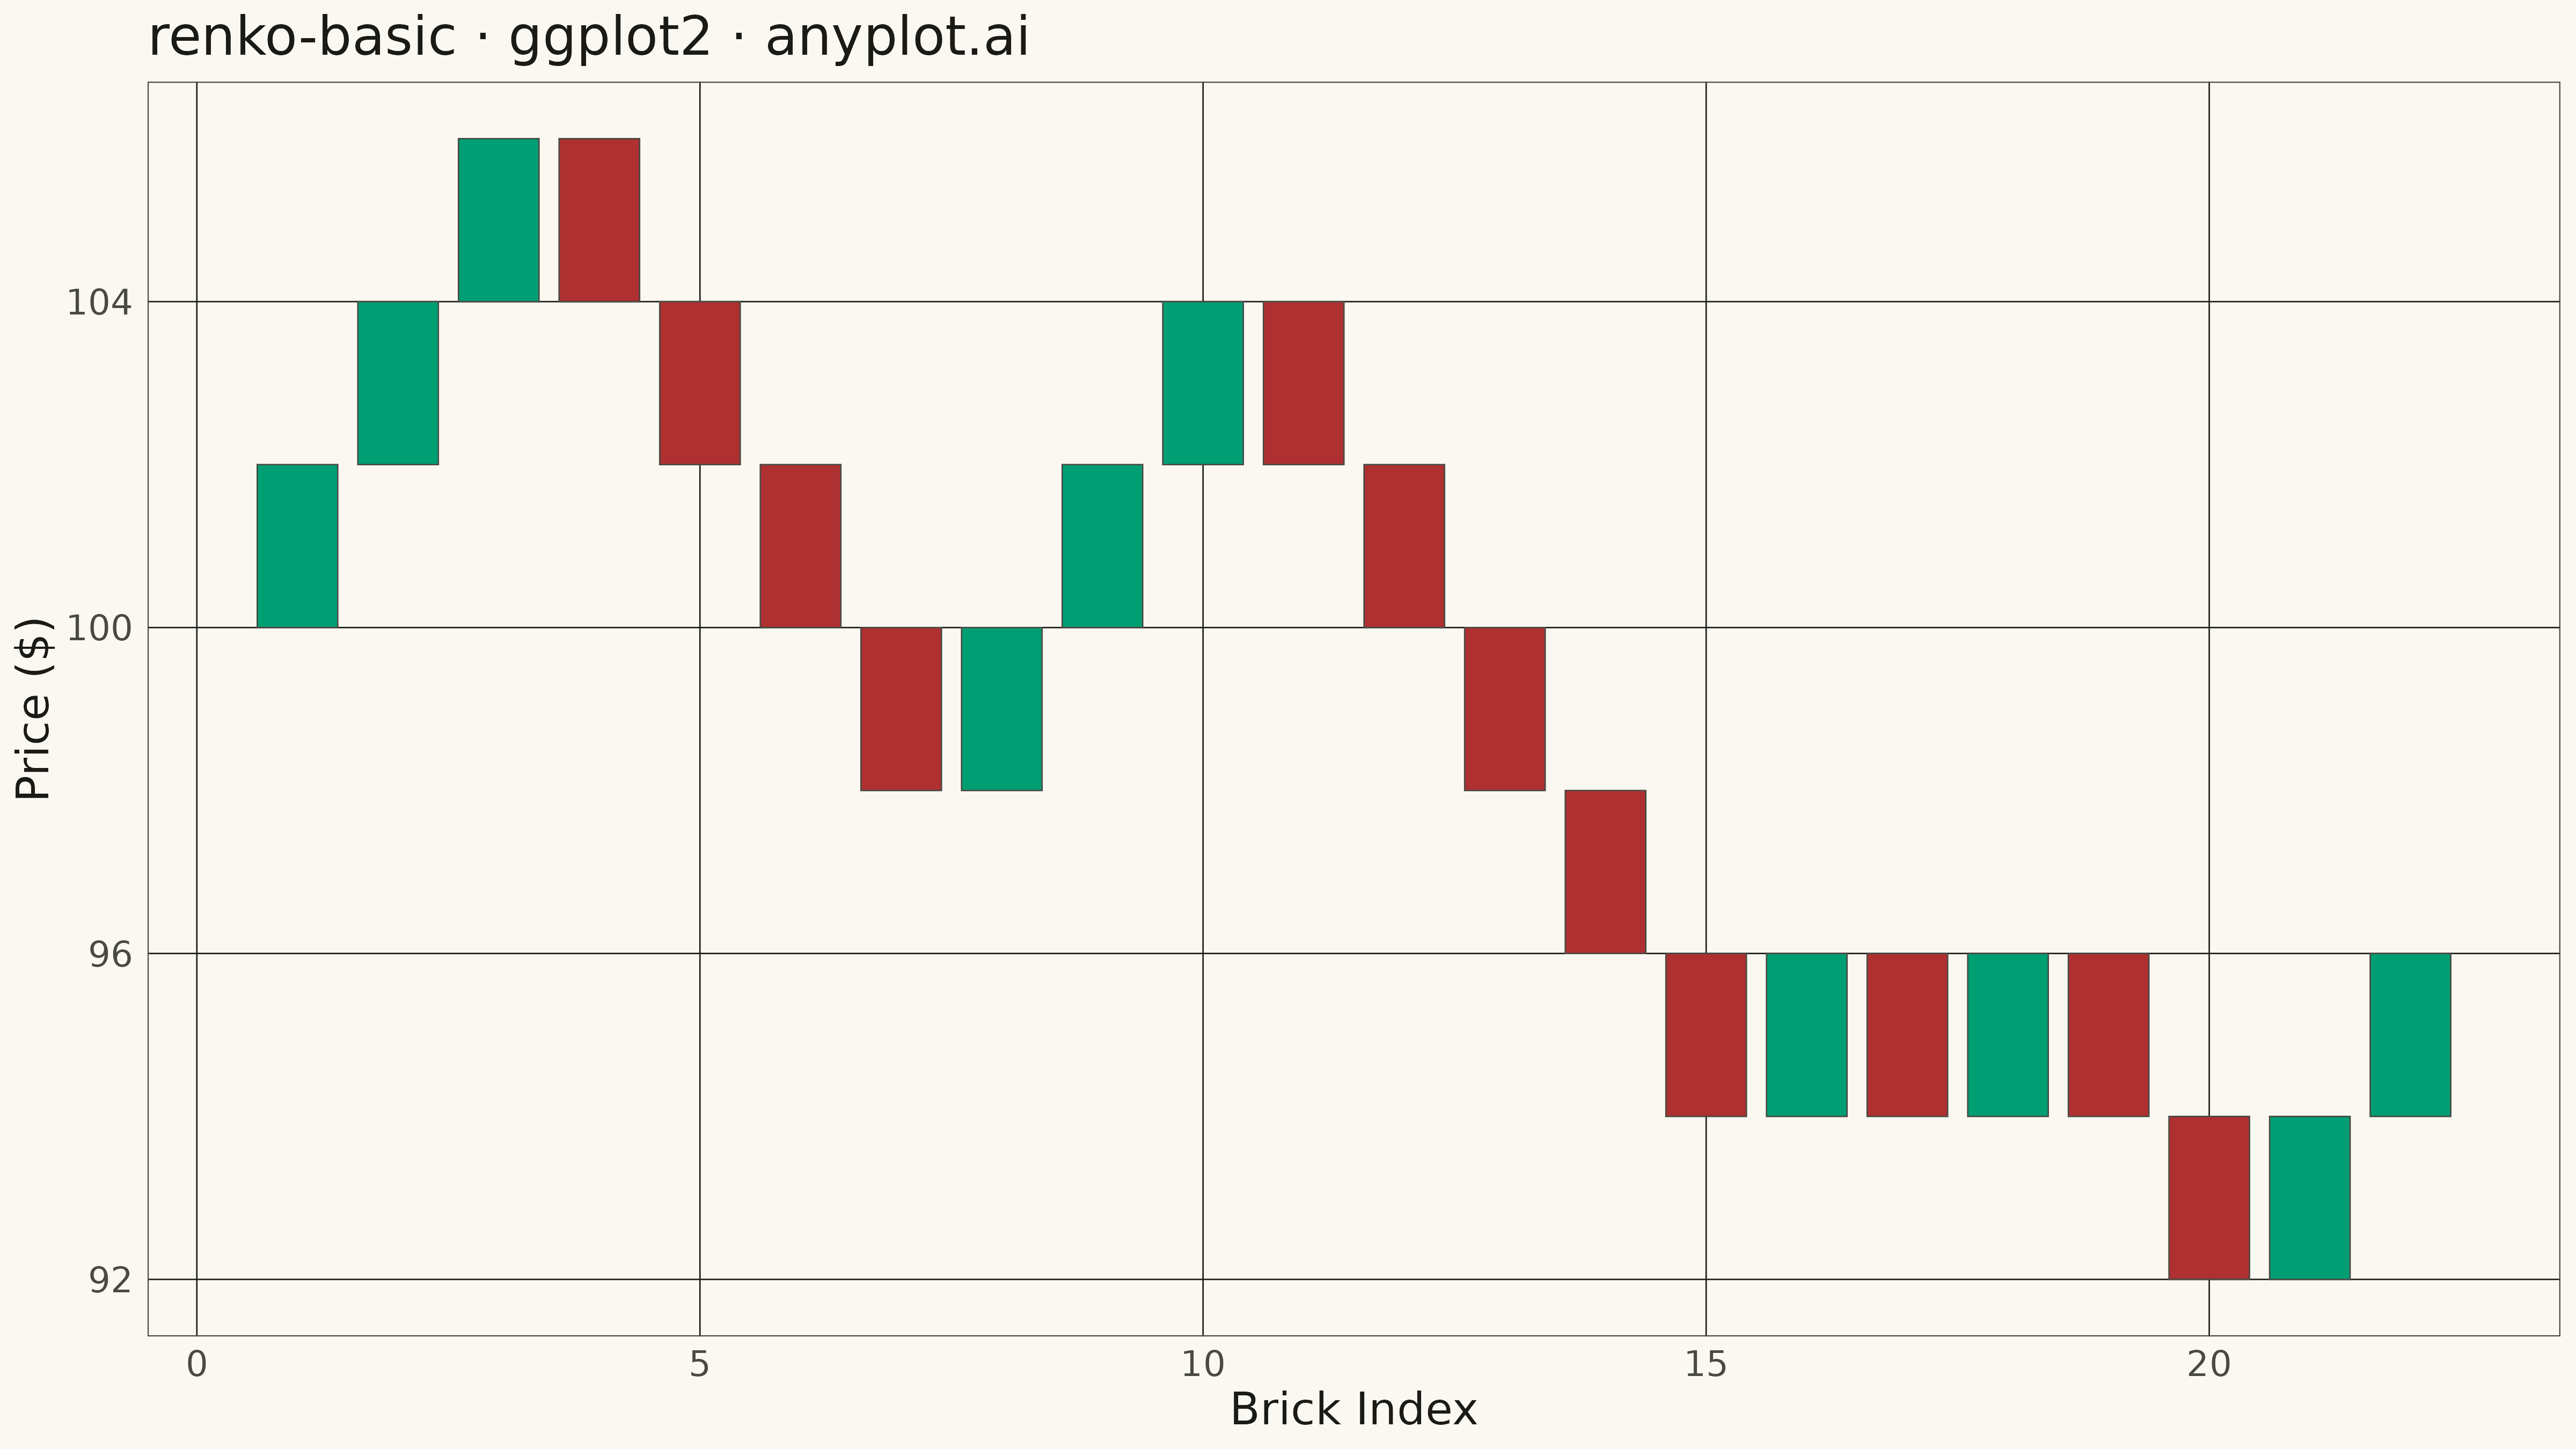
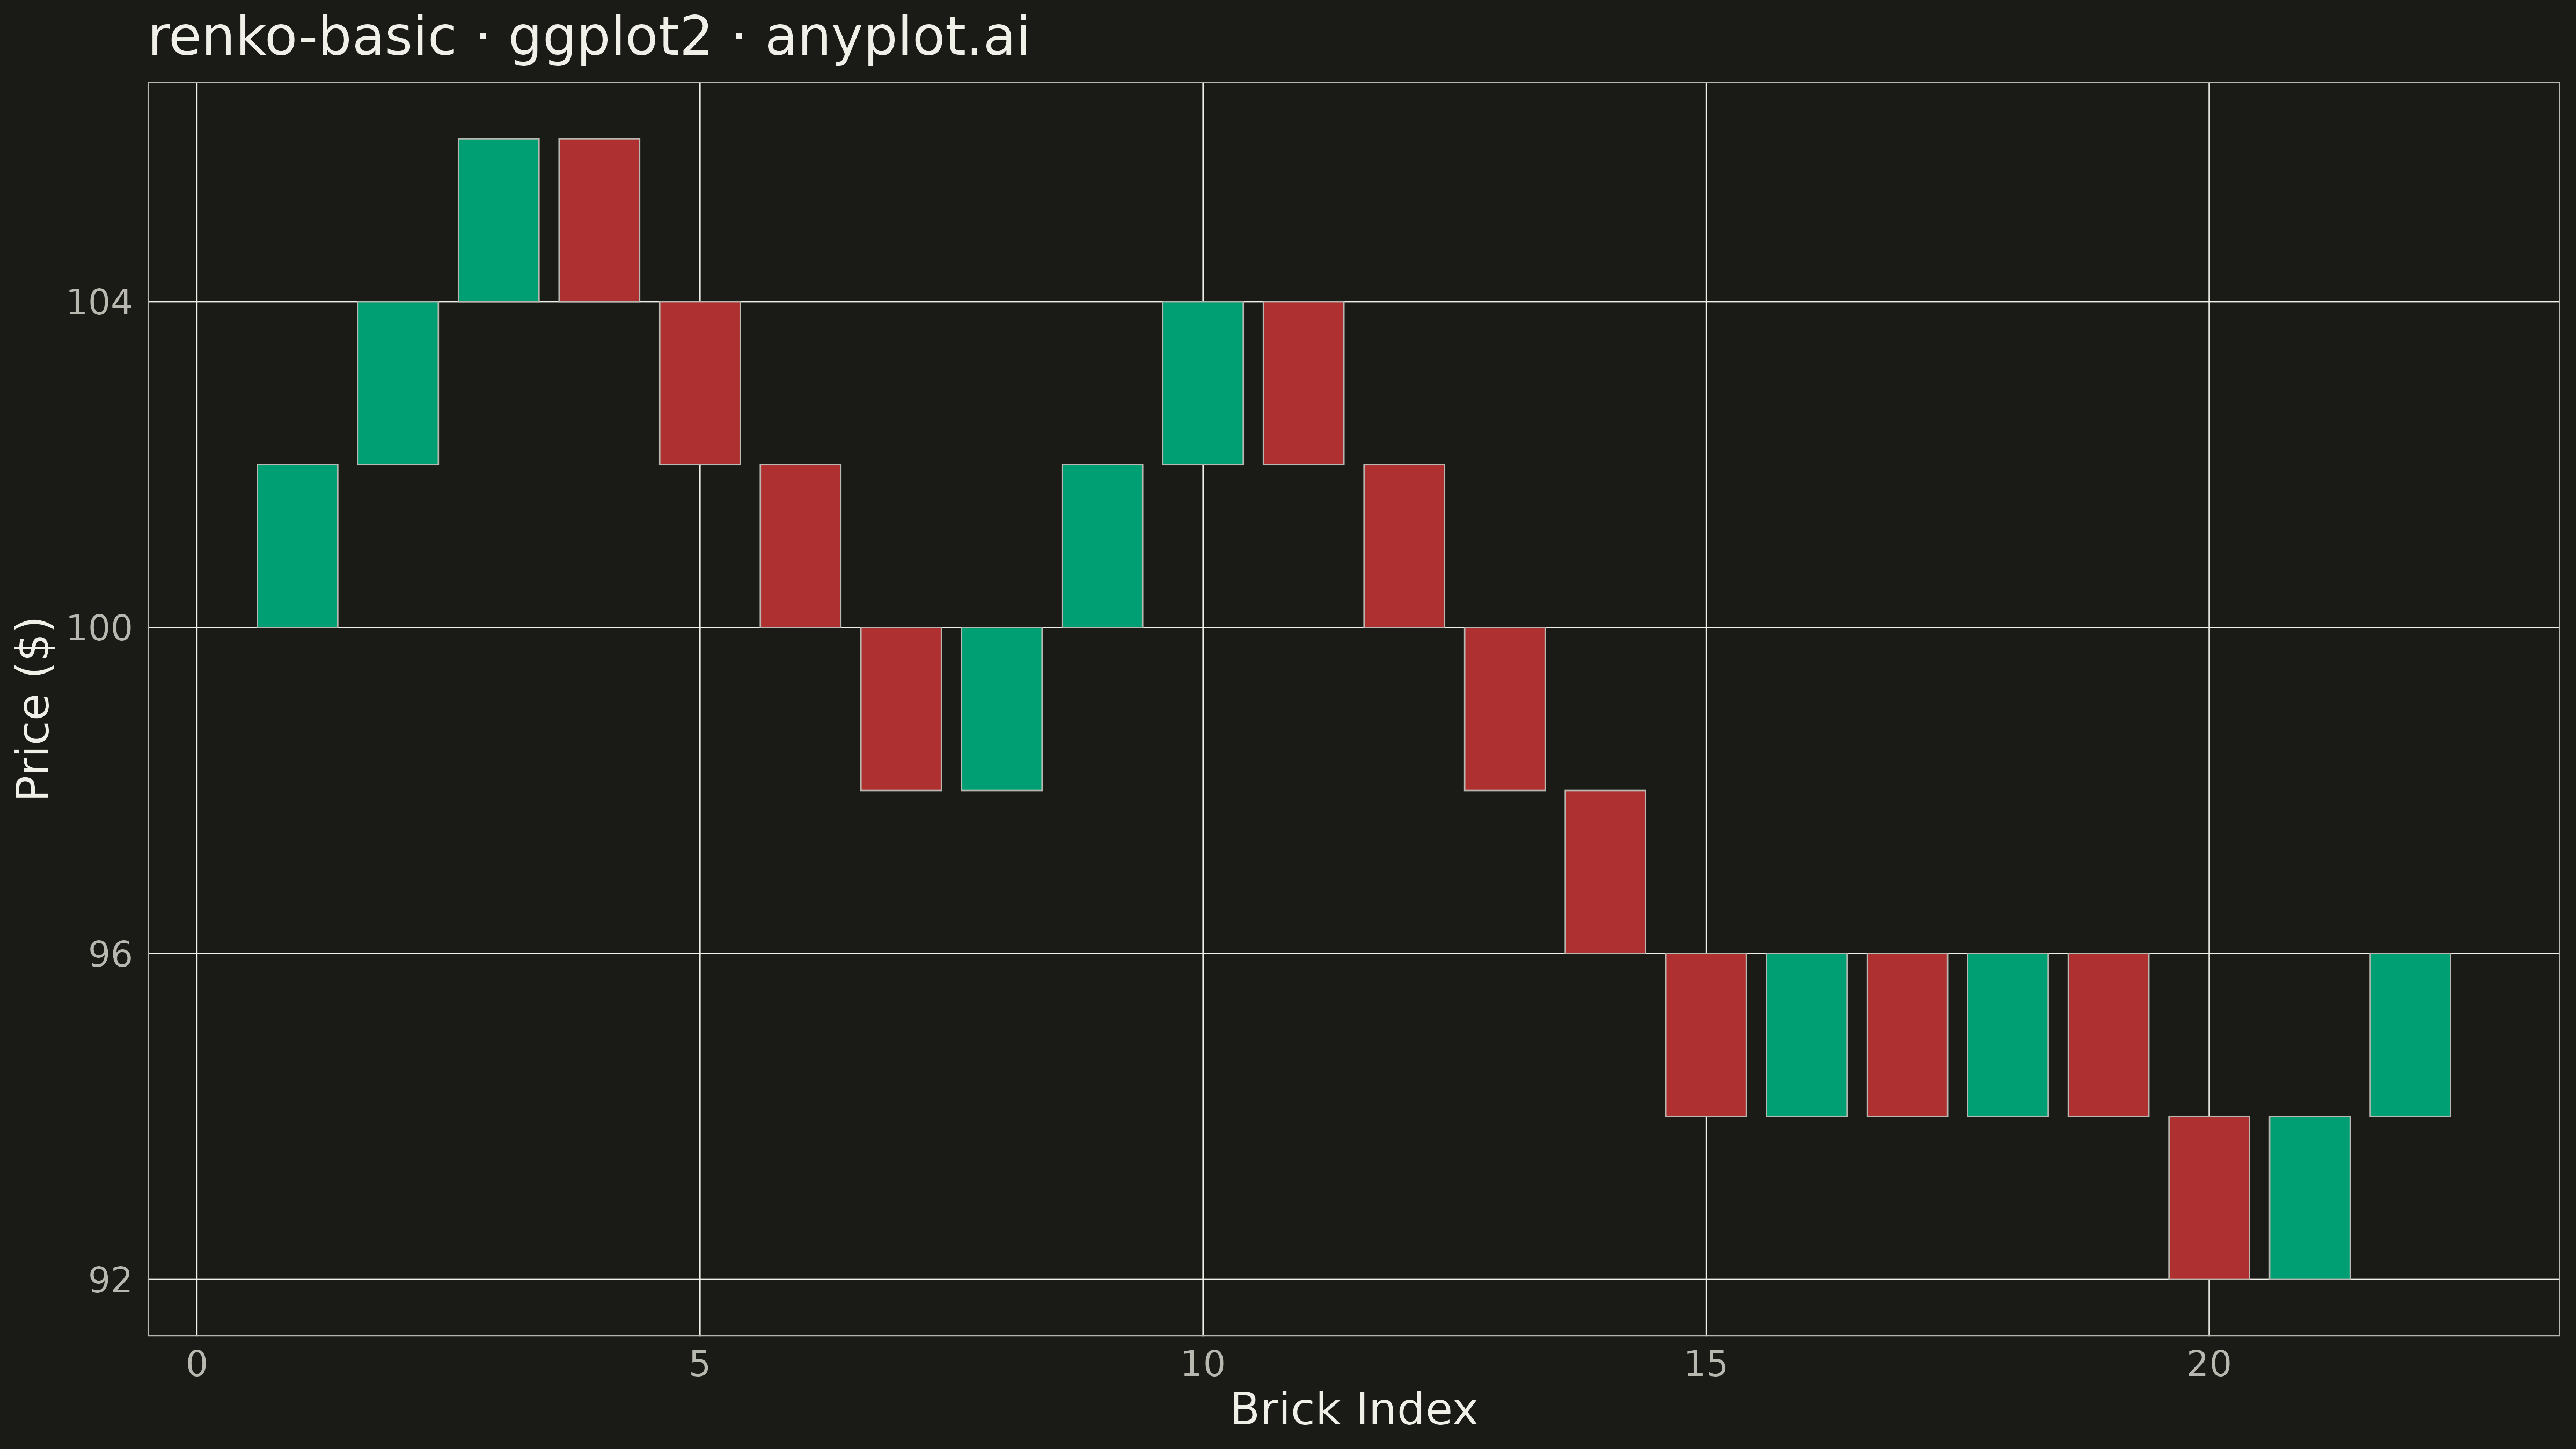
The same plot in 14 other libraries — Python: Altair, Bokeh, lets-plot, Matplotlib, Plotly, plotnine, Pygal, Seaborn; Julia: Makie.jl; JavaScript: Chart.js, D3.js, Apache ECharts, Highcharts, MUI X Charts. Compare all 15 side by side: Basic Renko Chart in Python, R, Julia and JavaScript.
A Renko chart displays price movements using fixed-size bricks that ignore time and focus purely on price action. A new brick is drawn only when the price moves by a specified amount (brick size), filtering out market noise and minor fluctuations. Bullish bricks (price increase) and bearish bricks (price decrease) alternate direction on trend reversals, making it easy to identify trends, support/resistance levels, and potential trading signals.
#' anyplot.ai
#' renko-basic: Basic Renko Chart
#' Library: ggplot2 3.5.1 | R 4.4.1
#' Quality: 82/100 | Created: 2026-05-17

library(ggplot2)
library(dplyr)
library(ragg)

set.seed(42)

# --- Theme tokens -----------------------------------------------------------
THEME       <- Sys.getenv("ANYPLOT_THEME", "light")
PAGE_BG     <- if (THEME == "light") "#FAF8F1" else "#1A1A17"
INK         <- if (THEME == "light") "#1A1A17" else "#F0EFE8"
INK_SOFT    <- if (THEME == "light") "#4A4A44" else "#B8B7B0"

# Color palette
BULL        <- "#009E73"  # Okabe-Ito position 1 (green)
BEAR        <- "#AE3030"  # imprint red — bearish

# --- Data generation --------------------------------------------------------
# Generate synthetic stock price data
n <- 250
dates <- seq.Date(as.Date("2024-01-01"), length.out = n, by = "day")
prices <- 100 + cumsum(rnorm(n, 0, 0.8))

df_prices <- data.frame(date = dates, close = prices)

# --- Renko brick calculation -----------------------------------------------
brick_size <- 2.0

calculate_renko <- function(prices, brick_size) {
  bricks <- list()
  brick_count <- 0
  current_level <- floor(prices[1] / brick_size) * brick_size
  direction <- 0  # 0 = start, 1 = up, -1 = down

  for (i in seq_along(prices)) {
    price <- prices[i]

    while (price >= current_level + brick_size) {
      brick_count <- brick_count + 1
      new_direction <- 1
      if (direction == 1) {
        bricks[[brick_count]] <- list(
          brick_num = brick_count,
          open = current_level,
          close = current_level + brick_size,
          direction = "up"
        )
      } else {
        bricks[[brick_count]] <- list(
          brick_num = brick_count,
          open = current_level,
          close = current_level + brick_size,
          direction = "up"
        )
      }
      direction <- 1
      current_level <- current_level + brick_size
    }

    while (price <= current_level - brick_size) {
      brick_count <- brick_count + 1
      if (direction == -1) {
        bricks[[brick_count]] <- list(
          brick_num = brick_count,
          open = current_level,
          close = current_level - brick_size,
          direction = "down"
        )
      } else {
        bricks[[brick_count]] <- list(
          brick_num = brick_count,
          open = current_level,
          close = current_level - brick_size,
          direction = "down"
        )
      }
      direction <- -1
      current_level <- current_level - brick_size
    }
  }

  do.call(rbind, lapply(bricks, function(x) {
    data.frame(
      brick_num = x$brick_num,
      open = x$open,
      close = x$close,
      direction = x$direction,
      stringsAsFactors = FALSE
    )
  }))
}

renko_bricks <- calculate_renko(df_prices$close, brick_size)

# Calculate dimensions for visualization
renko_bricks <- renko_bricks %>%
  mutate(
    x_min = brick_num - 0.4,
    x_max = brick_num + 0.4,
    y_min = pmin(open, close),
    y_max = pmax(open, close)
  )

# --- Plot -------------------------------------------------------------------
p <- ggplot(renko_bricks, aes(fill = direction)) +
  geom_rect(
    aes(xmin = x_min, xmax = x_max, ymin = y_min, ymax = y_max),
    color = INK_SOFT,
    linewidth = 0.3
  ) +
  scale_fill_manual(
    values = c("up" = BULL, "down" = BEAR),
    guide = "none"
  ) +
  labs(
    title = "renko-basic · ggplot2 · anyplot.ai",
    x = "Brick Index",
    y = "Price ($)"
  ) +
  theme_minimal(base_size = 14) +
  theme(
    plot.background = element_rect(fill = PAGE_BG, color = PAGE_BG),
    panel.background = element_rect(fill = PAGE_BG, color = NA),
    panel.grid.major = element_line(color = INK, linewidth = 0.3),
    panel.grid.minor = element_blank(),
    panel.border = element_rect(color = INK_SOFT, fill = NA, linewidth = 0.5),
    axis.title = element_text(color = INK, size = 20),
    axis.text = element_text(color = INK_SOFT, size = 16),
    plot.title = element_text(color = INK, size = 24, face = "plain"),
    legend.position = "none"
  )

# --- Save -------------------------------------------------------------------
ggsave(
  filename = sprintf("plot-%s.png", THEME),
  plot = p,
  device = ragg::agg_png,
  width = 16,
  height = 9,
  units = "in",
  dpi = 300
)
Runnable source as JSON, for any HTTP client: https://api.anyplot.ai/specs/renko-basic/ggplot2/code. Any spec id and library id listed in llms-full.txt fit the same URL shape; every URL below is complete and callable.
{
  "spec_id": "renko-basic",
  "language": "r",
  "library": "ggplot2",
  "page": "https://anyplot.ai/renko-basic/r/ggplot2",
  "hub": "https://anyplot.ai/renko-basic",
  "code_json": "https://api.anyplot.ai/specs/renko-basic/ggplot2/code",
  "spec_json": "https://api.anyplot.ai/specs/renko-basic",
  "render_light_png": "https://storage.googleapis.com/anyplot-images/plots/renko-basic/r/ggplot2/plot-light.png",
  "render_dark_png": "https://storage.googleapis.com/anyplot-images/plots/renko-basic/r/ggplot2/plot-dark.png",
  "quality_score": 82.0,
  "license": "MIT",
  "guide": "https://anyplot.ai/llms.txt"
}
Part of Basic Renko Chart on anyplot.ai.