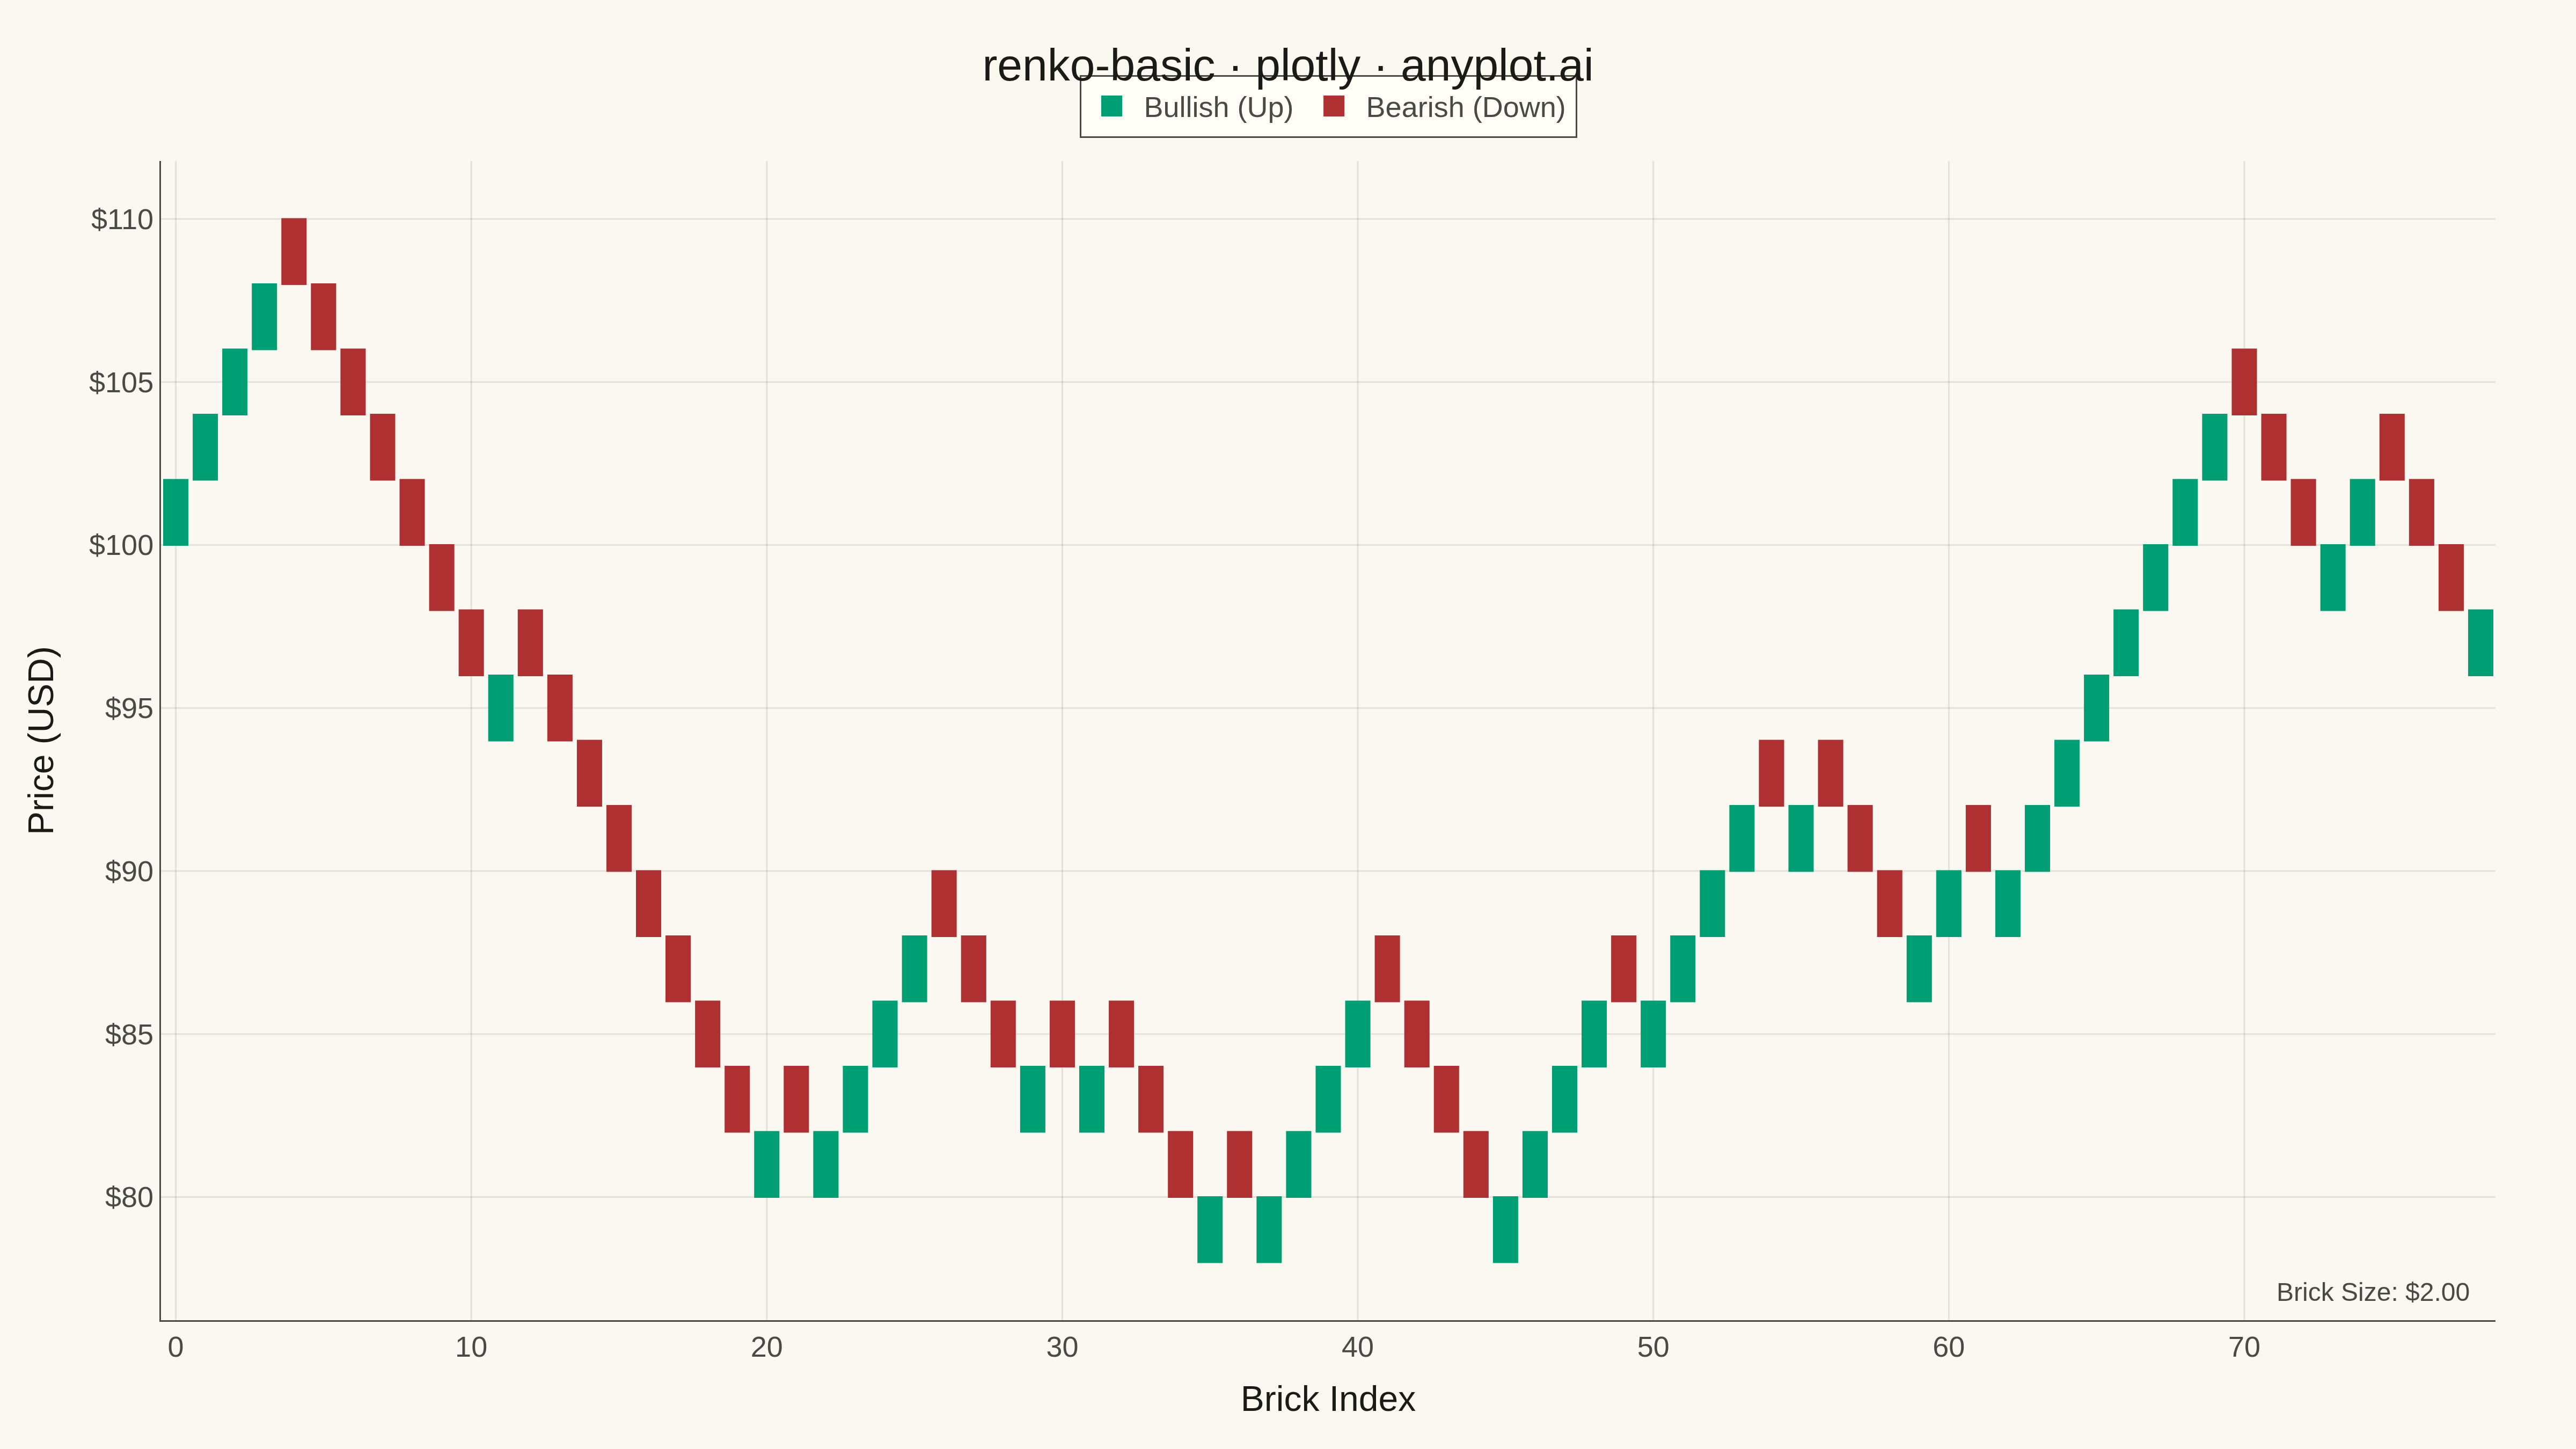
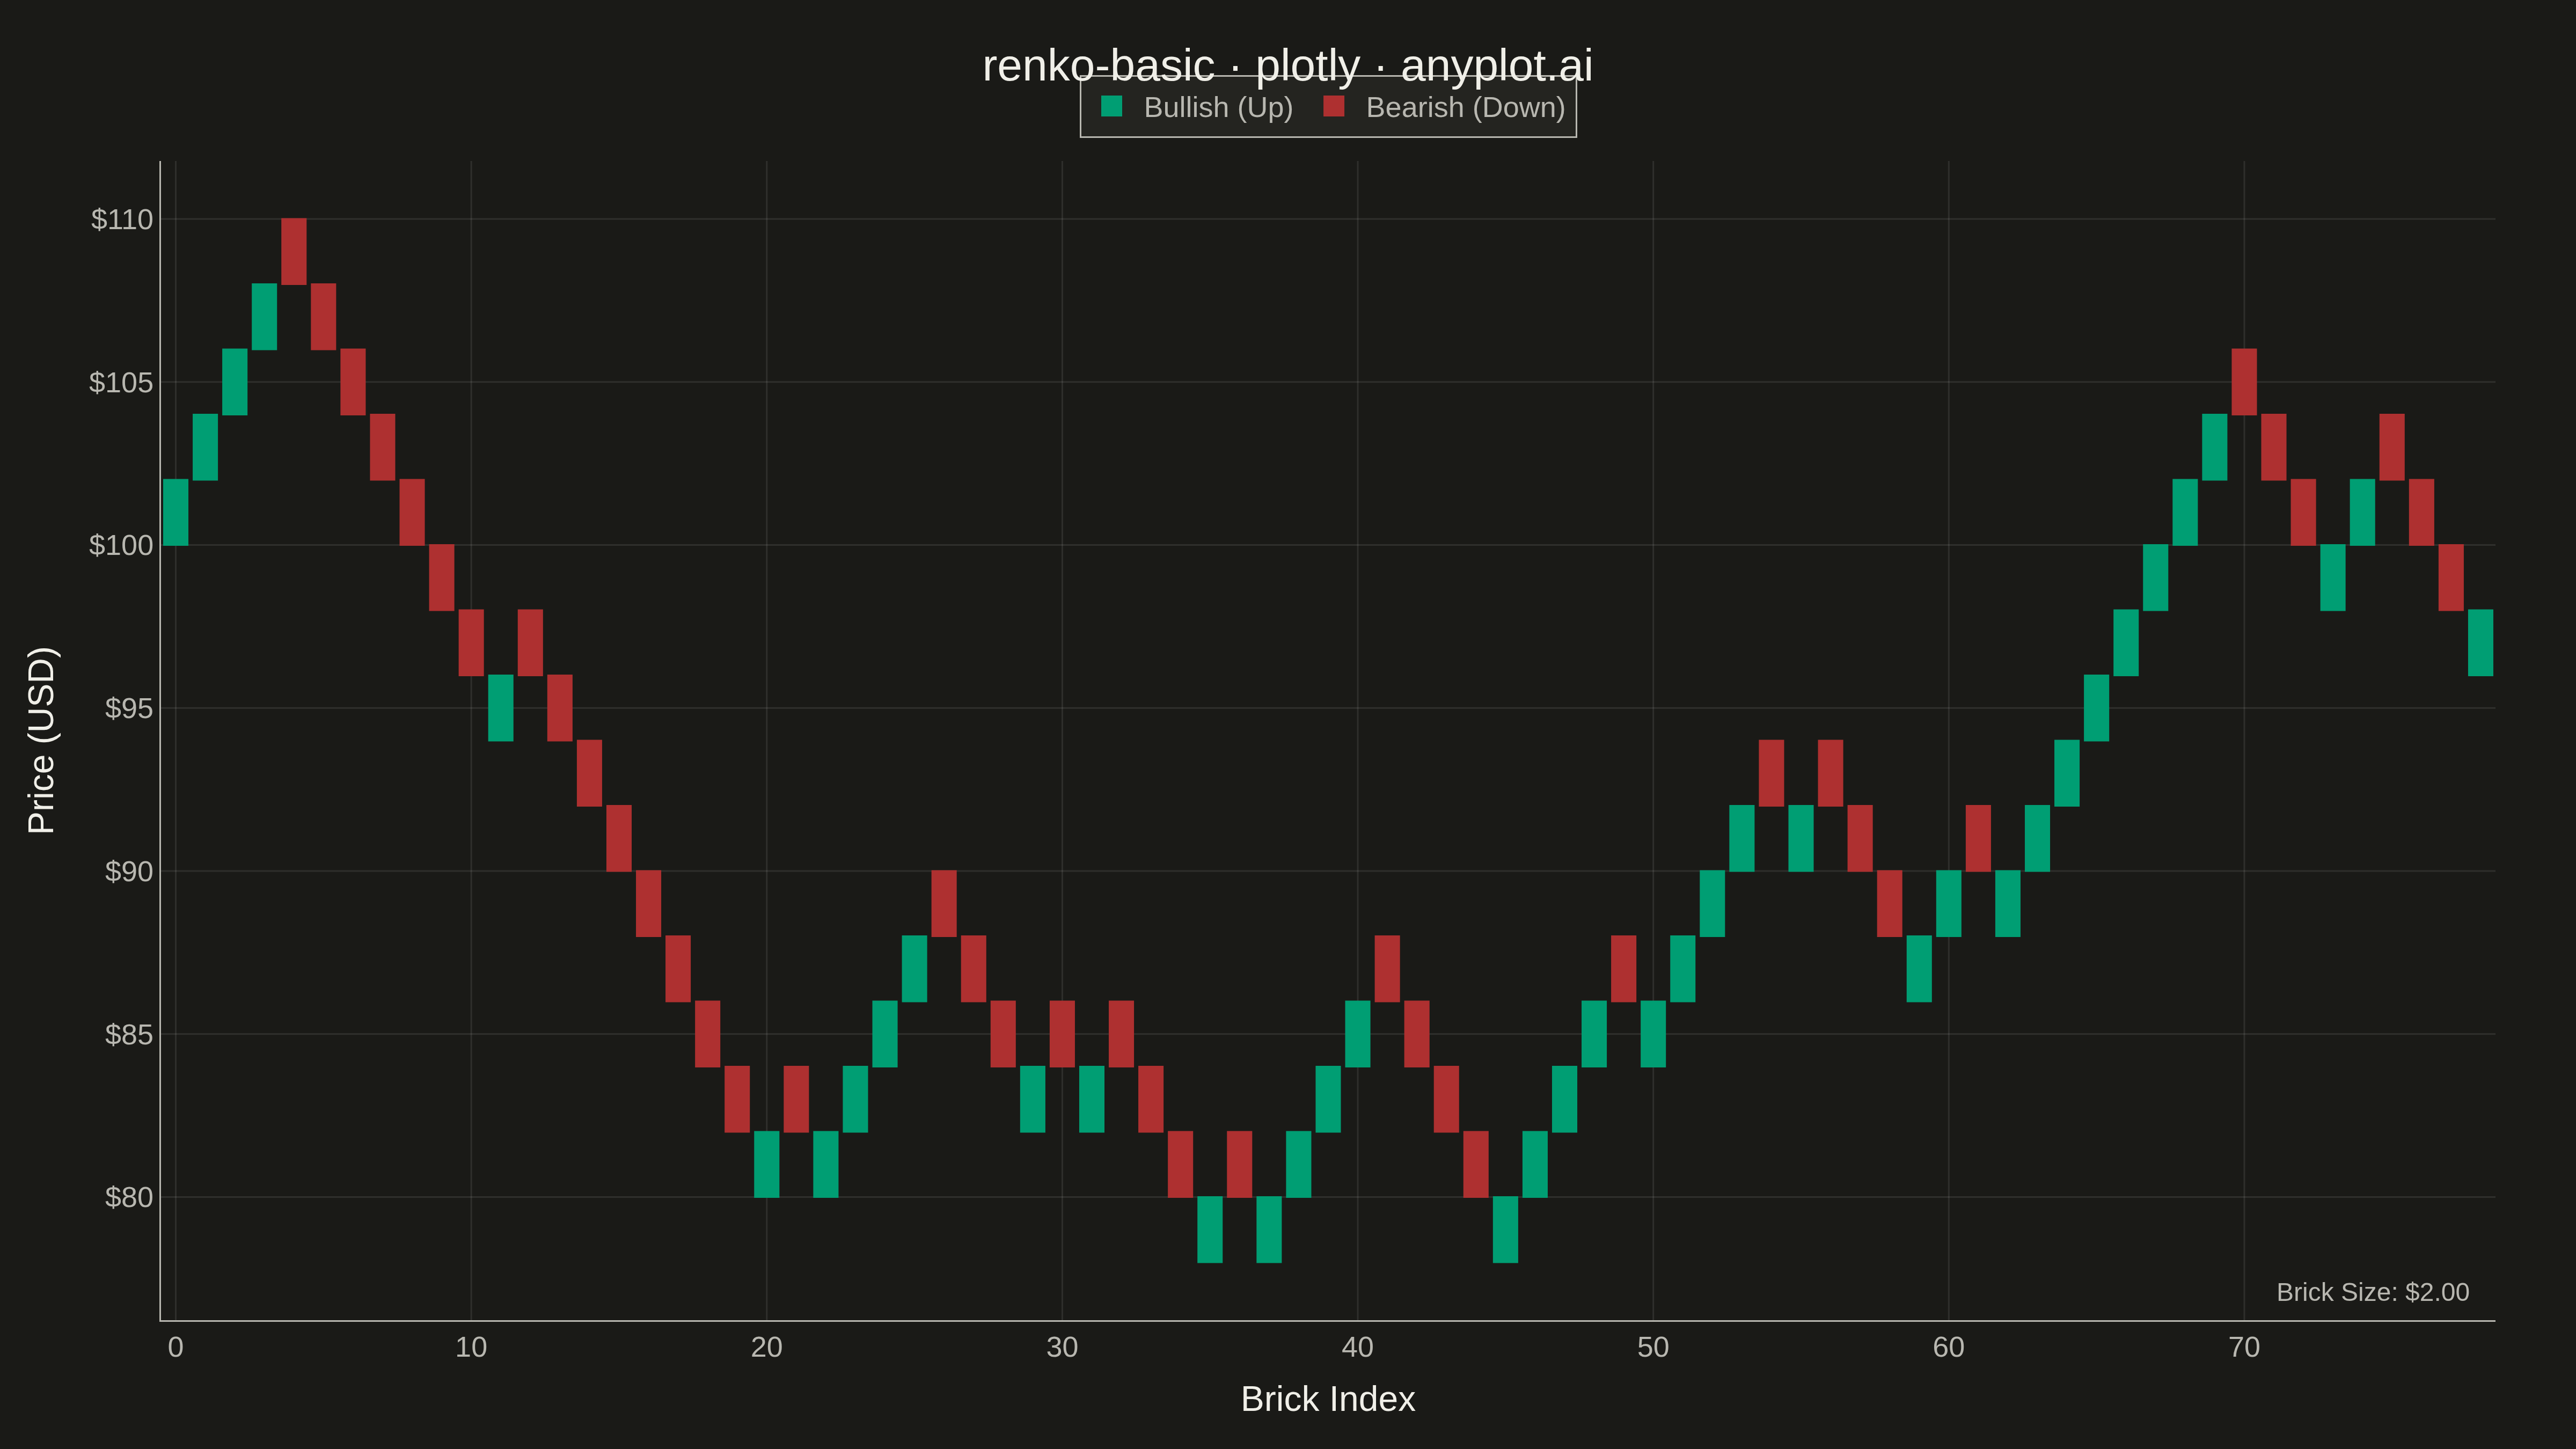
A Renko chart displays price movements using fixed-size bricks that ignore time and focus purely on price action. A new brick is drawn only when the price moves by a specified amount (brick size), filtering out market noise and minor fluctuations. Bullish bricks (price increase) and bearish bricks (price decrease) alternate direction on trend reversals, making it easy to identify trends, support/resistance levels, and potential trading signals.
""" anyplot.ai
renko-basic: Basic Renko Chart
Library: plotly 6.7.0 | Python 3.13.13
Quality: 87/100 | Updated: 2026-05-17
"""

import os
import sys


# Remove script directory from sys.path to avoid shadowing package imports
# When Python runs this script, it adds the script's directory to sys.path[0]
script_dir = os.path.dirname(os.path.abspath(__file__))
if sys.path and (sys.path[0] == script_dir or sys.path[0] == ""):
    sys.path.pop(0)

import numpy as np
import pandas as pd
import plotly.graph_objects as go


# Theme tokens
THEME = os.getenv("ANYPLOT_THEME", "light")
PAGE_BG = "#FAF8F1" if THEME == "light" else "#1A1A17"
ELEVATED_BG = "#FFFDF6" if THEME == "light" else "#242420"
INK = "#1A1A17" if THEME == "light" else "#F0EFE8"
INK_SOFT = "#4A4A44" if THEME == "light" else "#B8B7B0"
GRID = "rgba(26,26,23,0.10)" if THEME == "light" else "rgba(240,239,232,0.10)"

# Okabe-Ito palette
BULLISH = "#009E73"  # Bluish green - position 1 (brand)
BEARISH = "#AE3030"  # imprint red — down bricks

# Data - Generate synthetic stock price data
np.random.seed(42)
n_days = 250
dates = pd.date_range("2025-01-01", periods=n_days, freq="D")
returns = np.random.randn(n_days) * 0.02  # 2% daily volatility
prices = 100 * np.exp(np.cumsum(returns))  # Geometric random walk starting at $100

# Renko brick calculation (inline for KISS)
brick_size = 2.0
bricks = []
current_price = prices[0]
base_price = round(current_price / brick_size) * brick_size

for price in prices[1:]:
    diff = price - base_price
    num_bricks = int(abs(diff) // brick_size)

    if num_bricks >= 1:
        direction = 1 if diff > 0 else -1
        for _ in range(num_bricks):
            brick_open = base_price
            brick_close = base_price + direction * brick_size
            bricks.append({"open": brick_open, "close": brick_close, "direction": "up" if direction > 0 else "down"})
            base_price = brick_close

# Create figure
fig = go.Figure()

# Add bricks
for i, brick in enumerate(bricks):
    is_up = brick["direction"] == "up"
    color = BULLISH if is_up else BEARISH
    label = "Bullish (Up)" if is_up else "Bearish (Down)"

    fig.add_trace(
        go.Bar(
            x=[i],
            y=[brick_size],
            base=brick["open"],
            marker=dict(color=color, line=dict(color=color, width=1)),
            width=0.8,
            name=label,
            legendgroup=label,
            showlegend=False,
            hovertemplate=(
                f"Brick {i + 1}<br>"
                f"Open: ${brick['open']:.2f}<br>"
                f"Close: ${brick['close']:.2f}<br>"
                f"Type: {label}<extra></extra>"
            ),
        )
    )

# Show legend only for first occurrence of each group
legends_shown = set()
for trace in fig.data:
    if trace.legendgroup and trace.legendgroup not in legends_shown:
        trace.showlegend = True
        legends_shown.add(trace.legendgroup)

# Update layout with theme-adaptive styling
fig.update_layout(
    title=dict(text="renko-basic · plotly · anyplot.ai", font=dict(size=28, color=INK), x=0.5, xanchor="center"),
    xaxis=dict(
        title=dict(text="Brick Index", font=dict(size=22, color=INK)),
        tickfont=dict(size=18, color=INK_SOFT),
        showgrid=True,
        gridwidth=1,
        gridcolor=GRID,
        zeroline=False,
        linecolor=INK_SOFT,
    ),
    yaxis=dict(
        title=dict(text="Price (USD)", font=dict(size=22, color=INK)),
        tickfont=dict(size=18, color=INK_SOFT),
        tickformat="$.0f",
        showgrid=True,
        gridwidth=1,
        gridcolor=GRID,
        zeroline=False,
        linecolor=INK_SOFT,
    ),
    plot_bgcolor=PAGE_BG,
    paper_bgcolor=PAGE_BG,
    font=dict(color=INK),
    legend=dict(
        font=dict(size=18, color=INK_SOFT),
        bgcolor=ELEVATED_BG,
        bordercolor=INK_SOFT,
        borderwidth=1,
        orientation="h",
        yanchor="bottom",
        y=1.02,
        xanchor="center",
        x=0.5,
    ),
    bargap=0.15,
    margin=dict(l=100, r=50, t=100, b=80),
)

# Add annotation for brick size
fig.add_annotation(
    text=f"Brick Size: ${brick_size:.2f}",
    xref="paper",
    yref="paper",
    x=0.99,
    y=0.01,
    xanchor="right",
    yanchor="bottom",
    font=dict(size=16, color=INK_SOFT),
    showarrow=False,
)

# Save as PNG and HTML
fig.write_image(f"plot-{THEME}.png", width=1600, height=900, scale=3)
fig.write_html(f"plot-{THEME}.html", include_plotlyjs="cdn")
Runnable source as JSON, for any HTTP client: https://api.anyplot.ai/specs/renko-basic/plotly/code. Any spec id and library id listed in llms-full.txt fit the same URL shape; every URL below is complete and callable.
{
  "spec_id": "renko-basic",
  "language": "python",
  "library": "plotly",
  "page": "https://anyplot.ai/renko-basic/python/plotly",
  "hub": "https://anyplot.ai/renko-basic",
  "code_json": "https://api.anyplot.ai/specs/renko-basic/plotly/code",
  "spec_json": "https://api.anyplot.ai/specs/renko-basic",
  "render_light_png": "https://storage.googleapis.com/anyplot-images/plots/renko-basic/python/plotly/plot-light.png",
  "render_dark_png": "https://storage.googleapis.com/anyplot-images/plots/renko-basic/python/plotly/plot-dark.png",
  "interactive_light_html": "https://storage.googleapis.com/anyplot-images/plots/renko-basic/python/plotly/plot-light.html",
  "interactive_dark_html": "https://storage.googleapis.com/anyplot-images/plots/renko-basic/python/plotly/plot-dark.html",
  "quality_score": 87.0,
  "license": "MIT",
  "guide": "https://anyplot.ai/llms.txt"
}
Part of Basic Renko Chart on anyplot.ai.