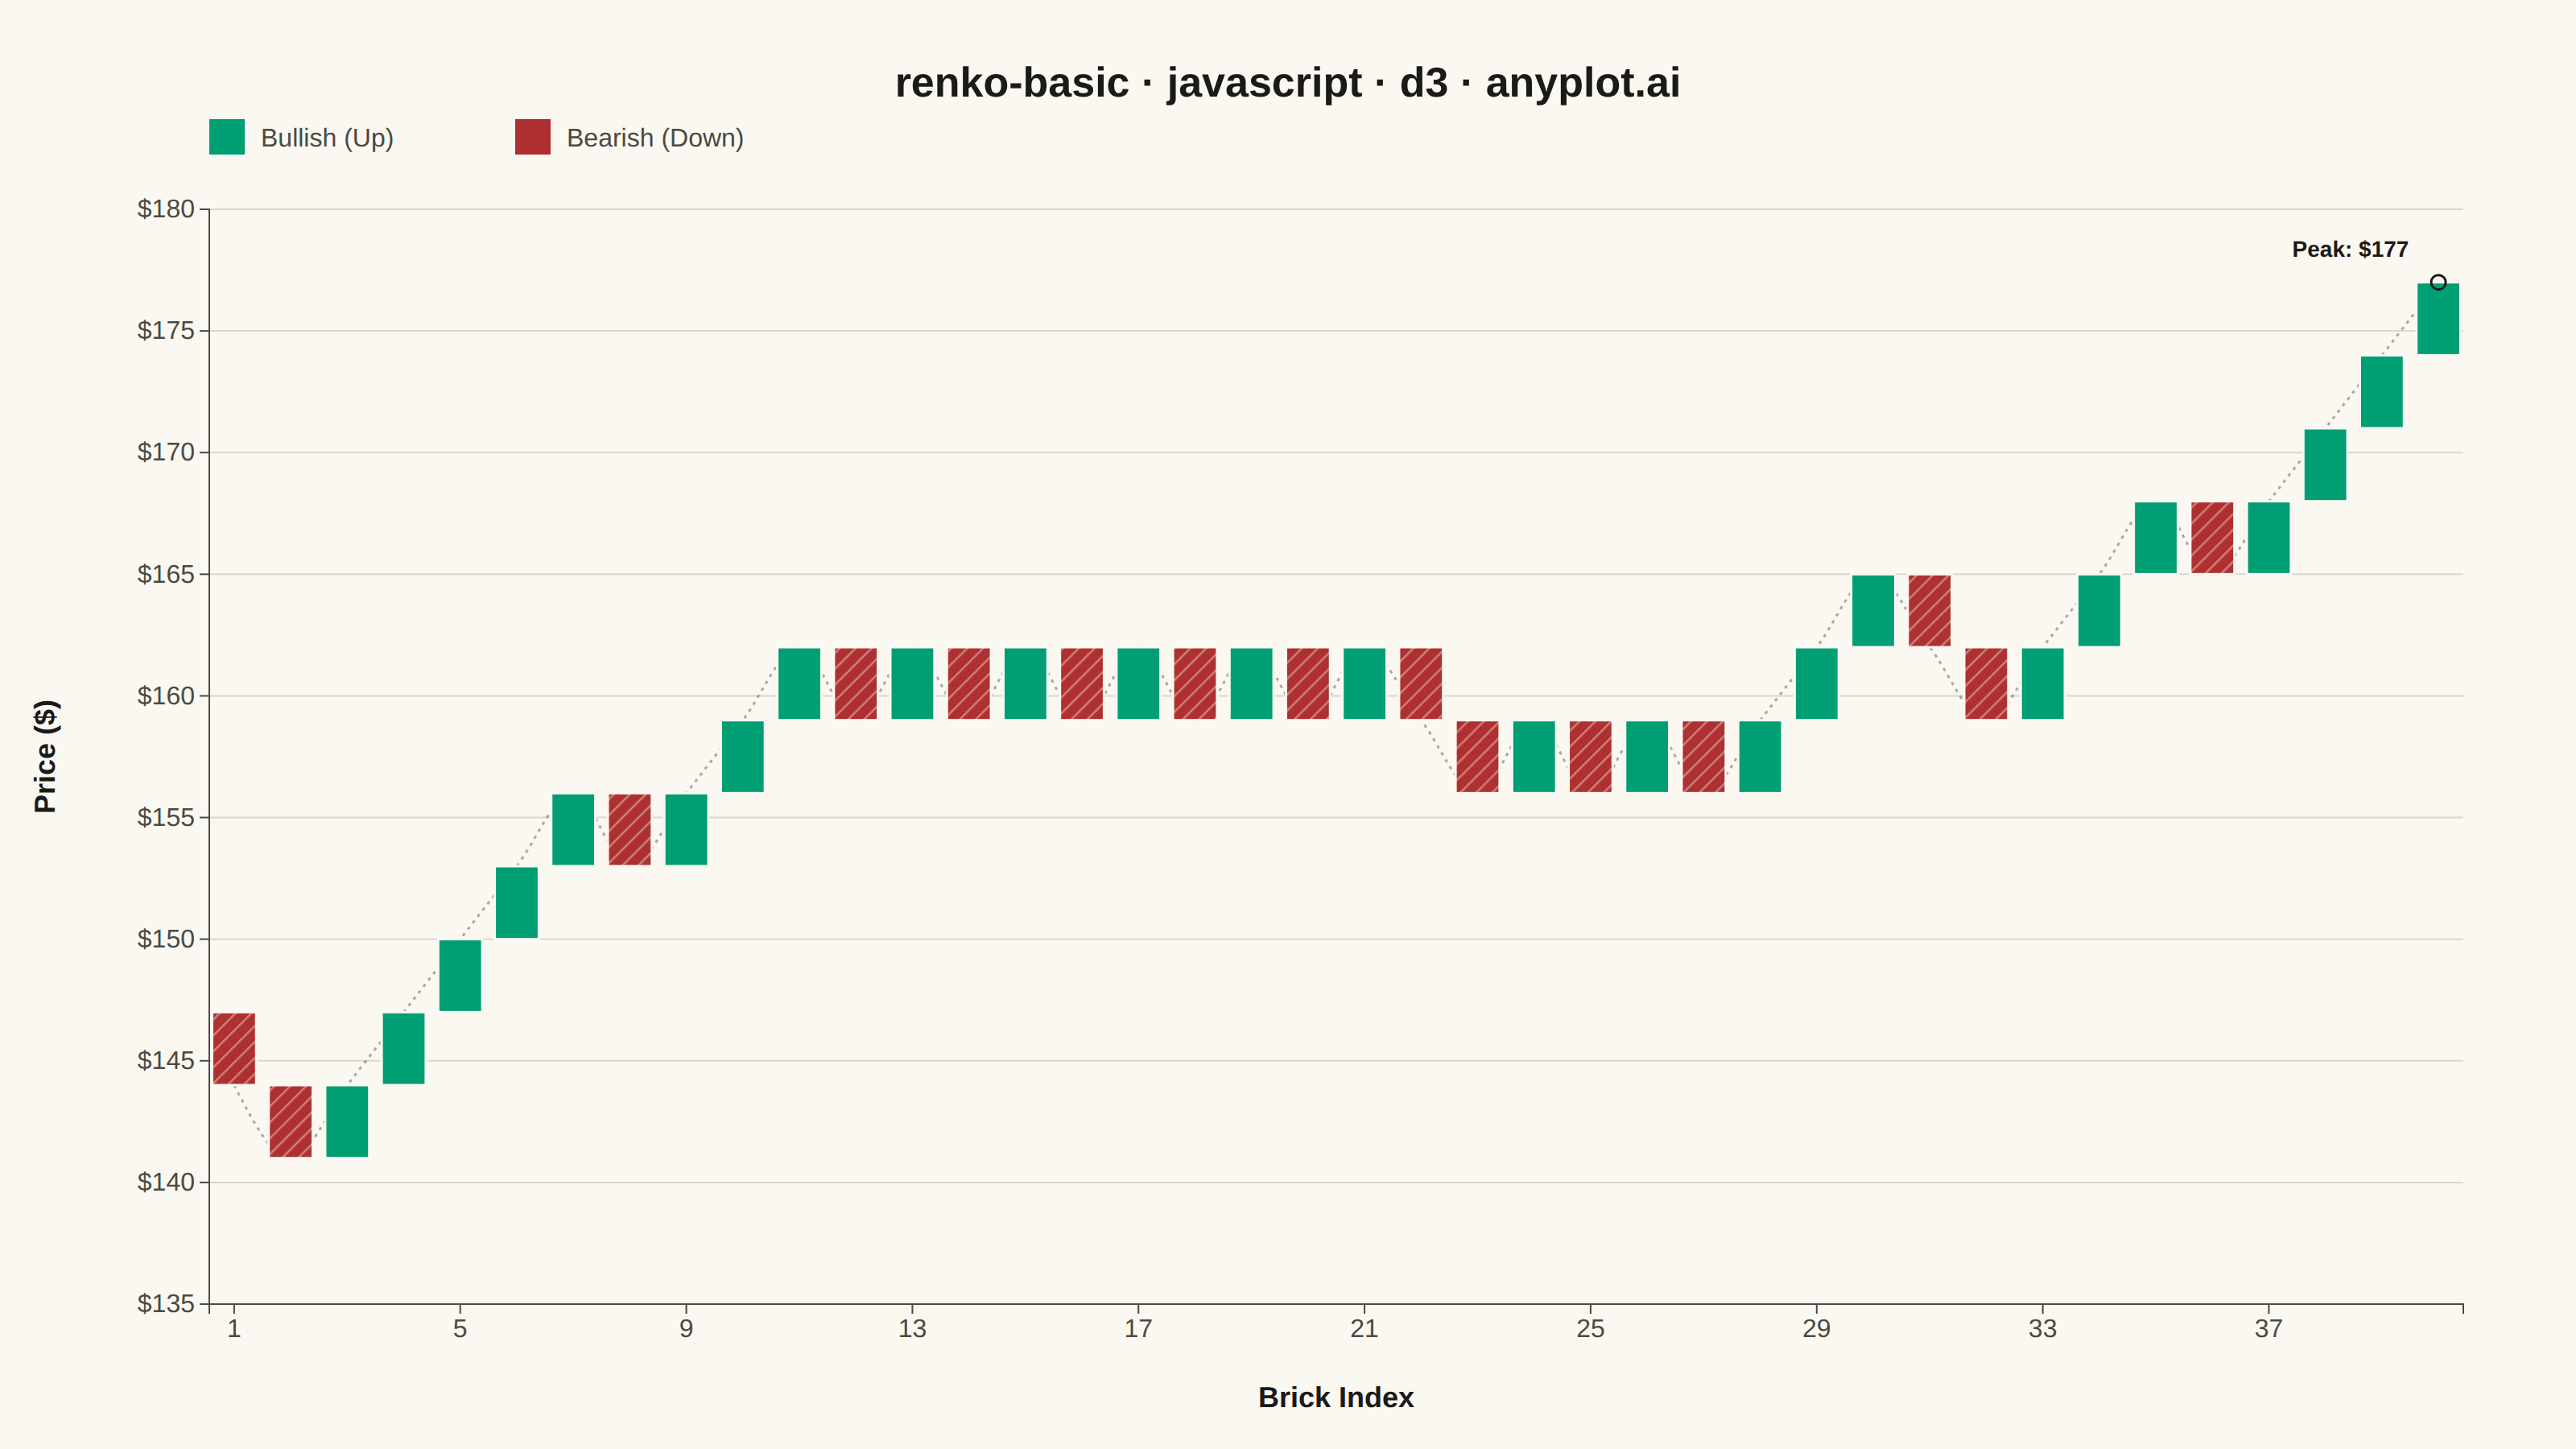
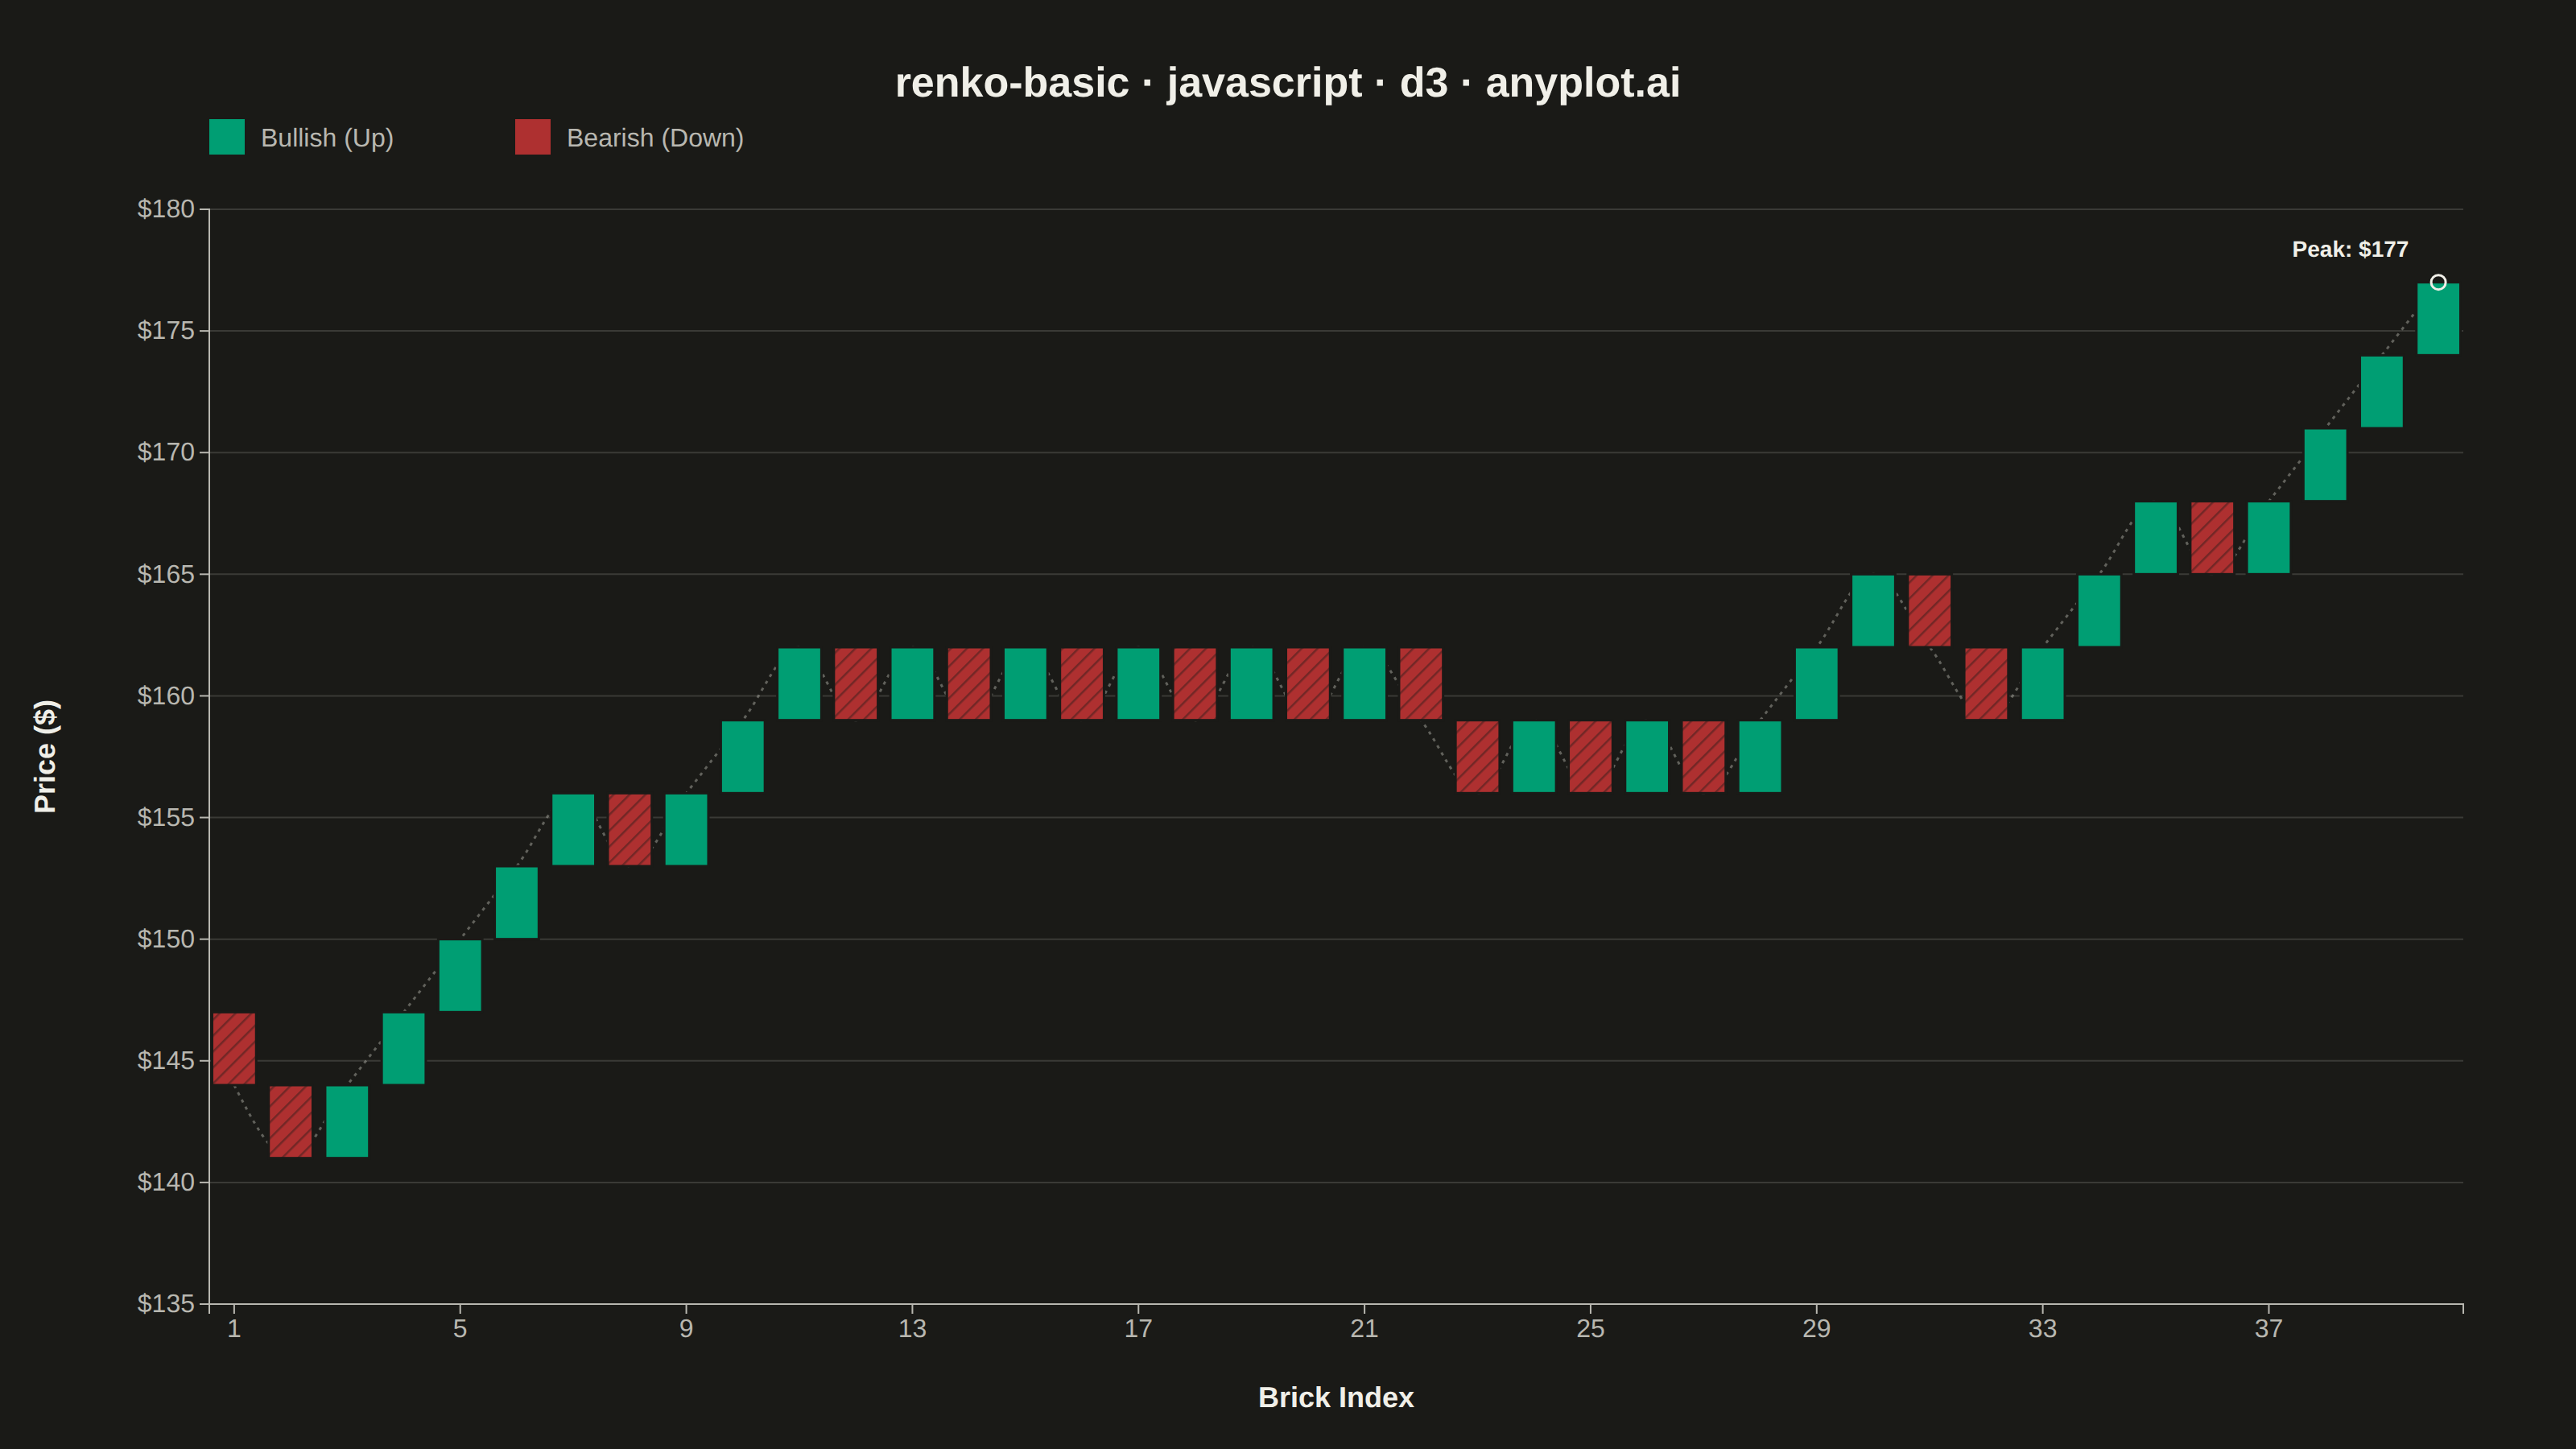
The same plot in 14 other libraries — JavaScript: Chart.js, Apache ECharts, Highcharts, MUI X Charts; Python: Altair, Bokeh, lets-plot, Matplotlib, Plotly, plotnine, Pygal, Seaborn; R: ggplot2; Julia: Makie.jl. Compare all 15 side by side: Basic Renko Chart in Python, R, Julia and JavaScript.
A Renko chart displays price movements using fixed-size bricks that ignore time and focus purely on price action. A new brick is drawn only when the price moves by a specified amount (brick size), filtering out market noise and minor fluctuations. Bullish bricks (price increase) and bearish bricks (price decrease) alternate direction on trend reversals, making it easy to identify trends, support/resistance levels, and potential trading signals.
// anyplot.ai
// renko-basic: Basic Renko Chart
// Library: d3 7.9.0 | JavaScript 22.23.2
// Quality: 95/100 | Created: 2026-09-02

//# anyplot-orientation: landscape
const t = window.ANYPLOT_TOKENS;
const { width, height } = window.ANYPLOT_SIZE;
const margin = { top: 130, right: 70, bottom: 90, left: 130 };
const iw = width - margin.left - margin.right;
const ih = height - margin.top - margin.bottom;

// --- Data: deterministic daily-close random walk (in-memory, LCG PRNG) ------
function lcg(seed) {
  let state = seed >>> 0;
  return () => {
    state = (state * 1664525 + 1013904223) >>> 0;
    return state / 4294967296;
  };
}
const rand = lcg(42);

// Four phases (uptrend, consolidation, downtrend, recovery) so the resulting
// bricks trace a clear trend story, matching the spec's "identify trend
// directions" application.
const N_OBSERVATIONS = 220;
const BRICK_SIZE = 3; // $ price move required to draw a new brick
const phases = [
  { end: 60, drift: 0.18 },
  { end: 100, drift: 0.0 },
  { end: 165, drift: -0.16 },
  { end: N_OBSERVATIONS, drift: 0.22 },
];
const closes = [148];
for (let i = 1; i < N_OBSERVATIONS; i++) {
  const drift = phases.find((p) => i < p.end).drift;
  const noise = (rand() - 0.5) * 4.5;
  closes.push(Math.max(60, closes[i - 1] + drift + noise));
}

// --- Renko brick construction ------------------------------------------------
// A new brick is emitted every time the close crosses a full BRICK_SIZE step
// away from the last brick boundary, in either direction — this is what lets
// a run of up bricks reverse into a run of down bricks (trend reversal).
const bricks = [];
let base = Math.round(closes[0] / BRICK_SIZE) * BRICK_SIZE;
for (let i = 1; i < closes.length; i++) {
  let diff = closes[i] - base;
  while (diff >= BRICK_SIZE) {
    const open = base;
    base += BRICK_SIZE;
    diff -= BRICK_SIZE;
    bricks.push({ open, close: base, up: true });
  }
  while (diff <= -BRICK_SIZE) {
    const open = base;
    base -= BRICK_SIZE;
    diff += BRICK_SIZE;
    bricks.push({ open, close: base, up: false });
  }
}

// --- SVG mount ---------------------------------------------------------------
const svg = d3.select("#container").append("svg").attr("width", width).attr("height", height);
const g = svg.append("g").attr("transform", `translate(${margin.left},${margin.top})`);

// Diagonal hatch pattern: a redundant non-color cue for bearish bricks so
// direction reads correctly for colorblind viewers, not solely via hue.
svg
  .append("defs")
  .append("pattern")
  .attr("id", "bearish-hatch")
  .attr("width", 7)
  .attr("height", 7)
  .attr("patternUnits", "userSpaceOnUse")
  .attr("patternTransform", "rotate(45)")
  .append("line")
  .attr("x1", 0)
  .attr("y1", 0)
  .attr("x2", 0)
  .attr("y2", 7)
  .attr("stroke", t.pageBg)
  .attr("stroke-width", 2.5)
  .attr("stroke-opacity", 0.4);

// --- Scales -------------------------------------------------------------------
const x = d3
  .scaleBand()
  .domain(d3.range(bricks.length))
  .range([0, iw])
  .paddingInner(0.22)
  .paddingOuter(0.05);
const levels = bricks.flatMap((b) => [b.open, b.close]);
const y = d3
  .scaleLinear()
  .domain([d3.min(levels) - BRICK_SIZE, d3.max(levels) + BRICK_SIZE])
  .nice()
  .range([ih, 0]);

// --- Gridlines (y-axis only, subtle) -------------------------------------------
g.append("g")
  .call(d3.axisLeft(y).tickSize(-iw).tickFormat(""))
  .call((sel) => sel.select(".domain").remove())
  .selectAll("line")
  .attr("stroke", t.grid)
  .attr("stroke-width", 1);

// --- Close-price trace (d3-shape line generator through brick midpoints) ----
// A distinctive d3-shape touch beyond the manual rect join: a dashed line
// tracing each brick's closing level, drawn beneath the bricks so it only
// peeks through the small inter-brick gaps — reinforcing the underlying price
// path without competing visually with the brick fills.
const closeTrace = d3
  .line()
  .x((d, i) => x(i) + x.bandwidth() / 2)
  .y((d) => y(d.close))
  .curve(d3.curveMonotoneX);
g.append("path")
  .datum(bricks)
  .attr("d", closeTrace)
  .attr("fill", "none")
  .attr("stroke", t.inkSoft)
  .attr("stroke-width", 1.5)
  .attr("stroke-opacity", 0.45)
  .attr("stroke-dasharray", "2,3");

// --- Bricks ---------------------------------------------------------------
// Bullish (up) -> Imprint brand green; Bearish (down) -> Imprint matte red —
// the semantic finance exception (profit/up -> green, loss/down -> red),
// labeled explicitly in the legend below.
g.selectAll("rect.brick")
  .data(bricks)
  .join("rect")
  .attr("class", "brick")
  .attr("x", (d, i) => x(i))
  .attr("width", x.bandwidth())
  .attr("y", (d) => y(Math.max(d.open, d.close)))
  .attr("height", (d) => Math.abs(y(d.close) - y(d.open)))
  .attr("fill", (d) => (d.up ? t.palette[0] : t.palette[4]))
  .attr("stroke", t.pageBg)
  .attr("stroke-width", 1.5);

// Hatch overlay on bearish bricks only — the redundant non-color direction cue.
g.selectAll("rect.brick-hatch")
  .data(bricks.map((d, i) => ({ ...d, i })).filter((d) => !d.up))
  .join("rect")
  .attr("class", "brick-hatch")
  .attr("x", (d) => x(d.i))
  .attr("width", x.bandwidth())
  .attr("y", (d) => y(Math.max(d.open, d.close)))
  .attr("height", (d) => Math.abs(y(d.close) - y(d.open)))
  .attr("fill", "url(#bearish-hatch)")
  .attr("pointer-events", "none");

// --- Peak callout: mark the series' single highest brick (data storytelling) ---
let peakIdx = 0;
let peakPrice = -Infinity;
bricks.forEach((d, i) => {
  const top = Math.max(d.open, d.close);
  if (top > peakPrice) {
    peakPrice = top;
    peakIdx = i;
  }
});
const peakX = x(peakIdx) + x.bandwidth() / 2;
const peakY = y(peakPrice);
g.append("circle")
  .attr("cx", peakX)
  .attr("cy", peakY)
  .attr("r", 4.5)
  .attr("fill", "none")
  .attr("stroke", t.ink)
  .attr("stroke-width", 1.5);
const peakLabelAbove = peakY - 16 >= 10;
g.append("text")
  .attr("x", Math.min(Math.max(peakX, 70), iw - 70))
  .attr("y", peakLabelAbove ? peakY - 16 : peakY + 24)
  .attr("text-anchor", "middle")
  .attr("fill", t.ink)
  .style("font-size", "14px")
  .style("font-weight", "600")
  .text(`Peak: $${peakPrice.toFixed(0)}`);

// --- Axes -----------------------------------------------------------------
const tickEvery = Math.max(1, Math.ceil(bricks.length / 12));
const xTickValues = d3.range(bricks.length).filter((i) => i % tickEvery === 0);
const xAxis = g
  .append("g")
  .attr("transform", `translate(0,${ih})`)
  .call(d3.axisBottom(x).tickValues(xTickValues).tickFormat((i) => i + 1));
const yAxis = g.append("g").call(d3.axisLeft(y).tickFormat(d3.format("$,.0f")));
for (const ax of [xAxis, yAxis]) {
  ax.selectAll("text").attr("fill", t.inkSoft).style("font-size", "16px").style("font-weight", "400");
  ax.selectAll("line").attr("stroke", t.inkSoft);
  ax.select(".domain").attr("stroke", t.inkSoft);
}

// --- Axis labels (bolder weight than tick labels for typographic hierarchy) --
g.append("text")
  .attr("x", iw / 2)
  .attr("y", ih + 64)
  .attr("text-anchor", "middle")
  .attr("fill", t.ink)
  .style("font-size", "18px")
  .style("font-weight", "600")
  .text("Brick Index");
g.append("text")
  .attr("transform", "rotate(-90)")
  .attr("x", -ih / 2)
  .attr("y", -96)
  .attr("text-anchor", "middle")
  .attr("fill", t.ink)
  .style("font-size", "18px")
  .style("font-weight", "600")
  .text("Price ($)");

// --- Legend (semantic color mapping must be explicit) ------------------------
const legend = svg.append("g").attr("transform", `translate(${margin.left},${margin.top - 56})`);
const legendItems = [
  { label: "Bullish (Up)", color: t.palette[0] },
  { label: "Bearish (Down)", color: t.palette[4] },
];
legendItems.forEach((item, i) => {
  const item_g = legend.append("g").attr("transform", `translate(${i * 190},0)`);
  item_g.append("rect").attr("width", 22).attr("height", 22).attr("fill", item.color);
  item_g
    .append("text")
    .attr("x", 32)
    .attr("y", 17)
    .attr("fill", t.inkSoft)
    .style("font-size", "16px")
    .text(item.label);
});

// --- Title --------------------------------------------------------------
svg
  .append("text")
  .attr("x", width / 2)
  .attr("y", 60)
  .attr("text-anchor", "middle")
  .attr("fill", t.ink)
  .style("font-size", "26px")
  .style("font-weight", "600")
  .text("renko-basic · javascript · d3 · anyplot.ai");
Runnable source as JSON, for any HTTP client: https://api.anyplot.ai/specs/renko-basic/d3/code. Any spec id and library id listed in llms-full.txt fit the same URL shape; every URL below is complete and callable.
{
  "spec_id": "renko-basic",
  "language": "javascript",
  "library": "d3",
  "page": "https://anyplot.ai/renko-basic/javascript/d3",
  "hub": "https://anyplot.ai/renko-basic",
  "code_json": "https://api.anyplot.ai/specs/renko-basic/d3/code",
  "spec_json": "https://api.anyplot.ai/specs/renko-basic",
  "render_light_png": "https://storage.googleapis.com/anyplot-images/plots/renko-basic/javascript/d3/plot-light.png",
  "render_dark_png": "https://storage.googleapis.com/anyplot-images/plots/renko-basic/javascript/d3/plot-dark.png",
  "interactive_light_html": "https://storage.googleapis.com/anyplot-images/plots/renko-basic/javascript/d3/plot-light.html",
  "interactive_dark_html": "https://storage.googleapis.com/anyplot-images/plots/renko-basic/javascript/d3/plot-dark.html",
  "quality_score": 95.0,
  "license": "MIT",
  "guide": "https://anyplot.ai/llms.txt"
}
Part of Basic Renko Chart on anyplot.ai.