The same plot in 14 other libraries — JavaScript: Chart.js, D3.js, Apache ECharts, MUI X Charts; Python: Altair, Bokeh, lets-plot, Matplotlib, Plotly, plotnine, Pygal, Seaborn; R: ggplot2; Julia: Makie.jl. Compare all 15 side by side: Basic Renko Chart in Python, R, Julia and JavaScript.
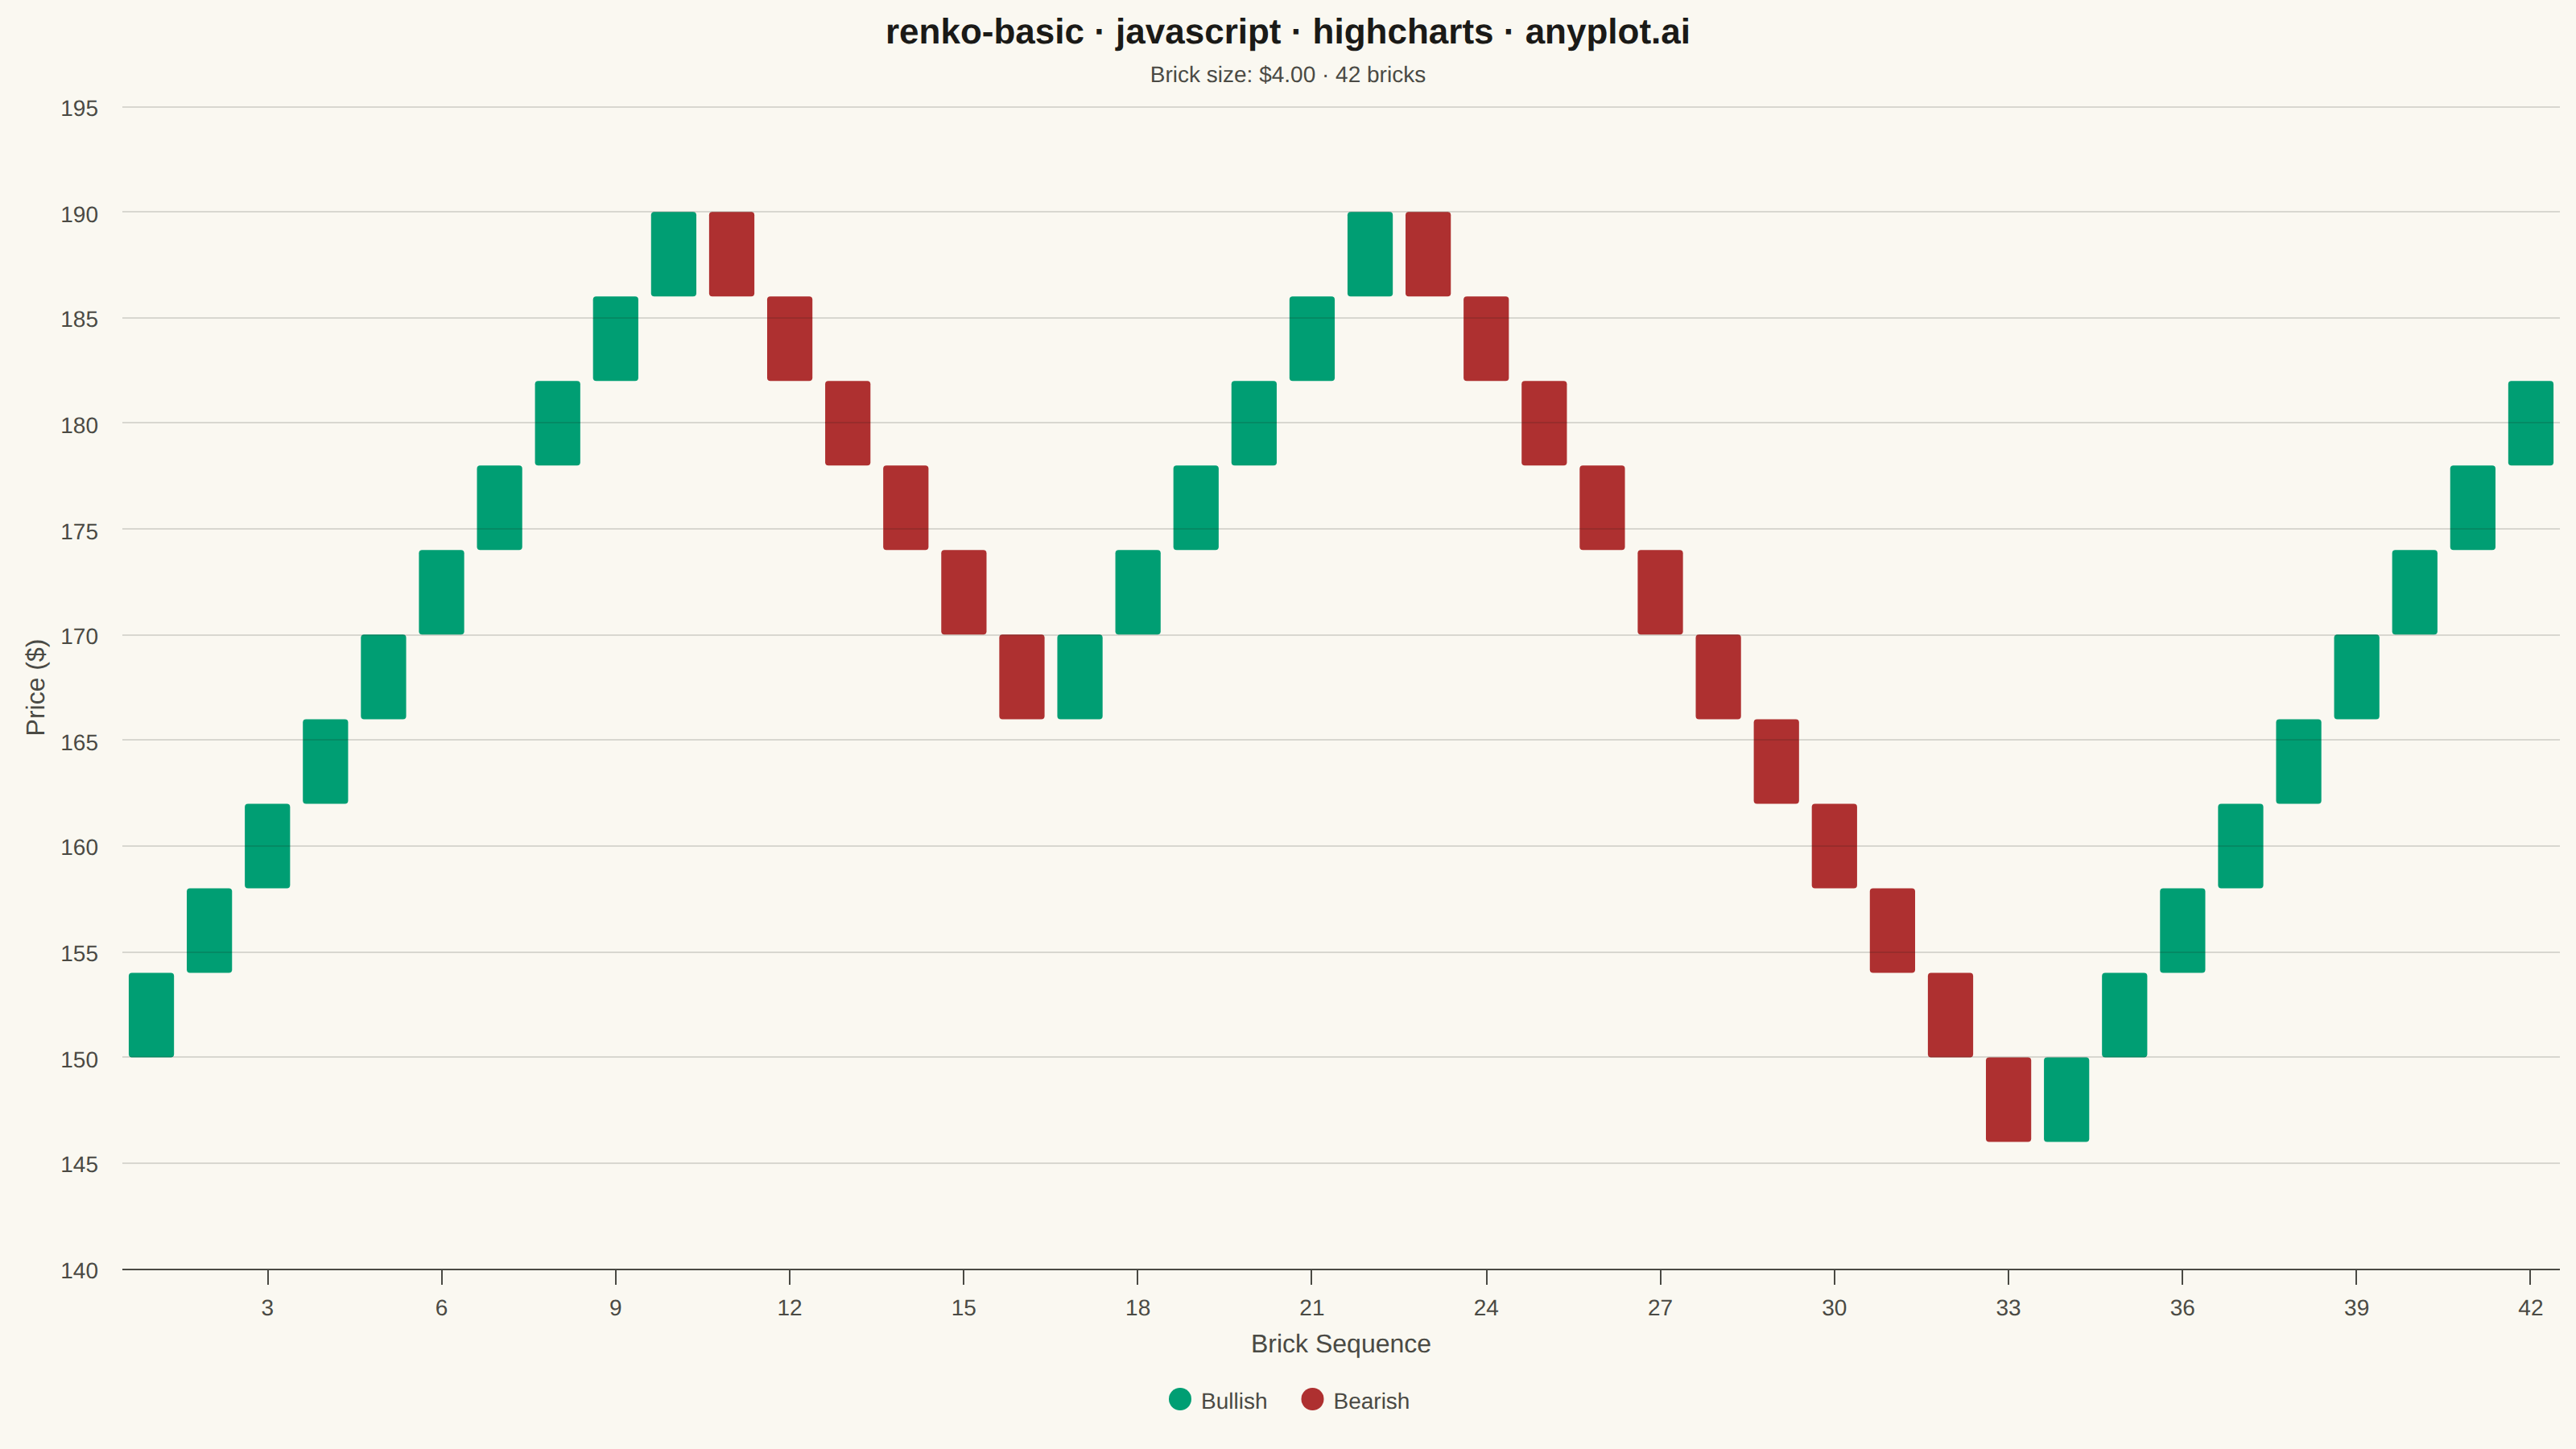
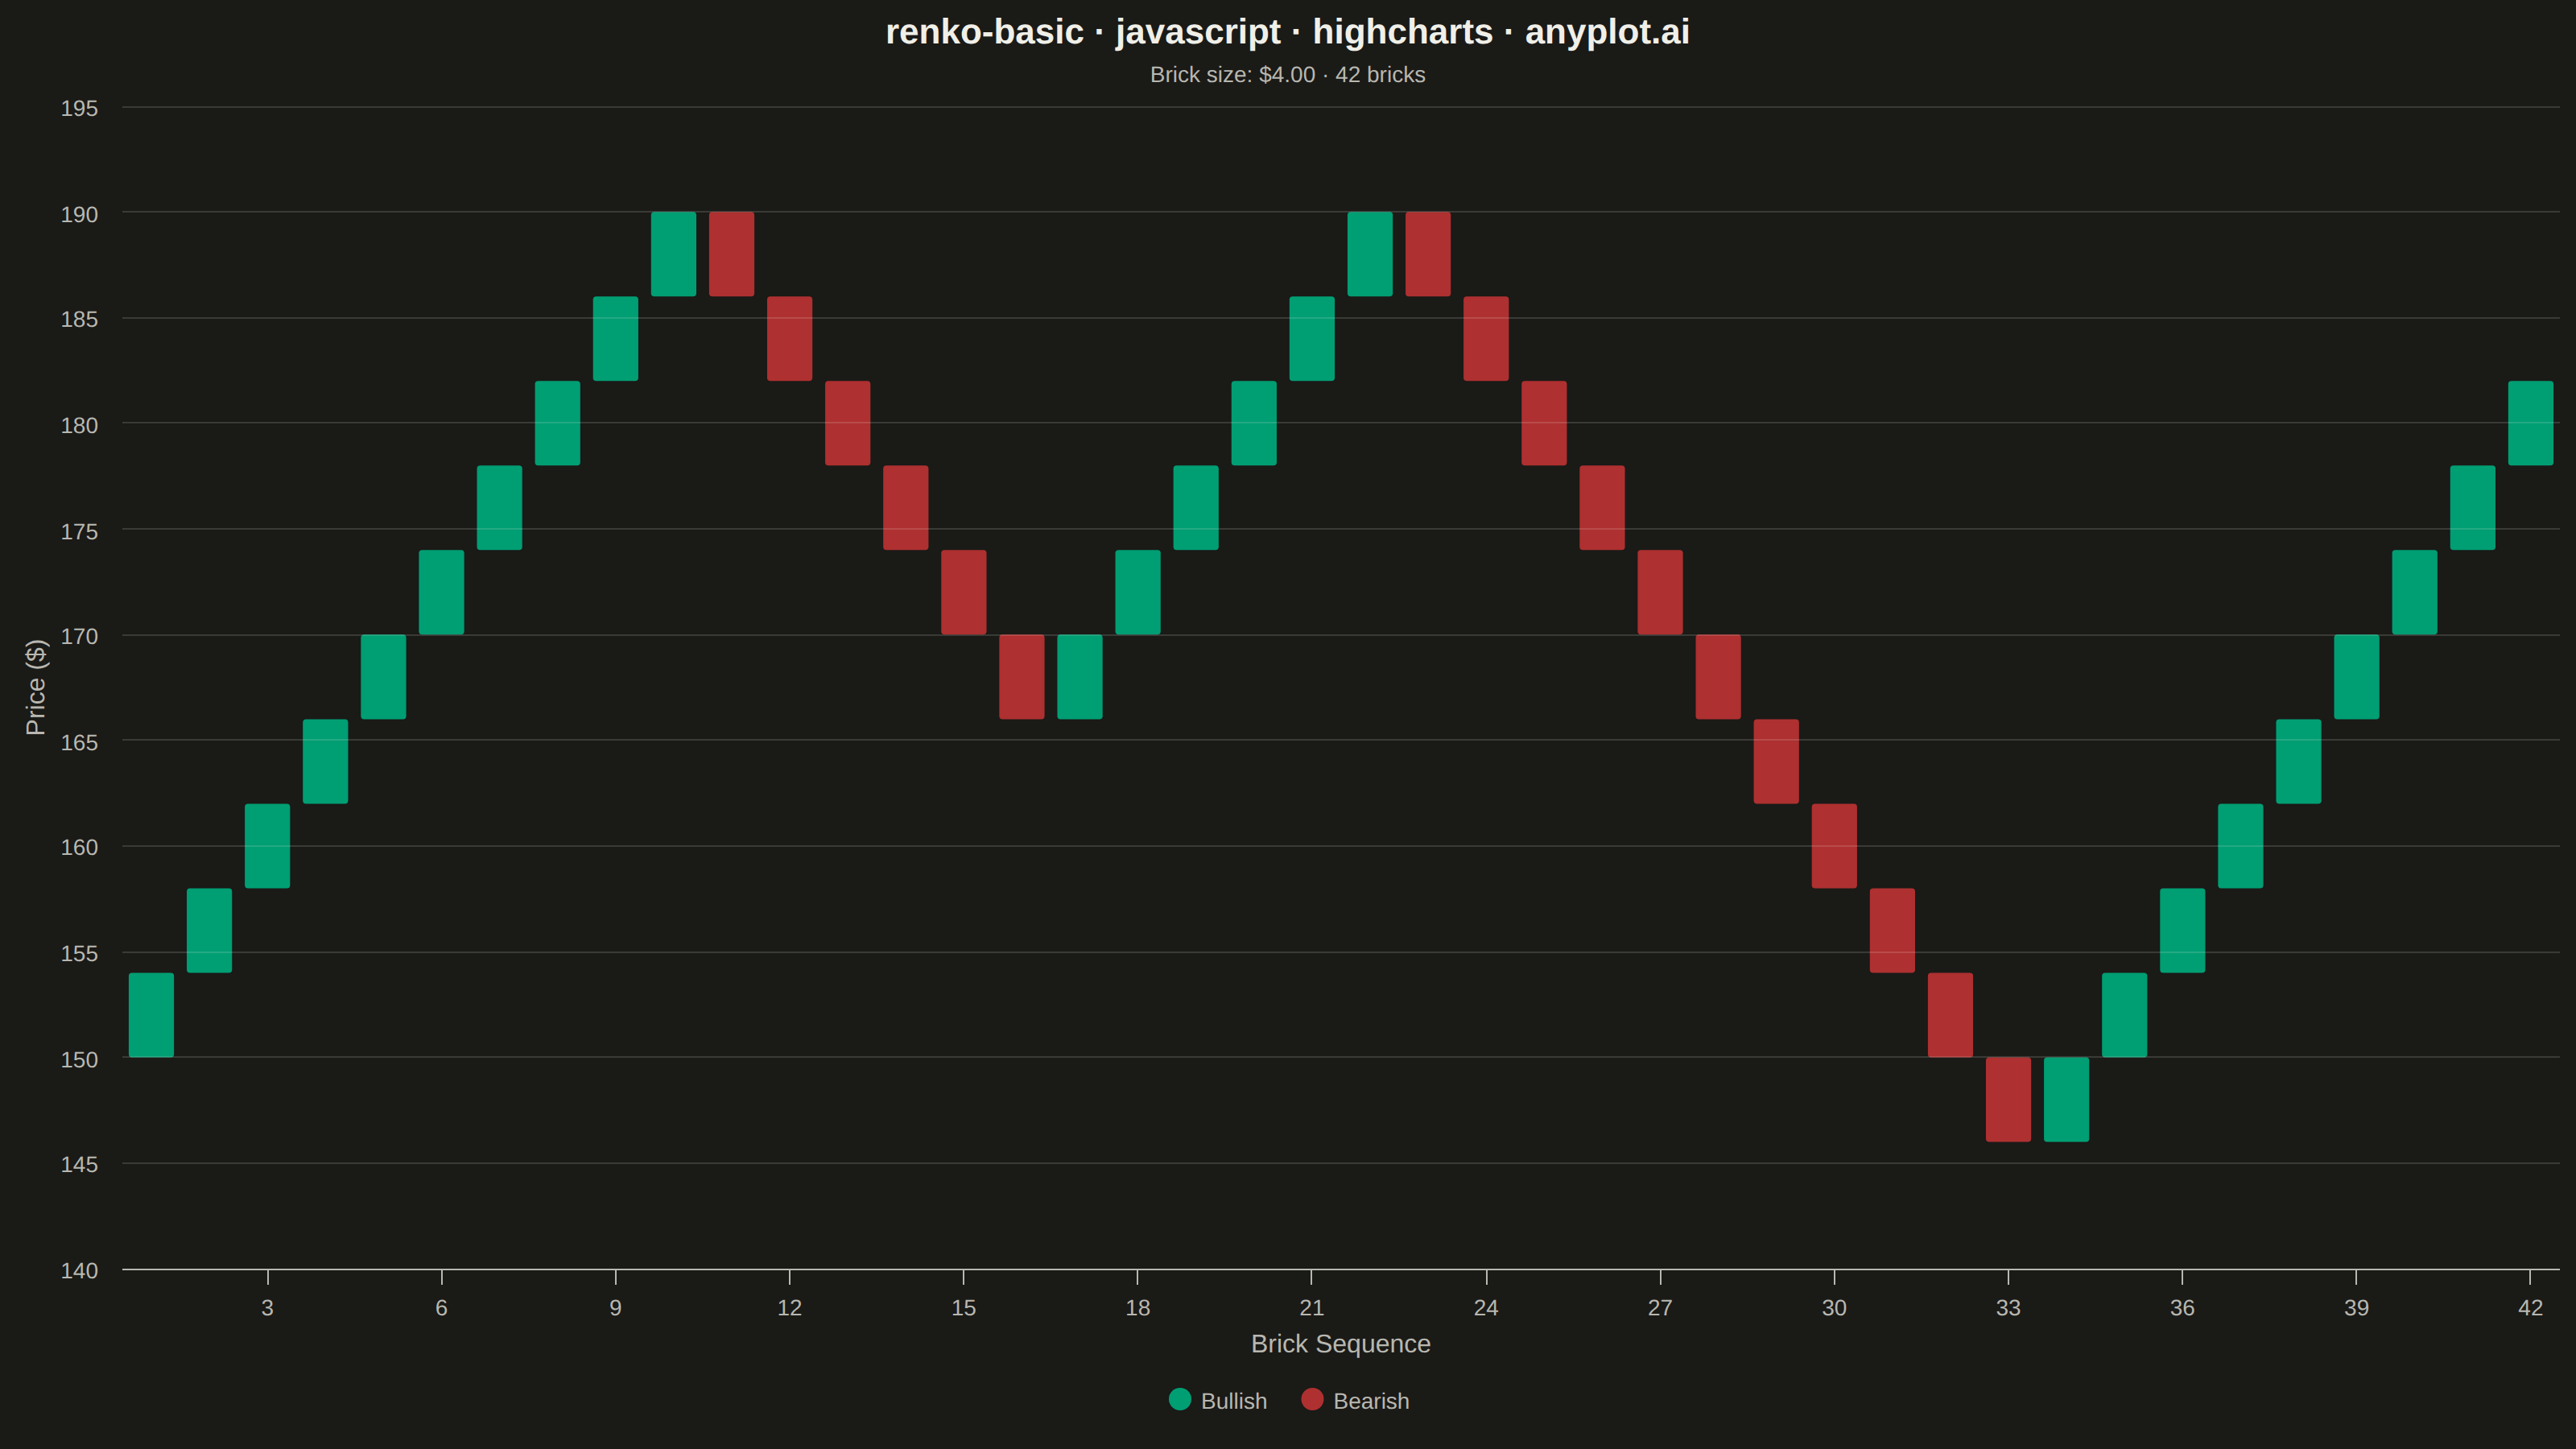
A Renko chart displays price movements using fixed-size bricks that ignore time and focus purely on price action. A new brick is drawn only when the price moves by a specified amount (brick size), filtering out market noise and minor fluctuations. Bullish bricks (price increase) and bearish bricks (price decrease) alternate direction on trend reversals, making it easy to identify trends, support/resistance levels, and potential trading signals.
// anyplot.ai
// renko-basic: Basic Renko Chart
// Library: highcharts 12.6.0 | JavaScript 22.23.2
// Quality: 90/100 | Created: 2026-09-02

const t = window.ANYPLOT_TOKENS;

// --- Data: synthetic daily closing prices (deterministic LCG) --------------
function lcg(seed) {
  let state = seed;
  return () => {
    state = (state * 1103515245 + 12345) & 0x7fffffff;
    return state / 0x7fffffff;
  };
}
const rand = lcg(42);

// Trending segments (up / pullback / up / correction / recovery) so the
// resulting bricks show clear runs and reversals, not just noise.
const segments = [
  { steps: 45, drift: 0.9 },
  { steps: 35, drift: -0.75 },
  { steps: 50, drift: 0.55 },
  { steps: 40, drift: -1.05 },
  { steps: 50, drift: 0.85 },
];
const closingPrices = [150];
for (const seg of segments) {
  for (let i = 0; i < seg.steps; i++) {
    const noise = (rand() - 0.5) * 2.2;
    closingPrices.push(closingPrices[closingPrices.length - 1] + seg.drift + noise);
  }
}

// --- Renko bricks: fixed price step, direction reverses on trend change ----
const brickSize = 4;
const bricks = [];
let basePrice = closingPrices[0];
for (let i = 1; i < closingPrices.length; i++) {
  const diff = closingPrices[i] - basePrice;
  const stepsUp = Math.floor(diff / brickSize);
  const stepsDown = Math.floor(-diff / brickSize);
  if (stepsUp >= 1) {
    for (let b = 0; b < stepsUp; b++) {
      bricks.push({ direction: "up", low: basePrice });
      basePrice += brickSize;
    }
  } else if (stepsDown >= 1) {
    for (let b = 0; b < stepsDown; b++) {
      basePrice -= brickSize;
      bricks.push({ direction: "down", low: basePrice });
    }
  }
}

const yMin = Math.floor((Math.min(...bricks.map((b) => b.low)) - brickSize) / brickSize) * brickSize;
const yMax = Math.ceil((Math.max(...bricks.map((b) => b.low)) + brickSize) / brickSize) * brickSize;

// --- Chart -------------------------------------------------------------
// Bricks are drawn as independent rects positioned via axis.toPixels() from
// a chart.events.render hook, rather than via a stacked-column series: core
// Highcharts has no columnrange/candlestick series (those live in the
// highcharts-more / stock modules, which aren't loaded), and simulating a
// floating bar with an invisible stacked base column breaks once the yAxis
// min sits far from the stack threshold (0). Drawing directly with the SVG
// renderer sidesteps that and gives exact control over each brick's [low, high].
Highcharts.chart("container", {
  chart: {
    type: "column",
    backgroundColor: "transparent",
    animation: false,
    style: { fontFamily: "inherit" },
    events: {
      render() {
        const chart = this;
        const xAxis = chart.xAxis[0];
        const yAxis = chart.yAxis[0];
        if (chart.renkoGroup) chart.renkoGroup.destroy();
        const group = chart.renderer.g("renko-bricks").add();
        const colStep = xAxis.toPixels(2) - xAxis.toPixels(1);
        const colWidth = Math.abs(colStep) * 0.78;
        bricks.forEach((brick, i) => {
          const xCenter = xAxis.toPixels(i + 1);
          const yTop = yAxis.toPixels(brick.low + brickSize);
          const yBottom = yAxis.toPixels(brick.low);
          chart.renderer
            .rect(xCenter - colWidth / 2, yTop, colWidth, Math.abs(yBottom - yTop), 2)
            .attr({ fill: brick.direction === "up" ? t.palette[0] : t.palette[4] })
            .add(group);
        });
        chart.renkoGroup = group;
      },
    },
  },
  credits: { enabled: false },
  title: {
    text: "renko-basic · javascript · highcharts · anyplot.ai",
    style: { color: t.ink, fontSize: "22px", fontWeight: "600" },
  },
  subtitle: {
    text: `Brick size: $${brickSize.toFixed(2)} · ${bricks.length} bricks`,
    style: { color: t.inkSoft, fontSize: "14px" },
  },
  xAxis: {
    min: 0.5,
    max: bricks.length + 0.5,
    tickInterval: Math.ceil(bricks.length / 18),
    title: { text: "Brick Sequence", style: { color: t.inkSoft, fontSize: "16px" } },
    lineColor: t.inkSoft,
    tickColor: t.inkSoft,
    labels: { style: { color: t.inkSoft, fontSize: "14px" } },
  },
  yAxis: {
    min: yMin,
    max: yMax,
    title: { text: "Price ($)", style: { color: t.inkSoft, fontSize: "16px" } },
    gridLineColor: t.grid,
    labels: { style: { color: t.inkSoft, fontSize: "14px" } },
  },
  legend: {
    itemStyle: { color: t.inkSoft, fontSize: "14px" },
    itemHoverStyle: { color: t.ink },
  },
  plotOptions: {
    series: { animation: false, enableMouseTracking: false },
  },
  series: [
    { name: "Bullish", type: "column", data: [], color: t.palette[0] },
    { name: "Bearish", type: "column", data: [], color: t.palette[4] },
  ],
});
Runnable source as JSON, for any HTTP client: https://api.anyplot.ai/specs/renko-basic/highcharts/code. Any spec id and library id listed in llms-full.txt fit the same URL shape; every URL below is complete and callable.
{
  "spec_id": "renko-basic",
  "language": "javascript",
  "library": "highcharts",
  "page": "https://anyplot.ai/renko-basic/javascript/highcharts",
  "hub": "https://anyplot.ai/renko-basic",
  "code_json": "https://api.anyplot.ai/specs/renko-basic/highcharts/code",
  "spec_json": "https://api.anyplot.ai/specs/renko-basic",
  "render_light_png": "https://storage.googleapis.com/anyplot-images/plots/renko-basic/javascript/highcharts/plot-light.png",
  "render_dark_png": "https://storage.googleapis.com/anyplot-images/plots/renko-basic/javascript/highcharts/plot-dark.png",
  "interactive_light_html": "https://storage.googleapis.com/anyplot-images/plots/renko-basic/javascript/highcharts/plot-light.html",
  "interactive_dark_html": "https://storage.googleapis.com/anyplot-images/plots/renko-basic/javascript/highcharts/plot-dark.html",
  "quality_score": 90.0,
  "license": "MIT",
  "guide": "https://anyplot.ai/llms.txt"
}
Part of Basic Renko Chart on anyplot.ai.