The same plot in 14 other libraries — JavaScript: Chart.js, D3.js, Highcharts, MUI X Charts; Python: Altair, Bokeh, lets-plot, Matplotlib, Plotly, plotnine, Pygal, Seaborn; R: ggplot2; Julia: Makie.jl. Compare all 15 side by side: Basic Renko Chart in Python, R, Julia and JavaScript.
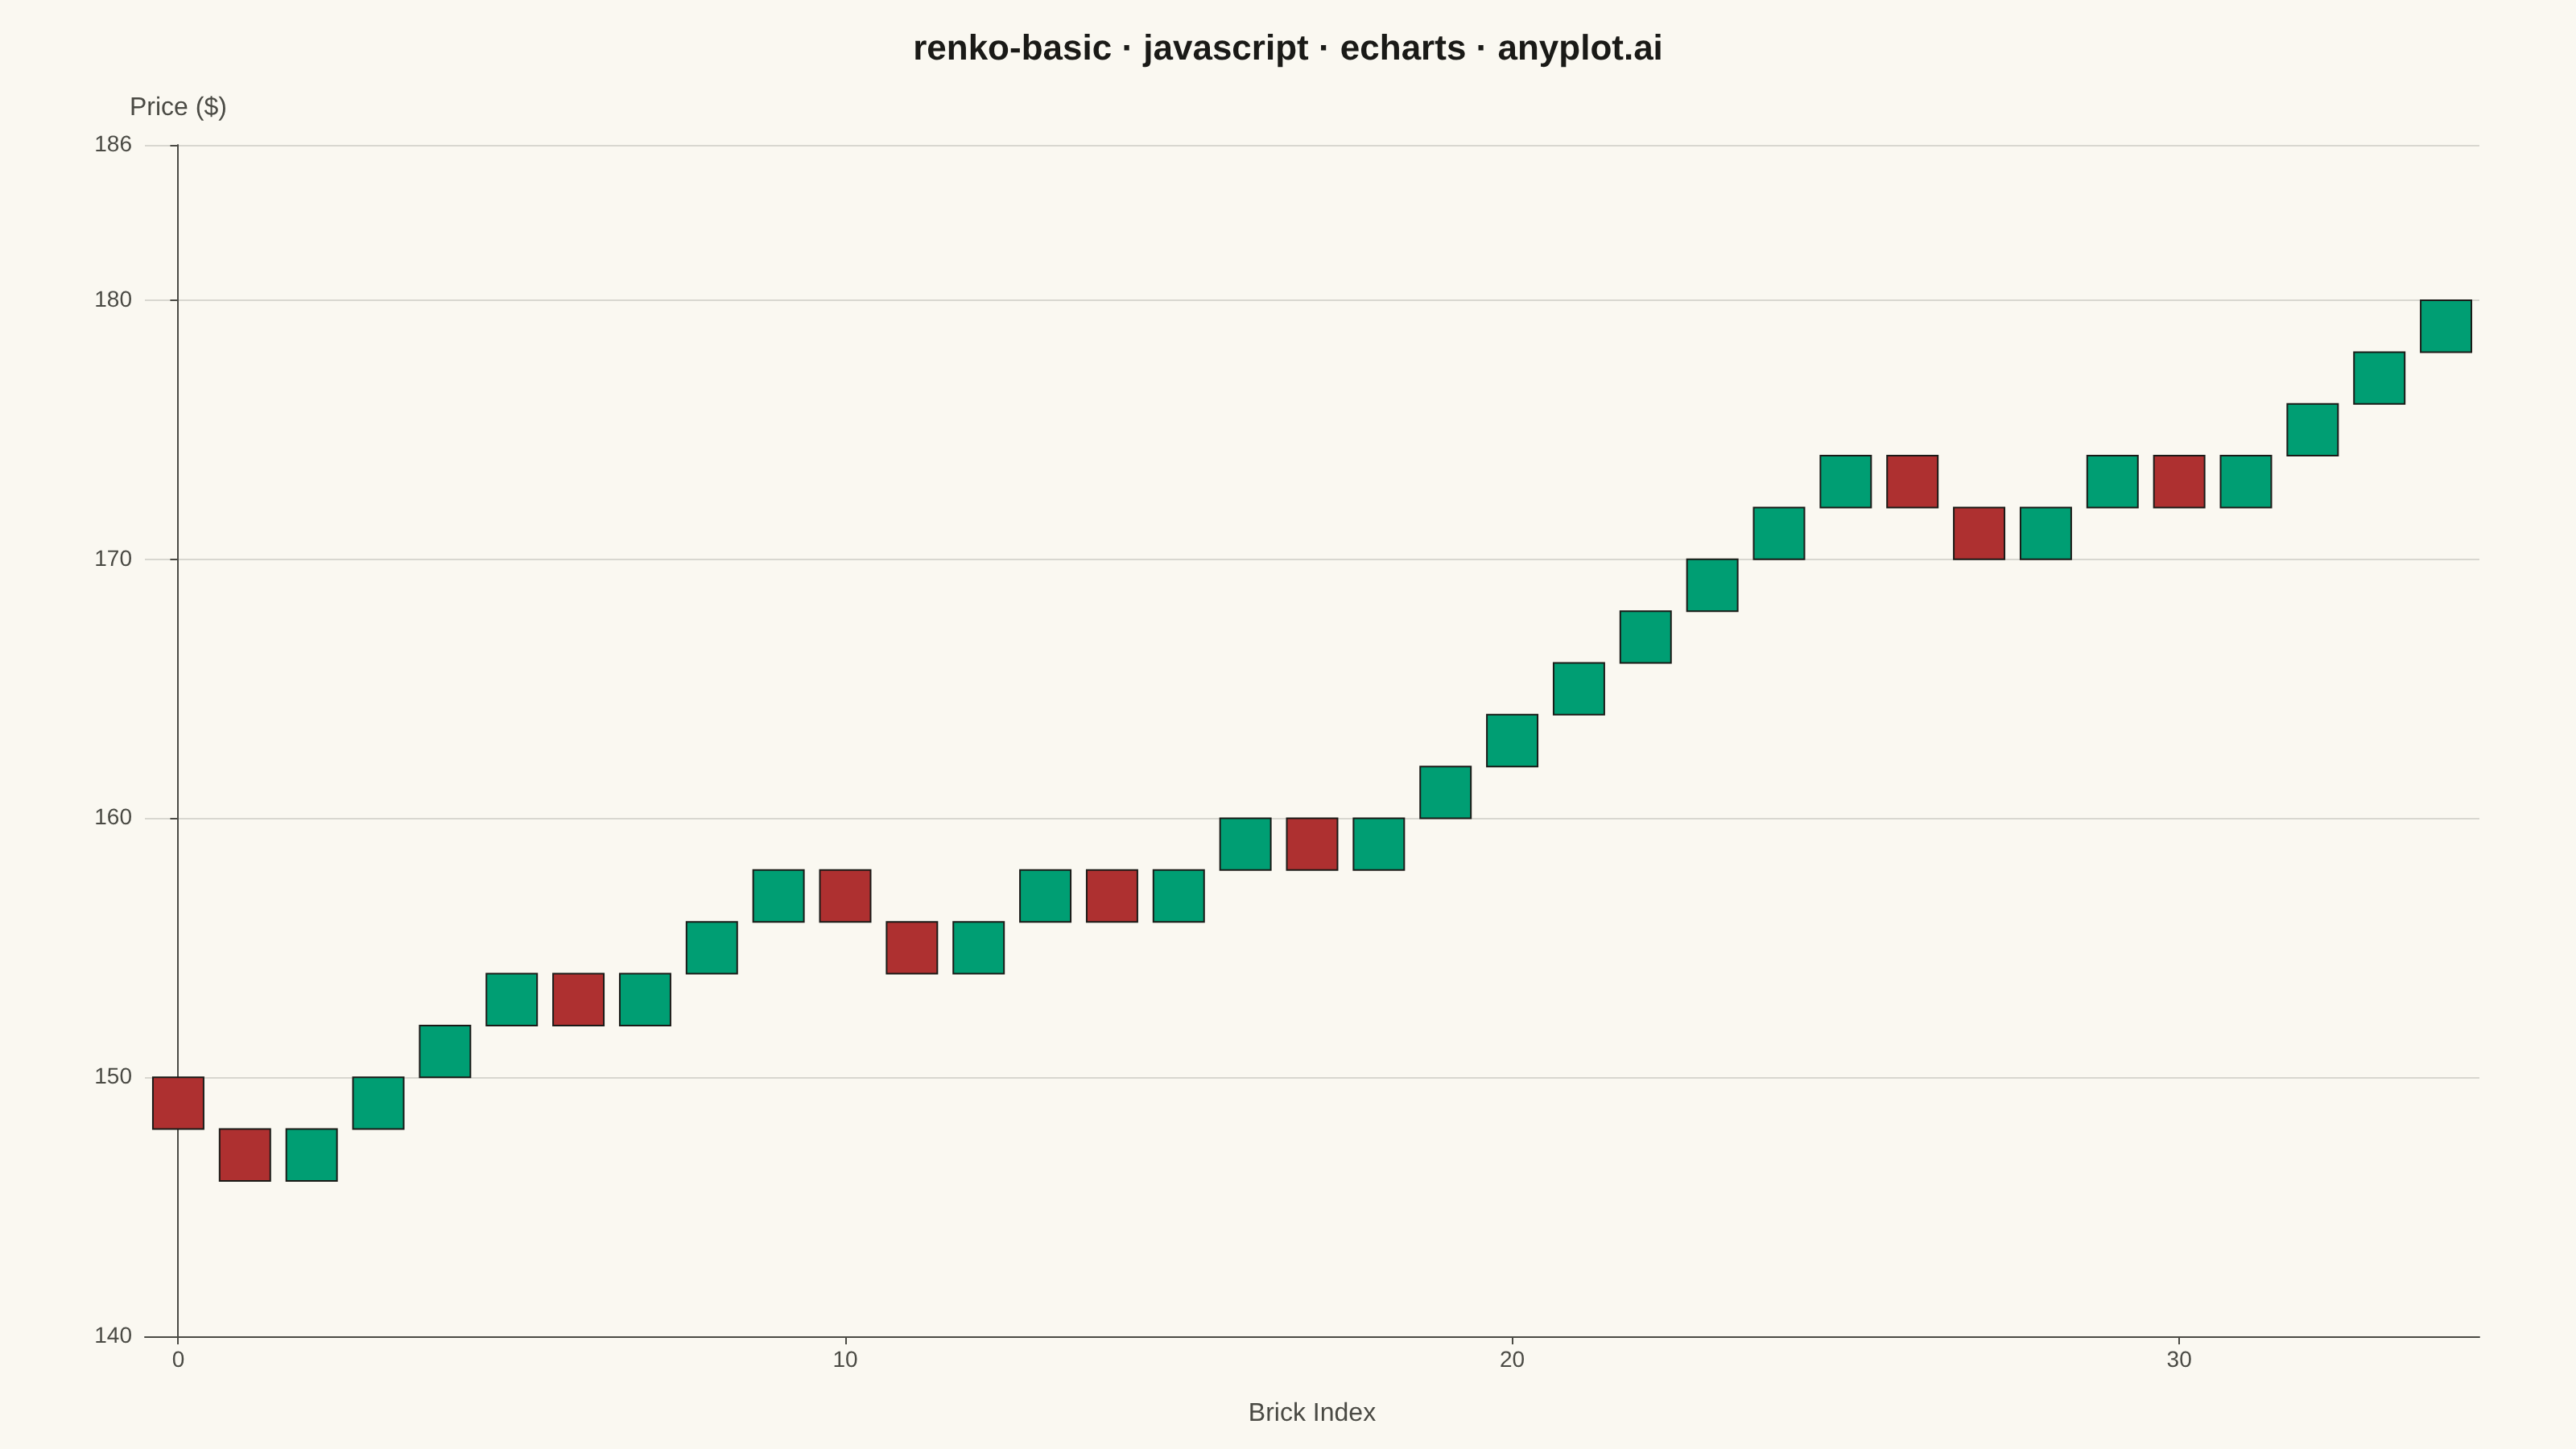
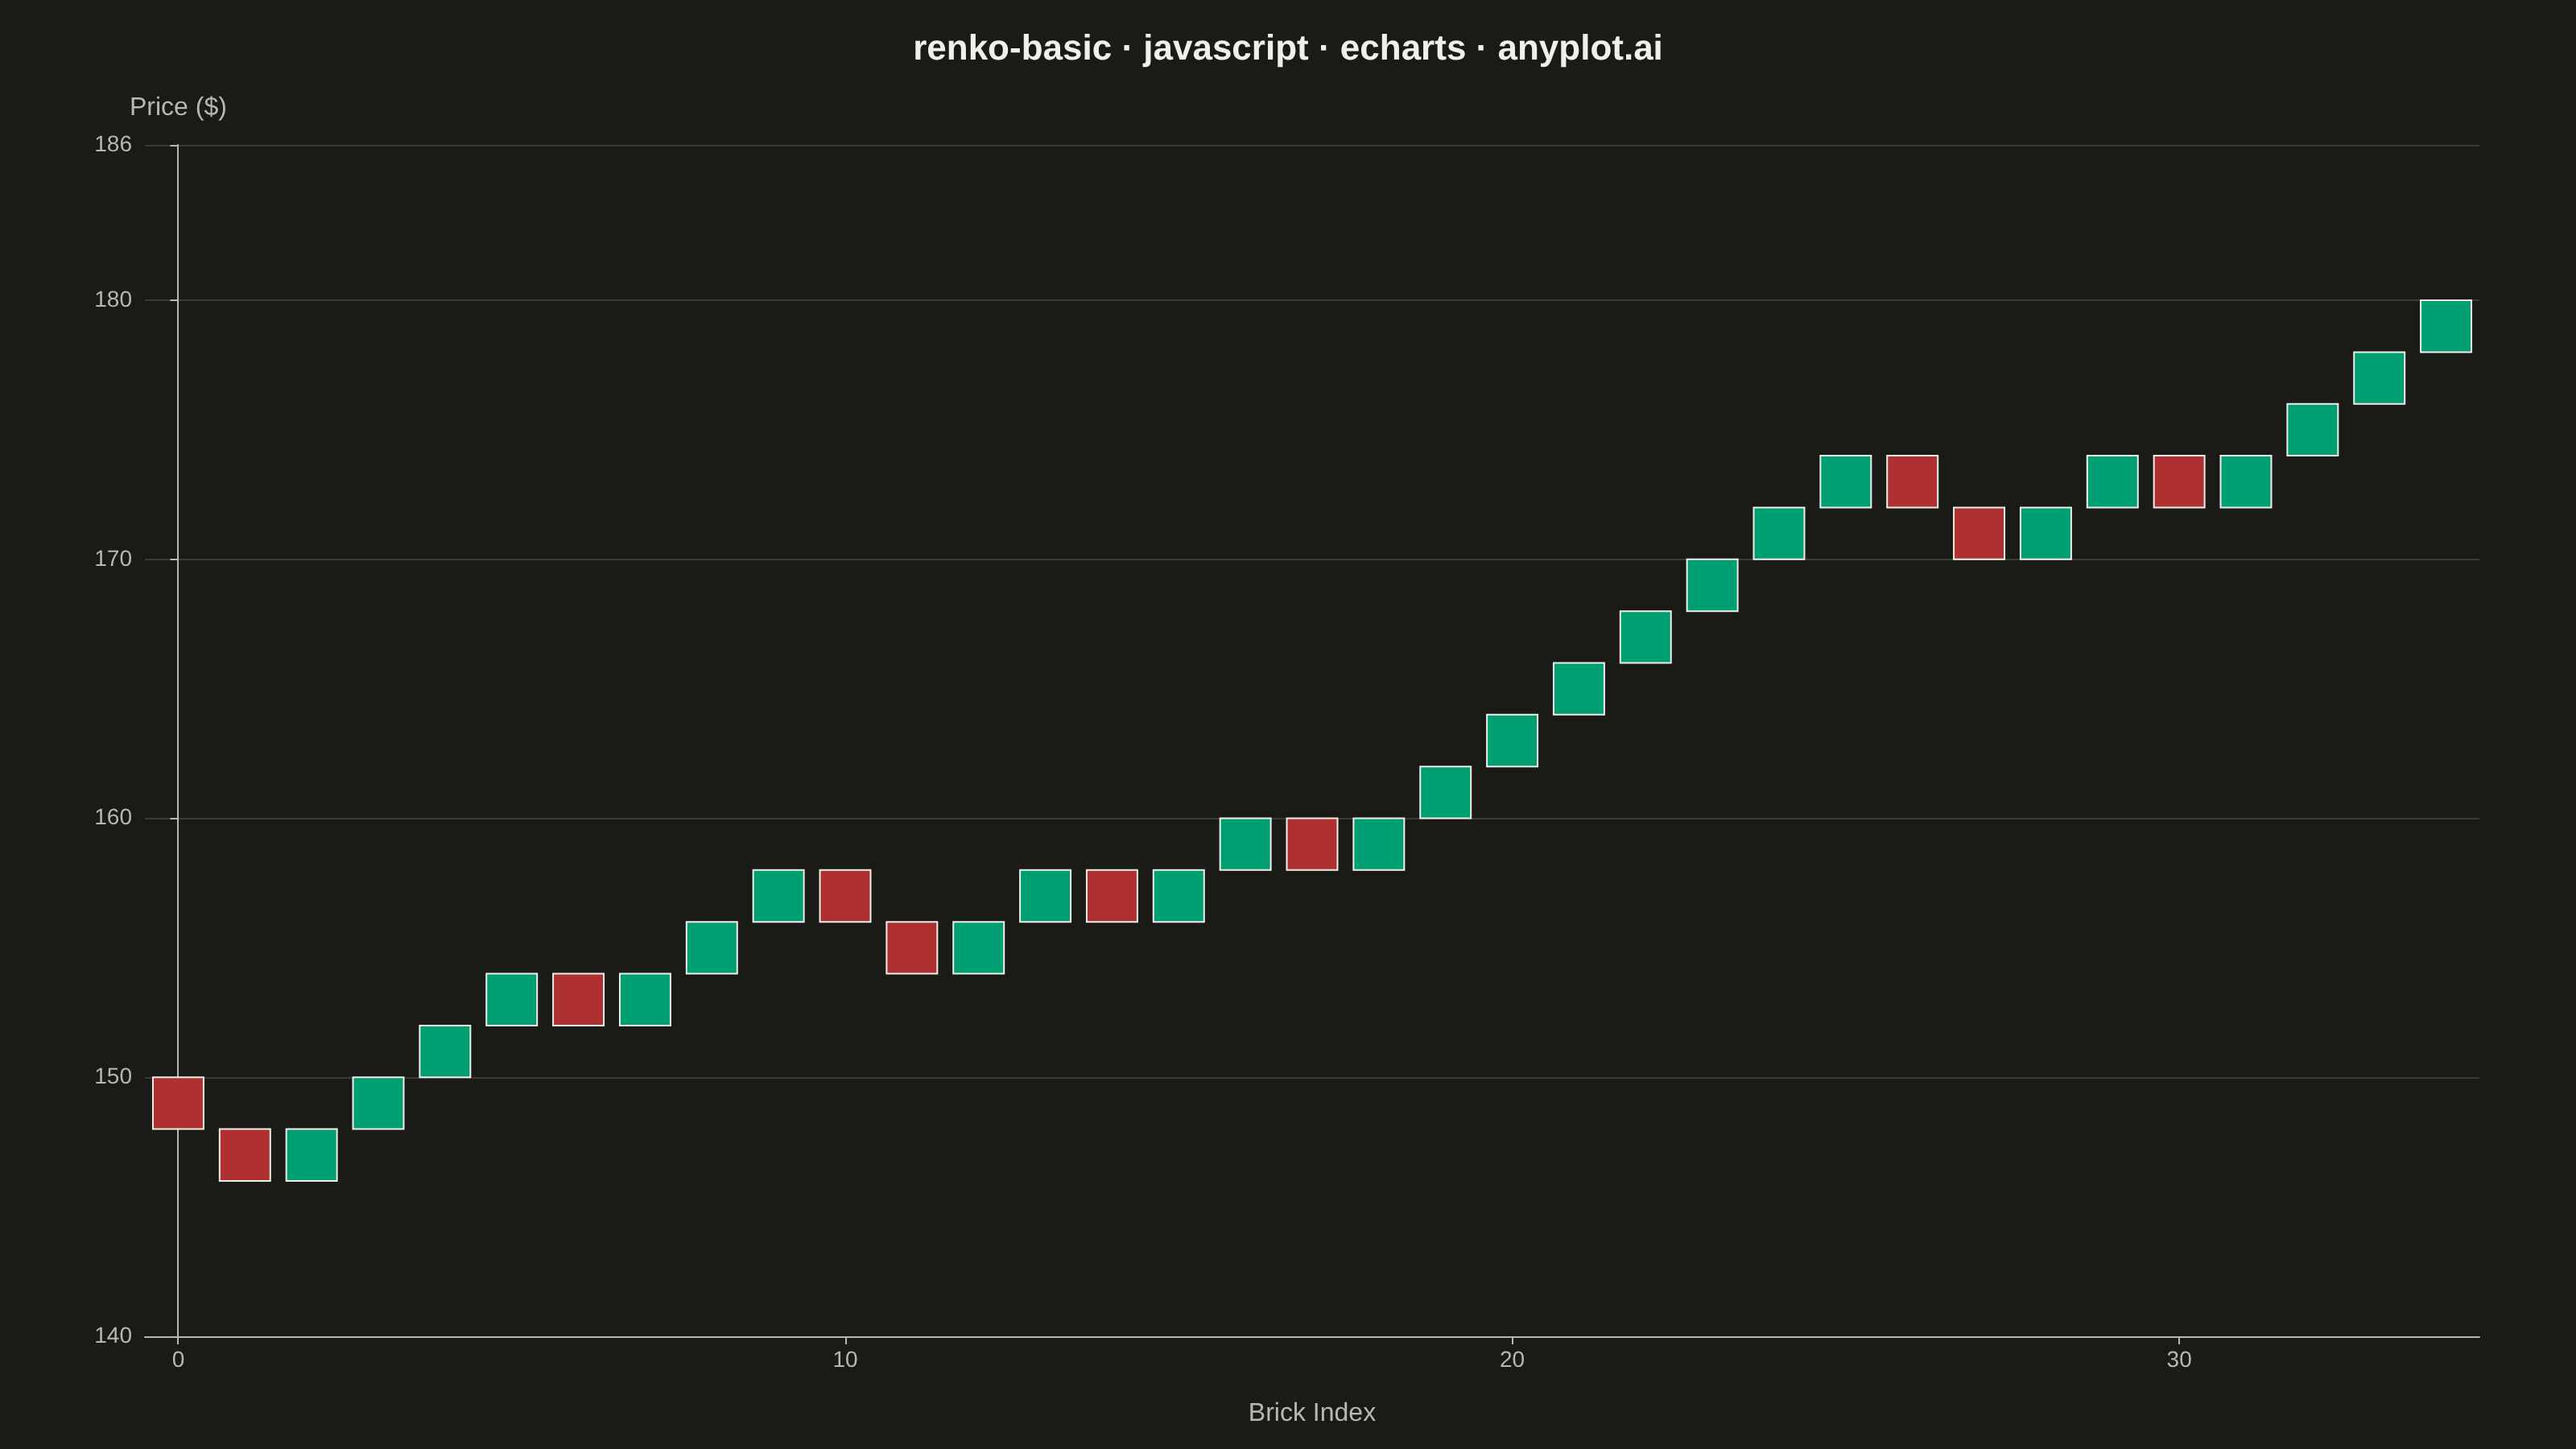
A Renko chart displays price movements using fixed-size bricks that ignore time and focus purely on price action. A new brick is drawn only when the price moves by a specified amount (brick size), filtering out market noise and minor fluctuations. Bullish bricks (price increase) and bearish bricks (price decrease) alternate direction on trend reversals, making it easy to identify trends, support/resistance levels, and potential trading signals.
// anyplot.ai
// renko-basic: Basic Renko Chart
// Library: echarts 6.1.0 | JavaScript 22.23.2
// Quality: 87/100 | Created: 2026-09-02

const t = window.ANYPLOT_TOKENS;
const UP_COLOR = t.palette[0]; // "#009E73" — bullish brick, ALWAYS Imprint position 1
const DOWN_COLOR = "#AE3030"; // Imprint position 5 — semantic anchor for bearish/loss

// --- Data: simulate daily closes, then convert to Renko bricks -------------
// Tiny fixed-seed LCG — the browser has no seeded RNG.
function makeLcg(seed) {
  let state = seed;
  return () => {
    state = (state * 1664525 + 1013904223) % 4294967296;
    return state / 4294967296;
  };
}

const rng = makeLcg(42);
const brickSize = 2; // fixed $2 price move per brick
const numDays = 220;

const closes = [150];
for (let i = 1; i < numDays; i++) {
  const step = (rng() - 0.5) * 3 + 0.08; // slight upward drift random walk
  closes.push(closes[i - 1] + step);
}

// Renko conversion: a new brick is emitted only once price has moved a full
// brickSize away from the last brick's boundary — this is what filters out
// the day-to-day noise and leaves only significant price action.
const bricks = [];
let level = Math.round(closes[0] / brickSize) * brickSize;
for (let i = 1; i < closes.length; i++) {
  const price = closes[i];
  while (price - level >= brickSize) {
    level += brickSize;
    bricks.push({ low: level - brickSize, high: level, direction: 1 });
  }
  while (level - price >= brickSize) {
    level -= brickSize;
    bricks.push({ low: level, high: level + brickSize, direction: -1 });
  }
}

const brickData = bricks.map((b, i) => [i, b.low, b.high, b.direction]);
const priceLow = Math.min(...bricks.map((b) => b.low));
const priceHigh = Math.max(...bricks.map((b) => b.high));
const pricePadding = brickSize * 3;

// --- Init --------------------------------------------------------------
const chart = echarts.init(document.getElementById("container"));

// --- Option --------------------------------------------------------------
// Bricks are drawn with a custom series (renderItem) so every brick is a
// uniform rectangle with a small gap between neighbors — a plain bar series
// cannot start each bar at an arbitrary "low" baseline.
chart.setOption({
  animation: false,
  backgroundColor: "transparent",
  title: {
    text: "renko-basic · javascript · echarts · anyplot.ai",
    left: "center",
    textStyle: { color: t.ink, fontSize: 22 },
  },
  grid: { left: 90, right: 60, top: 90, bottom: 70 },
  xAxis: {
    type: "value",
    name: "Brick Index",
    nameLocation: "middle",
    nameGap: 40,
    nameTextStyle: { color: t.inkSoft, fontSize: 16 },
    min: -0.5,
    max: brickData.length - 0.5,
    axisLabel: {
      color: t.inkSoft,
      fontSize: 14,
      showMinLabel: false,
      showMaxLabel: false,
    },
    axisLine: { lineStyle: { color: t.inkSoft } },
    splitLine: { show: false },
  },
  yAxis: {
    type: "value",
    name: "Price ($)",
    nameTextStyle: { color: t.inkSoft, fontSize: 16 },
    min: priceLow - pricePadding,
    max: priceHigh + pricePadding,
    axisLabel: { color: t.inkSoft, fontSize: 14 },
    axisLine: { lineStyle: { color: t.inkSoft } },
    splitLine: { lineStyle: { color: t.grid } },
  },
  series: [
    {
      type: "custom",
      renderItem: (params, api) => {
        const idx = api.value(0);
        const low = api.value(1);
        const high = api.value(2);
        const direction = api.value(3);
        const gap = 0.12; // fraction of one brick-width kept as a visual gap
        const topLeft = api.coord([idx - 0.5 + gap, high]);
        const bottomRight = api.coord([idx + 0.5 - gap, low]);
        const width = bottomRight[0] - topLeft[0];
        const height = bottomRight[1] - topLeft[1];
        return {
          type: "rect",
          shape: { x: topLeft[0], y: topLeft[1], width, height },
          style: {
            fill: direction > 0 ? UP_COLOR : DOWN_COLOR,
            stroke: t.ink,
            lineWidth: 1,
          },
        };
      },
      encode: { x: 0, y: [1, 2] },
      data: brickData,
    },
  ],
});
Runnable source as JSON, for any HTTP client: https://api.anyplot.ai/specs/renko-basic/echarts/code. Any spec id and library id listed in llms-full.txt fit the same URL shape; every URL below is complete and callable.
{
  "spec_id": "renko-basic",
  "language": "javascript",
  "library": "echarts",
  "page": "https://anyplot.ai/renko-basic/javascript/echarts",
  "hub": "https://anyplot.ai/renko-basic",
  "code_json": "https://api.anyplot.ai/specs/renko-basic/echarts/code",
  "spec_json": "https://api.anyplot.ai/specs/renko-basic",
  "render_light_png": "https://storage.googleapis.com/anyplot-images/plots/renko-basic/javascript/echarts/plot-light.png",
  "render_dark_png": "https://storage.googleapis.com/anyplot-images/plots/renko-basic/javascript/echarts/plot-dark.png",
  "interactive_light_html": "https://storage.googleapis.com/anyplot-images/plots/renko-basic/javascript/echarts/plot-light.html",
  "interactive_dark_html": "https://storage.googleapis.com/anyplot-images/plots/renko-basic/javascript/echarts/plot-dark.html",
  "quality_score": 87.0,
  "license": "MIT",
  "guide": "https://anyplot.ai/llms.txt"
}
Part of Basic Renko Chart on anyplot.ai.