The same plot in 14 other libraries — JavaScript: D3.js, Apache ECharts, Highcharts, MUI X Charts; Python: Altair, Bokeh, lets-plot, Matplotlib, Plotly, plotnine, Pygal, Seaborn; R: ggplot2; Julia: Makie.jl. Compare all 15 side by side: Basic Renko Chart in Python, R, Julia and JavaScript.
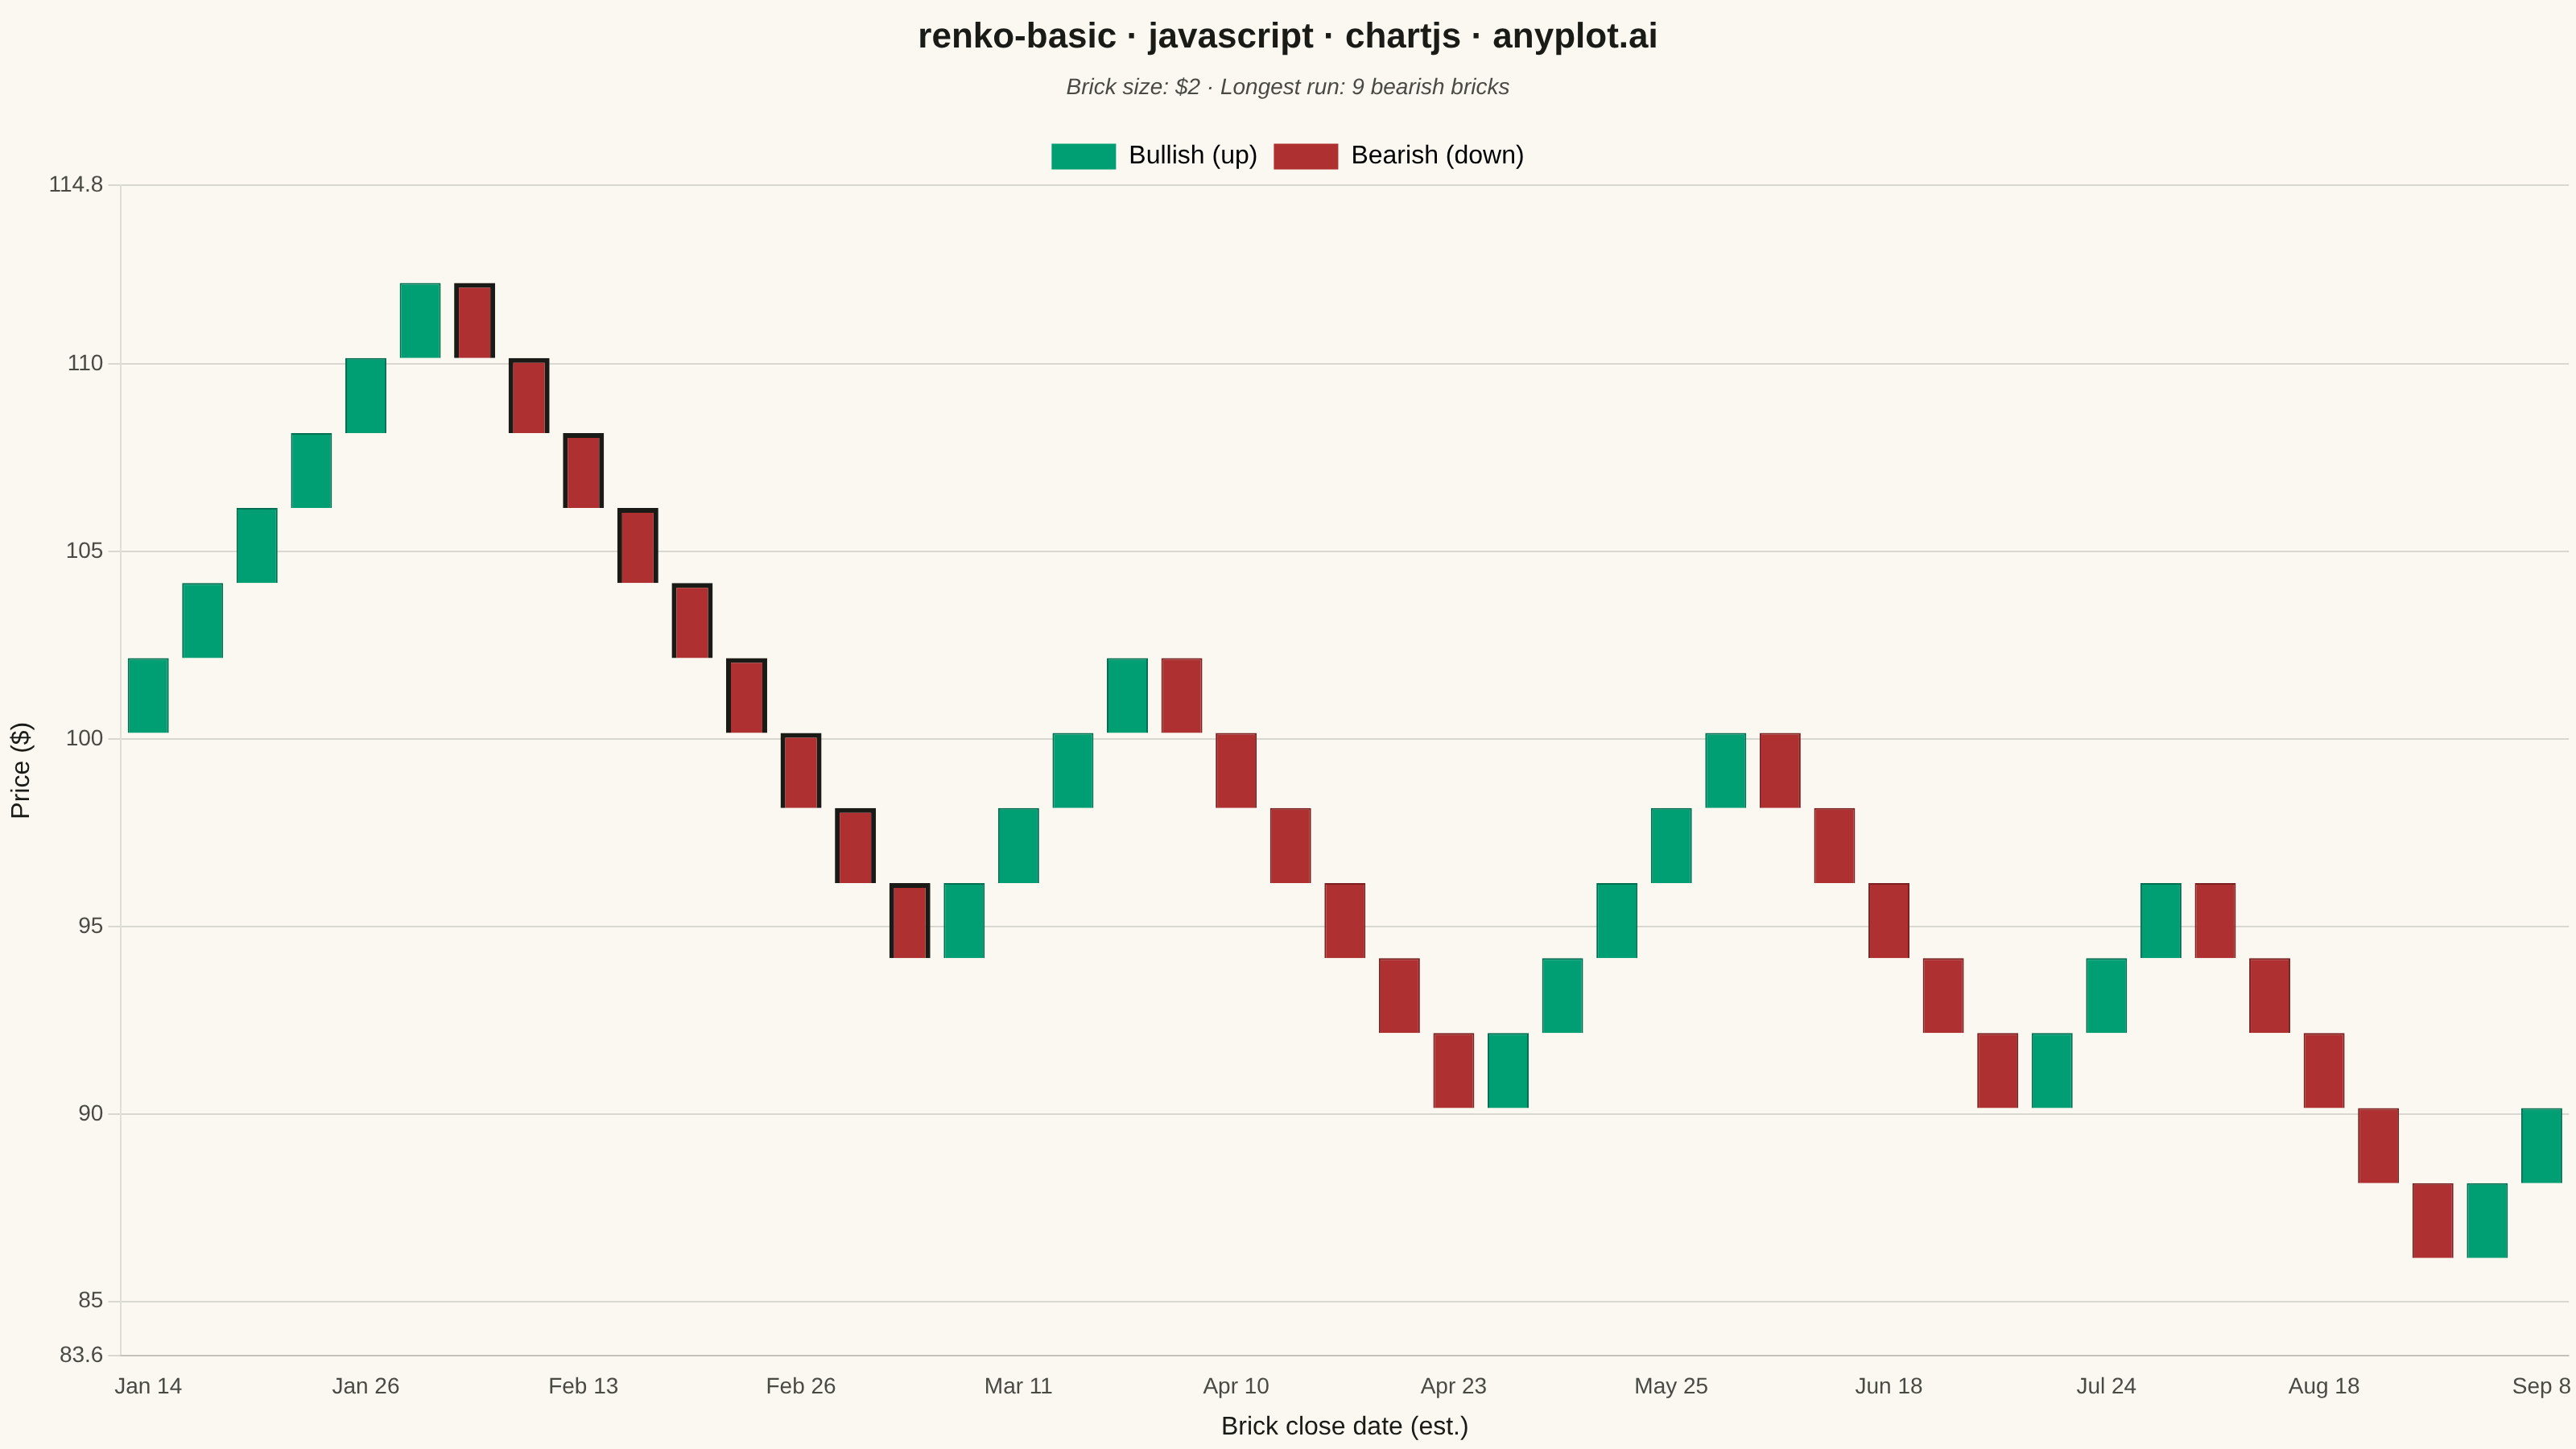
A Renko chart displays price movements using fixed-size bricks that ignore time and focus purely on price action. A new brick is drawn only when the price moves by a specified amount (brick size), filtering out market noise and minor fluctuations. Bullish bricks (price increase) and bearish bricks (price decrease) alternate direction on trend reversals, making it easy to identify trends, support/resistance levels, and potential trading signals.
// anyplot.ai
// renko-basic: Basic Renko Chart
// Library: chartjs 4.4.7 | JavaScript 22.23.2
// Quality: 93/100 | Created: 2026-09-02

const t = window.ANYPLOT_TOKENS;

// --- Data: deterministic LCG price walk with alternating trend regimes -----
function lcg(seed) {
  let state = seed >>> 0;
  return () => {
    state = (state * 1664525 + 1013904223) >>> 0;
    return state / 4294967296;
  };
}
const rand = lcg(20240315);

const NUM_OBSERVATIONS = 260;
const REGIME_LENGTH = 30;
const BRICK_SIZE = 2;
const START_DATE = Date.UTC(2024, 0, 2);

const closes = [];
let price = 100;
for (let day = 0; day < NUM_OBSERVATIONS; day++) {
  const regime = Math.floor(day / REGIME_LENGTH) % 2 === 0 ? 1 : -1;
  const drift = regime * 0.35;
  const noise = (rand() - 0.5) * 2.4;
  price += drift + noise;
  closes.push(price);
}

// --- Renko brick construction (fixed brick size, direction on reversal) ----
const bricks = [];
let lastBrickClose = closes[0];
for (let day = 1; day < closes.length; day++) {
  const observedPrice = closes[day];
  while (Math.abs(observedPrice - lastBrickClose) >= BRICK_SIZE) {
    const direction = observedPrice > lastBrickClose ? 1 : -1;
    const newClose = lastBrickClose + direction * BRICK_SIZE;
    bricks.push({ open: lastBrickClose, close: newClose, direction, day });
    lastBrickClose = newClose;
  }
}

const labels = bricks.map((b) => {
  const d = new Date(START_DATE + b.day * 86400000);
  return d.toLocaleDateString("en-US", { month: "short", day: "numeric" });
});
const values = bricks.map((b) => [Math.min(b.open, b.close), Math.max(b.open, b.close)]);

// Price range is far from zero — anchor the axis to the brick range, not the origin.
const allPrices = bricks.flatMap((b) => [b.open, b.close]);
const priceRange = Math.max(...allPrices) - Math.min(...allPrices);
const yPadding = priceRange * 0.1;
const yMin = Math.min(...allPrices) - yPadding;
const yMax = Math.max(...allPrices) + yPadding;

// Finance semantic exception (default-style-guide.md): up -> brand green, down -> matte red
const BULLISH = t.palette[0];
const BEARISH = t.palette[4];

// Thin edge highlight: a darker shade of each brick's own hue for subtle depth.
function shade(hex, factor) {
  const r = Math.round(parseInt(hex.slice(1, 3), 16) * factor);
  const g = Math.round(parseInt(hex.slice(3, 5), 16) * factor);
  const b = Math.round(parseInt(hex.slice(5, 7), 16) * factor);
  return `rgb(${r}, ${g}, ${b})`;
}
const BULLISH_EDGE = shade(BULLISH, 0.7);
const BEARISH_EDGE = shade(BEARISH, 0.7);

// Find the longest run of consecutive same-direction bricks - the strongest
// trend move in the series - to call it out with a bolder ink-color edge.
let streakStart = 0;
let streakEnd = 0;
let runStart = 0;
for (let i = 1; i <= bricks.length; i++) {
  if (i === bricks.length || bricks[i].direction !== bricks[i - 1].direction) {
    if (i - runStart > streakEnd - streakStart + 1) {
      streakStart = runStart;
      streakEnd = i - 1;
    }
    runStart = i;
  }
}
const streakLength = streakEnd - streakStart + 1;
const streakLabel = bricks[streakStart].direction === 1 ? "bullish" : "bearish";

// --- Mount -------------------------------------------------------------
const canvas = document.createElement("canvas");
document.getElementById("container").appendChild(canvas);

// --- Chart ---------------------------------------------------------------
new Chart(canvas, {
  type: "bar",
  data: {
    labels,
    datasets: [
      {
        label: "Brick",
        data: values,
        backgroundColor: (ctx) => (bricks[ctx.dataIndex].direction === 1 ? BULLISH : BEARISH),
        borderColor: (ctx) => {
          const i = ctx.dataIndex;
          if (i >= streakStart && i <= streakEnd) return t.ink;
          return bricks[i].direction === 1 ? BULLISH_EDGE : BEARISH_EDGE;
        },
        borderWidth: (ctx) => (ctx.dataIndex >= streakStart && ctx.dataIndex <= streakEnd ? 3 : 1),
        barPercentage: 0.82,
        categoryPercentage: 0.92,
      },
    ],
  },
  options: {
    responsive: true,
    maintainAspectRatio: false,
    animation: false,
    plugins: {
      title: {
        display: true,
        text: "renko-basic · javascript · chartjs · anyplot.ai",
        color: t.ink,
        font: { size: 22 },
      },
      subtitle: {
        display: true,
        text: `Brick size: $${BRICK_SIZE} · Longest run: ${streakLength} ${streakLabel} bricks`,
        color: t.inkSoft,
        font: { size: 14, style: "italic" },
        padding: { bottom: 16 },
      },
      legend: {
        display: true,
        labels: {
          color: t.ink,
          font: { size: 16 },
          generateLabels: () => [
            { text: "Bullish (up)", fillStyle: BULLISH, strokeStyle: BULLISH, lineWidth: 0 },
            { text: "Bearish (down)", fillStyle: BEARISH, strokeStyle: BEARISH, lineWidth: 0 },
          ],
        },
      },
    },
    scales: {
      x: {
        ticks: { color: t.inkSoft, font: { size: 14 }, autoSkip: true, maxTicksLimit: 14, maxRotation: 0 },
        grid: { display: false },
        title: { display: true, text: "Brick close date (est.)", color: t.ink, font: { size: 16 } },
      },
      y: {
        min: yMin,
        max: yMax,
        ticks: { color: t.inkSoft, font: { size: 14 } },
        grid: { color: t.grid },
        title: { display: true, text: "Price ($)", color: t.ink, font: { size: 16 } },
      },
    },
  },
});
Runnable source as JSON, for any HTTP client: https://api.anyplot.ai/specs/renko-basic/chartjs/code. Any spec id and library id listed in llms-full.txt fit the same URL shape; every URL below is complete and callable.
{
  "spec_id": "renko-basic",
  "language": "javascript",
  "library": "chartjs",
  "page": "https://anyplot.ai/renko-basic/javascript/chartjs",
  "hub": "https://anyplot.ai/renko-basic",
  "code_json": "https://api.anyplot.ai/specs/renko-basic/chartjs/code",
  "spec_json": "https://api.anyplot.ai/specs/renko-basic",
  "render_light_png": "https://storage.googleapis.com/anyplot-images/plots/renko-basic/javascript/chartjs/plot-light.png",
  "render_dark_png": "https://storage.googleapis.com/anyplot-images/plots/renko-basic/javascript/chartjs/plot-dark.png",
  "interactive_light_html": "https://storage.googleapis.com/anyplot-images/plots/renko-basic/javascript/chartjs/plot-light.html",
  "interactive_dark_html": "https://storage.googleapis.com/anyplot-images/plots/renko-basic/javascript/chartjs/plot-dark.html",
  "quality_score": 93.0,
  "license": "MIT",
  "guide": "https://anyplot.ai/llms.txt"
}
Part of Basic Renko Chart on anyplot.ai.