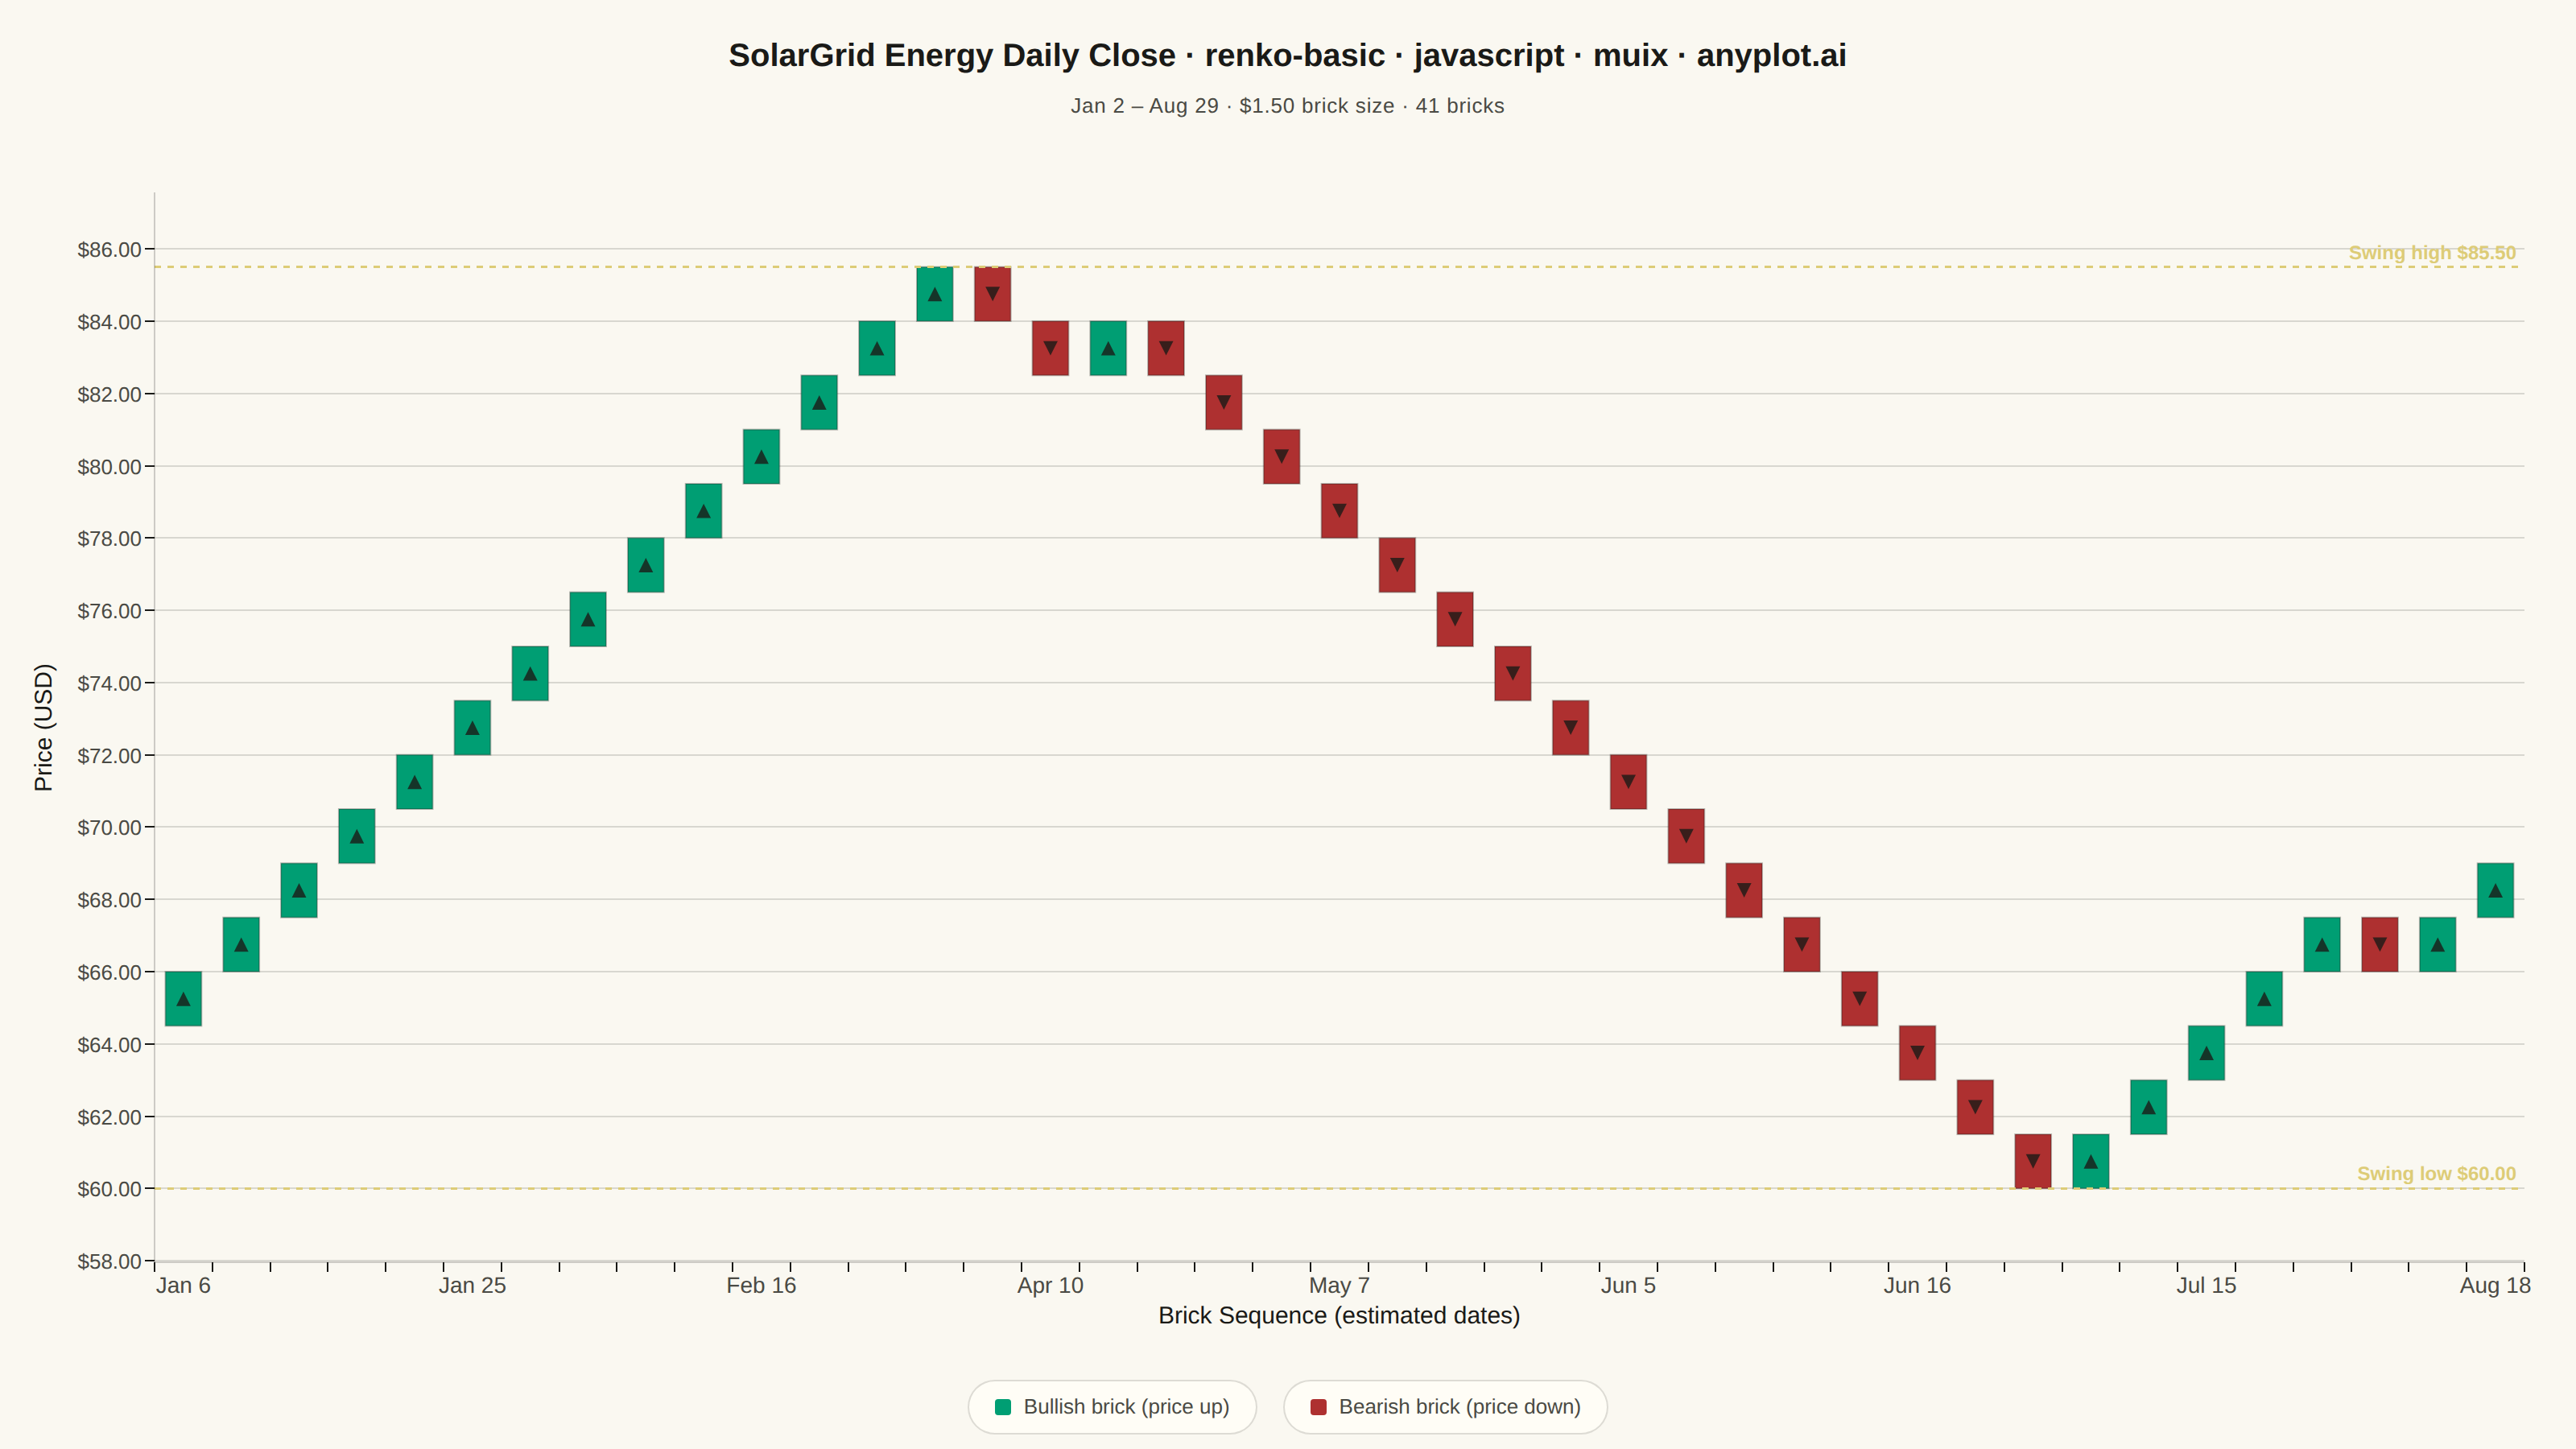
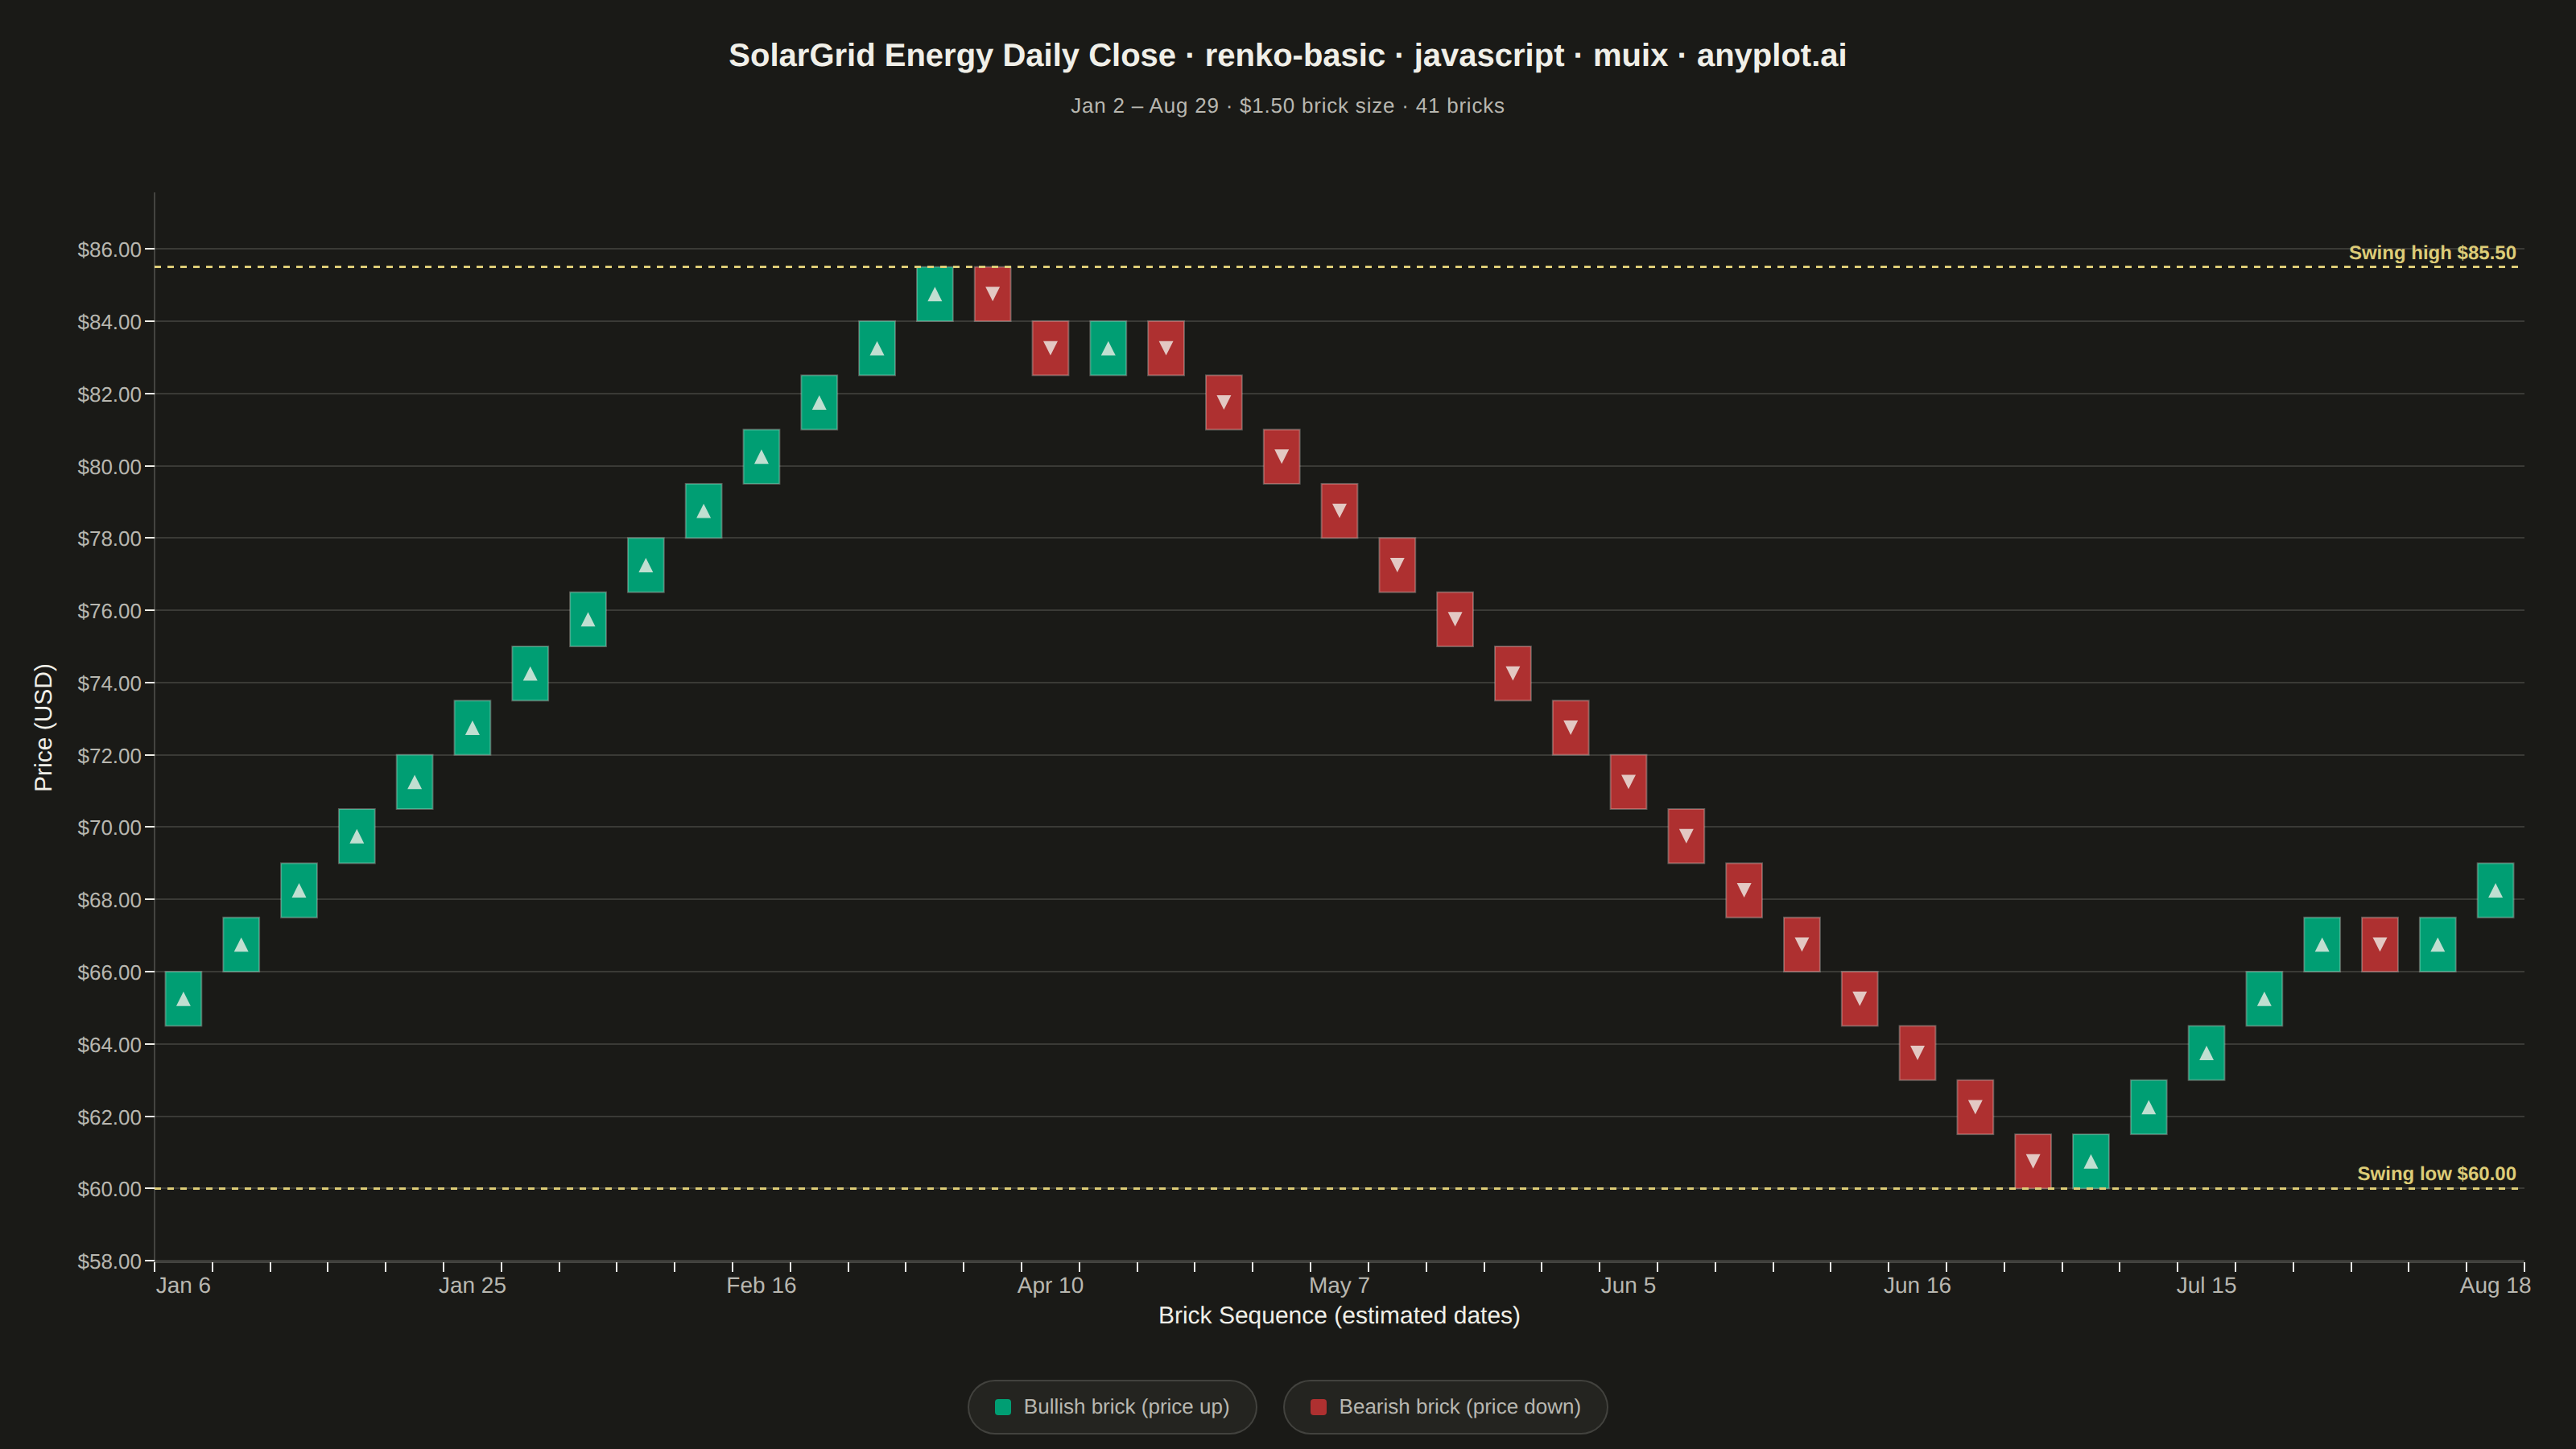
The same plot in 14 other libraries — JavaScript: Chart.js, D3.js, Apache ECharts, Highcharts; Python: Altair, Bokeh, lets-plot, Matplotlib, Plotly, plotnine, Pygal, Seaborn; R: ggplot2; Julia: Makie.jl. Compare all 15 side by side: Basic Renko Chart in Python, R, Julia and JavaScript.
A Renko chart displays price movements using fixed-size bricks that ignore time and focus purely on price action. A new brick is drawn only when the price moves by a specified amount (brick size), filtering out market noise and minor fluctuations. Bullish bricks (price increase) and bearish bricks (price decrease) alternate direction on trend reversals, making it easy to identify trends, support/resistance levels, and potential trading signals.
// anyplot.ai
// renko-basic: Basic Renko Chart
// Library: muix 7.29.1 | JavaScript 22.23.2
// Quality: 92/100 | Created: 2026-09-02

import { ChartContainer } from "@mui/x-charts/ChartContainer";
import { ChartsXAxis } from "@mui/x-charts/ChartsXAxis";
import { ChartsYAxis } from "@mui/x-charts/ChartsYAxis";
import { ChartsGrid } from "@mui/x-charts/ChartsGrid";
import { ChartsReferenceLine } from "@mui/x-charts/ChartsReferenceLine";
import { useXScale, useYScale } from "@mui/x-charts/hooks";
import Box from "@mui/material/Box";
import Typography from "@mui/material/Typography";

const t = window.ANYPLOT_TOKENS;

// --- Data (in-memory, deterministic LCG PRNG — no fetch, no Math.random) ----
let seed = 42;
function rand() {
  seed = (seed * 1103515245 + 12345) & 0x7fffffff;
  return seed / 0x7fffffff;
}

// Daily closes for a fictional solar-energy stock across four trend regimes
// (uptrend, consolidation, downtrend, recovery) — the zigzag that a Renko
// chart is built to filter down to a handful of clean bricks.
const REGIMES = [
  { days: 60, drift: 0.34 },
  { days: 50, drift: 0.0 },
  { days: 70, drift: -0.3 },
  { days: 60, drift: 0.26 },
];
const closes = [64.0];
const dates = [new Date(2024, 0, 2)];
for (const regime of REGIMES) {
  for (let d = 0; d < regime.days; d++) {
    const noise = (rand() - 0.5) * 1.6;
    const prev = closes[closes.length - 1];
    closes.push(Math.max(prev + regime.drift + noise, 5));
    const nextDate = new Date(dates[dates.length - 1]);
    nextDate.setDate(nextDate.getDate() + 1);
    dates.push(nextDate);
  }
}

// --- Renko brick construction: a new brick is only drawn once price moves a
// full BRICK_SIZE away from the last brick's boundary — this is what strips
// time and minor noise out of the series, leaving only decisive moves.
const BRICK_SIZE = 1.5;
const bricks = []; // { base, direction: 1 | -1, date }
let anchor = Math.round(closes[0] / BRICK_SIZE) * BRICK_SIZE;
for (let i = 1; i < closes.length; i++) {
  const price = closes[i];
  while (price - anchor >= BRICK_SIZE) {
    bricks.push({ base: anchor, direction: 1, date: dates[i] });
    anchor += BRICK_SIZE;
  }
  while (anchor - price >= BRICK_SIZE) {
    anchor -= BRICK_SIZE;
    bricks.push({ base: anchor, direction: -1, date: dates[i] });
  }
}

const brickLabels = bricks.map((_, i) => `${i + 1}`);
const yMin = Math.min(...bricks.map((b) => b.base));
const yMax = Math.max(...bricks.map((b) => b.base + BRICK_SIZE));
const yPad = (yMax - yMin) * 0.08;

const fmtDate = (d) => d.toLocaleDateString("en-US", { month: "short", day: "numeric" });
const tickEvery = Math.ceil(bricks.length / 10);

// --- Bricks: MUI X community has no native Renko series — draw uniform,
// gapped rectangles against the shared band/linear scales via
// useXScale/useYScale, the documented ChartContainer composition pattern for
// chart types outside the community surface (same idiom as candlestick/OHLC).
// Bullish bricks (price up) are brand green, bearish (price down) matte red —
// the finance up/down semantic exception from the style guide. Each brick also
// carries an ink-colored up/down triangle so direction reads from shape alone,
// not just hue, for viewers who can't distinguish red from green.
function Bricks() {
  const xScale = useXScale("x");
  const yScale = useYScale("y");
  if (!xScale || !yScale) return null;
  const bw = xScale.bandwidth();
  const brickWidth = bw * 0.78;

  return (
    <g>
      {bricks.map((brick, i) => {
        const cx = xScale(brickLabels[i]) + bw / 2;
        const color = brick.direction === 1 ? t.palette[0] : t.palette[4];
        const yTop = yScale(brick.base + BRICK_SIZE);
        const yBottom = yScale(brick.base);
        const brickHeight = yBottom - yTop;
        const cy = (yTop + yBottom) / 2;
        const markSize = Math.min(brickWidth, brickHeight) * 0.4;
        const showMark = markSize >= 6;
        const points =
          brick.direction === 1
            ? `${cx},${cy - markSize / 2} ${cx - markSize / 2},${cy + markSize / 2} ${cx + markSize / 2},${cy + markSize / 2}`
            : `${cx},${cy + markSize / 2} ${cx - markSize / 2},${cy - markSize / 2} ${cx + markSize / 2},${cy - markSize / 2}`;
        return (
          <g key={i}>
            <rect
              x={cx - brickWidth / 2}
              y={yTop}
              width={brickWidth}
              height={brickHeight}
              fill={color}
              stroke={t.ink}
              strokeOpacity={0.3}
              strokeWidth={1}
            />
            {showMark && <polygon points={points} fill={t.ink} fillOpacity={0.8} />}
          </g>
        );
      })}
    </g>
  );
}

export default function Chart() {
  const W = window.ANYPLOT_SIZE.width;
  const H = window.ANYPLOT_SIZE.height;
  const TITLE_H = 96;
  const LEGEND_H = 52;
  const chartH = H - TITLE_H - LEGEND_H;

  const title = "SolarGrid Energy Daily Close · renko-basic · javascript · muix · anyplot.ai";
  const titleSize = title.length > 67 ? Math.round((22 * 67) / title.length) : 22;
  const subtitle = `${fmtDate(dates[0])} – ${fmtDate(dates[dates.length - 1])} · $${BRICK_SIZE.toFixed(2)} brick size · ${bricks.length} bricks`;

  const legendItems = [
    { label: "Bullish brick (price up)", color: t.palette[0] },
    { label: "Bearish brick (price down)", color: t.palette[4] },
  ];

  return (
    <Box
      sx={{
        width: W,
        height: H,
        bgcolor: t.pageBg,
        display: "flex",
        flexDirection: "column",
        fontFamily: "'Roboto', 'Helvetica Neue', Arial, sans-serif",
        boxSizing: "border-box",
      }}
    >
      <Box
        sx={{
          height: TITLE_H,
          display: "flex",
          flexDirection: "column",
          alignItems: "center",
          justifyContent: "center",
          gap: "6px",
        }}
      >
        <Typography sx={{ color: t.ink, fontSize: titleSize, fontWeight: 600 }}>{title}</Typography>
        <Typography sx={{ color: t.inkSoft, fontSize: 13, fontWeight: 400, letterSpacing: "0.03em" }}>
          {subtitle}
        </Typography>
      </Box>

      <ChartContainer
        width={W}
        height={chartH}
        skipAnimation
        series={[]}
        xAxis={[
          {
            id: "x",
            scaleType: "band",
            data: brickLabels,
            label: "Brick Sequence (estimated dates)",
            valueFormatter: (label) => fmtDate(bricks[Number(label) - 1].date),
            tickLabelInterval: (_value, index) => index % tickEvery === 0,
            tickLabelStyle: { fontSize: 14, fill: t.inkSoft },
            labelStyle: { fontSize: 15, fill: t.ink },
          },
        ]}
        yAxis={[
          {
            id: "y",
            min: yMin - yPad,
            max: yMax + yPad,
            label: "Price (USD)",
            valueFormatter: (v) => `$${v.toFixed(2)}`,
            tickLabelStyle: { fontSize: 13, fill: t.inkSoft },
            labelStyle: { fontSize: 15, fill: t.ink },
          },
        ]}
        margin={{ top: 24, bottom: 64, left: 96, right: 32 }}
        sx={{
          "& .MuiChartsAxis-line": { stroke: t.inkSoft, strokeOpacity: 0.2 },
          "& .MuiChartsGrid-line": { stroke: t.grid },
        }}
      >
        <ChartsGrid horizontal />
        <Bricks />
        <ChartsReferenceLine
          axisId="y"
          y={yMax}
          label={`Swing high $${yMax.toFixed(2)}`}
          labelAlign="end"
          lineStyle={{ stroke: t.amber, strokeDasharray: "4 4", strokeWidth: 1.5 }}
          labelStyle={{ fill: t.amber, fontSize: 12, fontWeight: 600 }}
        />
        <ChartsReferenceLine
          axisId="y"
          y={yMin}
          label={`Swing low $${yMin.toFixed(2)}`}
          labelAlign="end"
          lineStyle={{ stroke: t.amber, strokeDasharray: "4 4", strokeWidth: 1.5 }}
          labelStyle={{ fill: t.amber, fontSize: 12, fontWeight: 600 }}
        />
        <ChartsXAxis axisId="x" />
        <ChartsYAxis axisId="y" slotProps={{ axisLabel: { x: -64 } }} />
      </ChartContainer>

      <Box sx={{ height: LEGEND_H, display: "flex", alignItems: "center", justifyContent: "center", gap: "16px" }}>
        {legendItems.map((item) => (
          <Box
            key={item.label}
            sx={{
              display: "flex",
              alignItems: "center",
              gap: "8px",
              padding: "6px 16px",
              borderRadius: "999px",
              border: `1px solid ${t.grid}`,
              bgcolor: t.elevatedBg,
            }}
          >
            <Box sx={{ width: 10, height: 10, borderRadius: "2px", bgcolor: item.color }} />
            <Typography sx={{ color: t.inkSoft, fontSize: 13, fontWeight: 500 }}>{item.label}</Typography>
          </Box>
        ))}
      </Box>
    </Box>
  );
}
Runnable source as JSON, for any HTTP client: https://api.anyplot.ai/specs/renko-basic/muix/code. Any spec id and library id listed in llms-full.txt fit the same URL shape; every URL below is complete and callable.
{
  "spec_id": "renko-basic",
  "language": "javascript",
  "library": "muix",
  "page": "https://anyplot.ai/renko-basic/javascript/muix",
  "hub": "https://anyplot.ai/renko-basic",
  "code_json": "https://api.anyplot.ai/specs/renko-basic/muix/code",
  "spec_json": "https://api.anyplot.ai/specs/renko-basic",
  "render_light_png": "https://storage.googleapis.com/anyplot-images/plots/renko-basic/javascript/muix/plot-light.png",
  "render_dark_png": "https://storage.googleapis.com/anyplot-images/plots/renko-basic/javascript/muix/plot-dark.png",
  "interactive_light_html": "https://storage.googleapis.com/anyplot-images/plots/renko-basic/javascript/muix/plot-light.html",
  "interactive_dark_html": "https://storage.googleapis.com/anyplot-images/plots/renko-basic/javascript/muix/plot-dark.html",
  "quality_score": 92.0,
  "license": "MIT",
  "guide": "https://anyplot.ai/llms.txt"
}
Part of Basic Renko Chart on anyplot.ai.