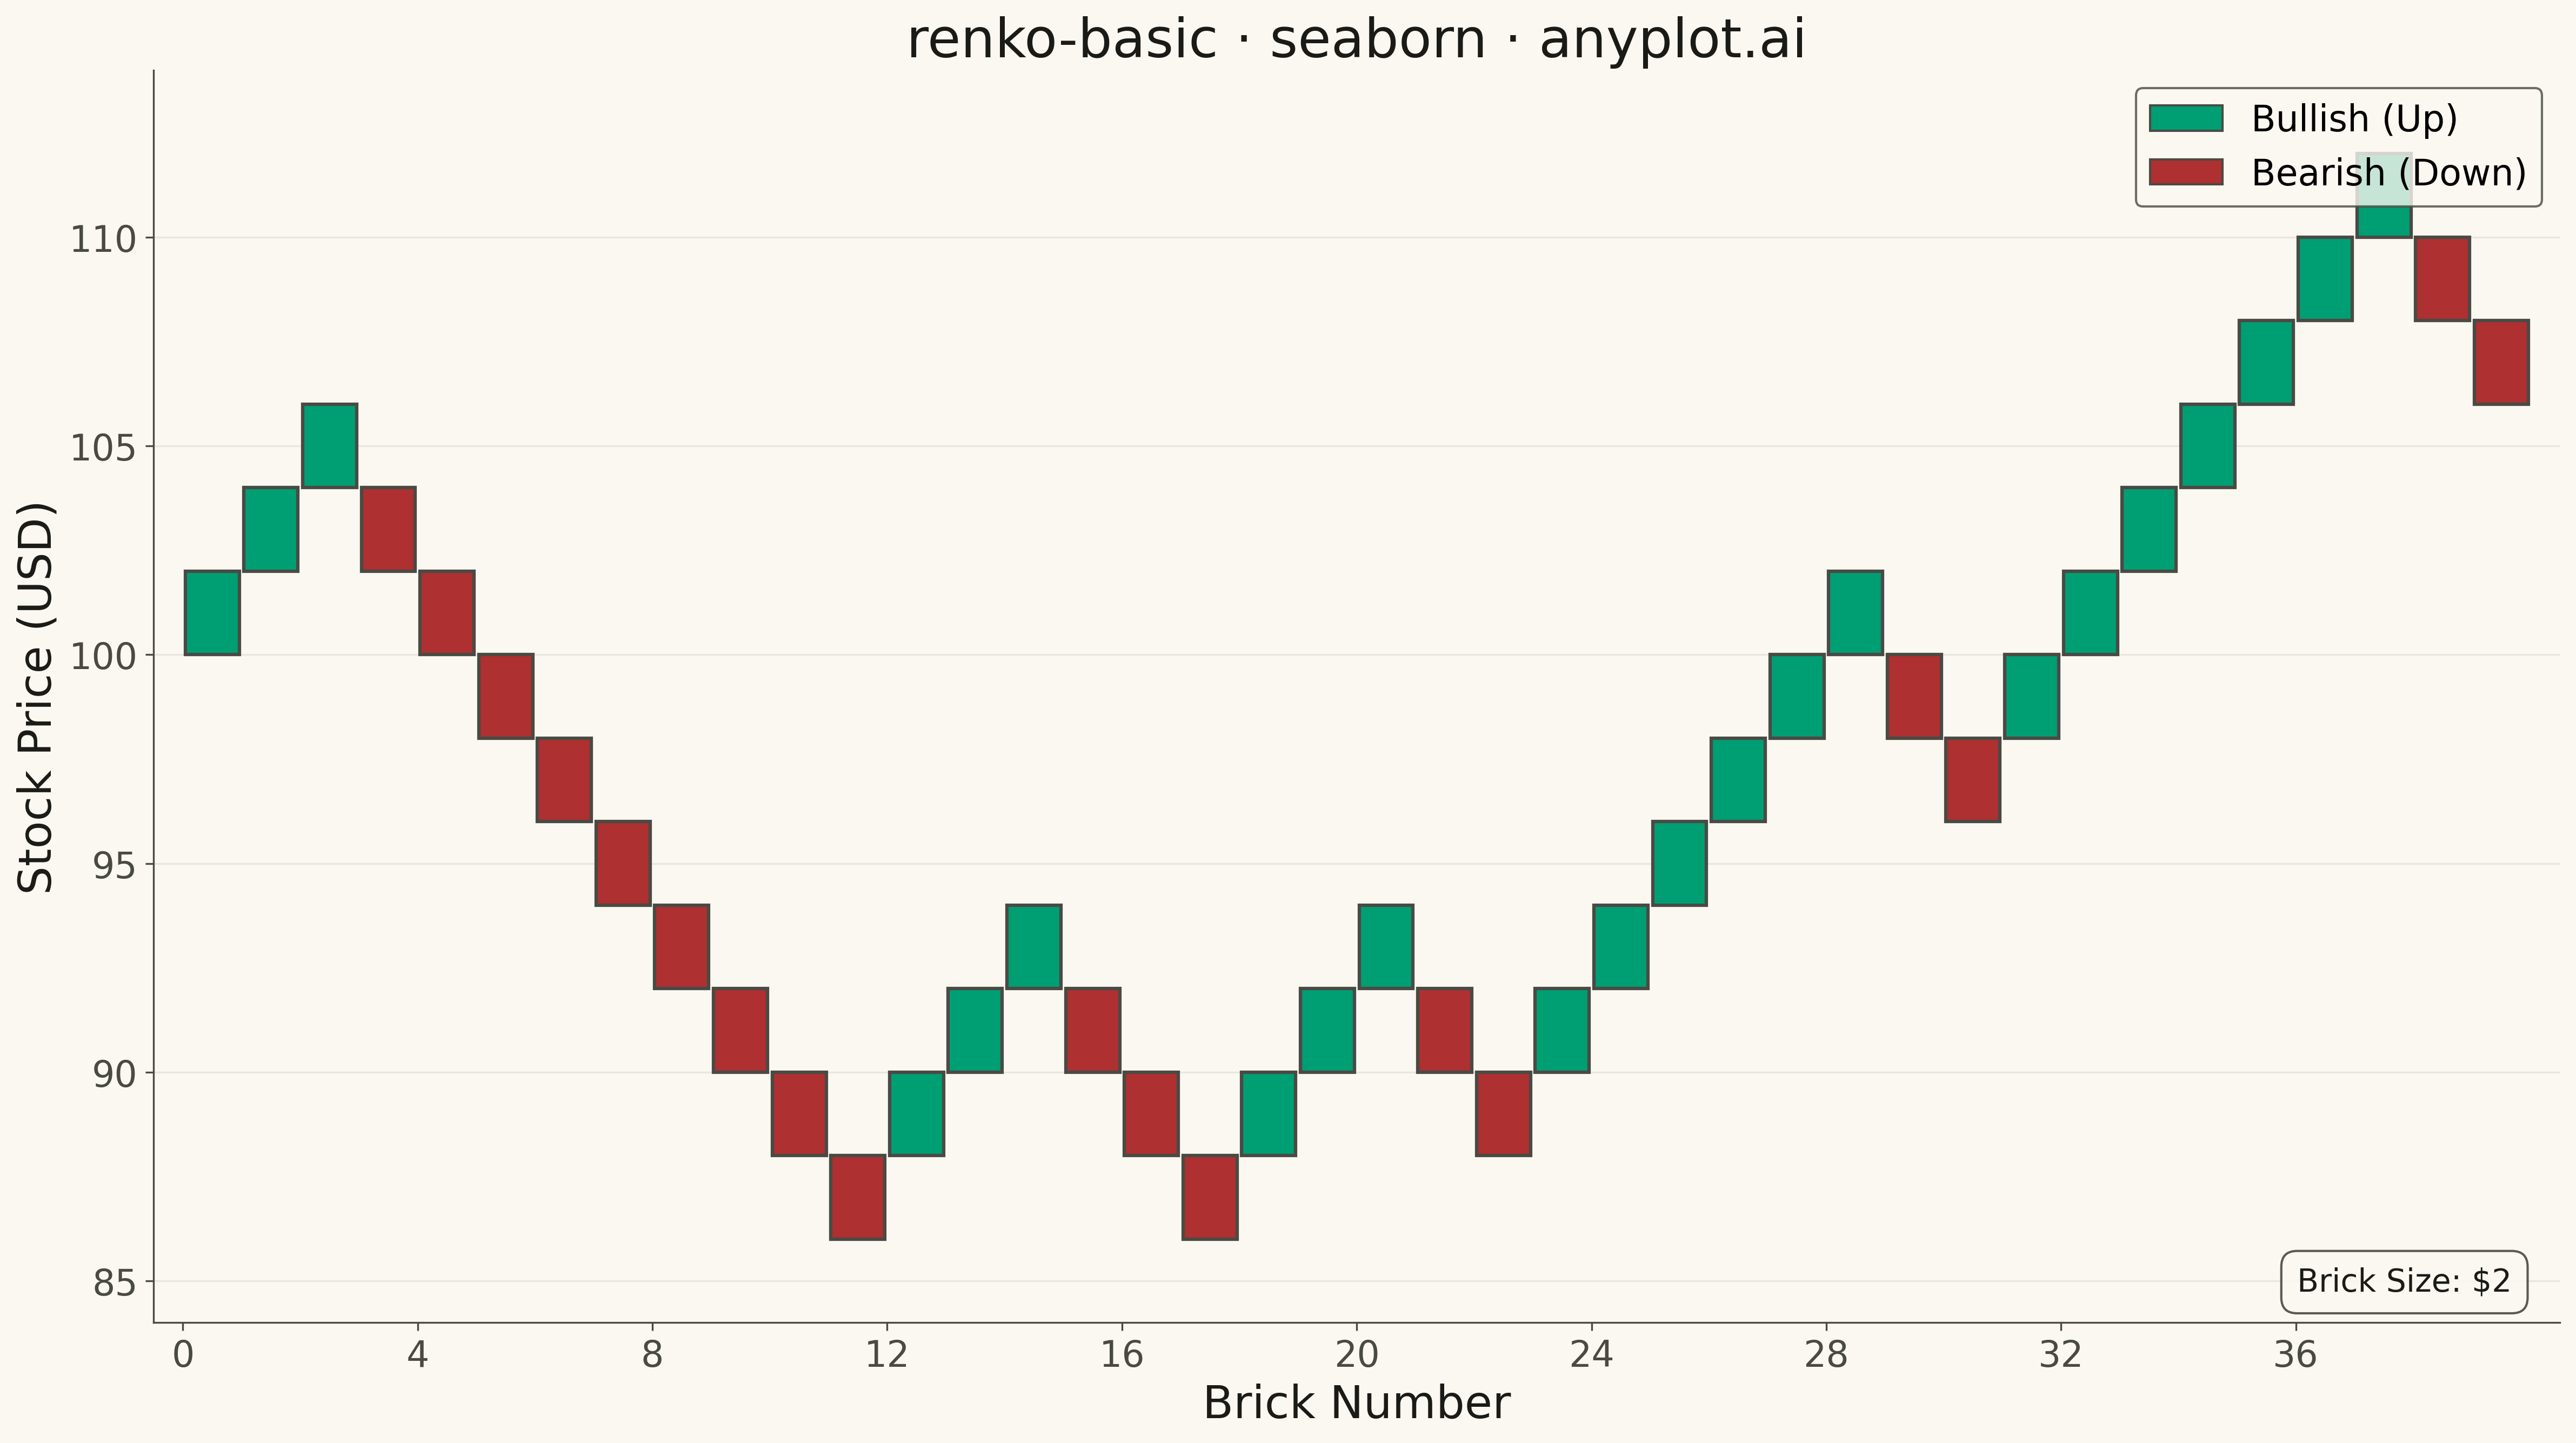
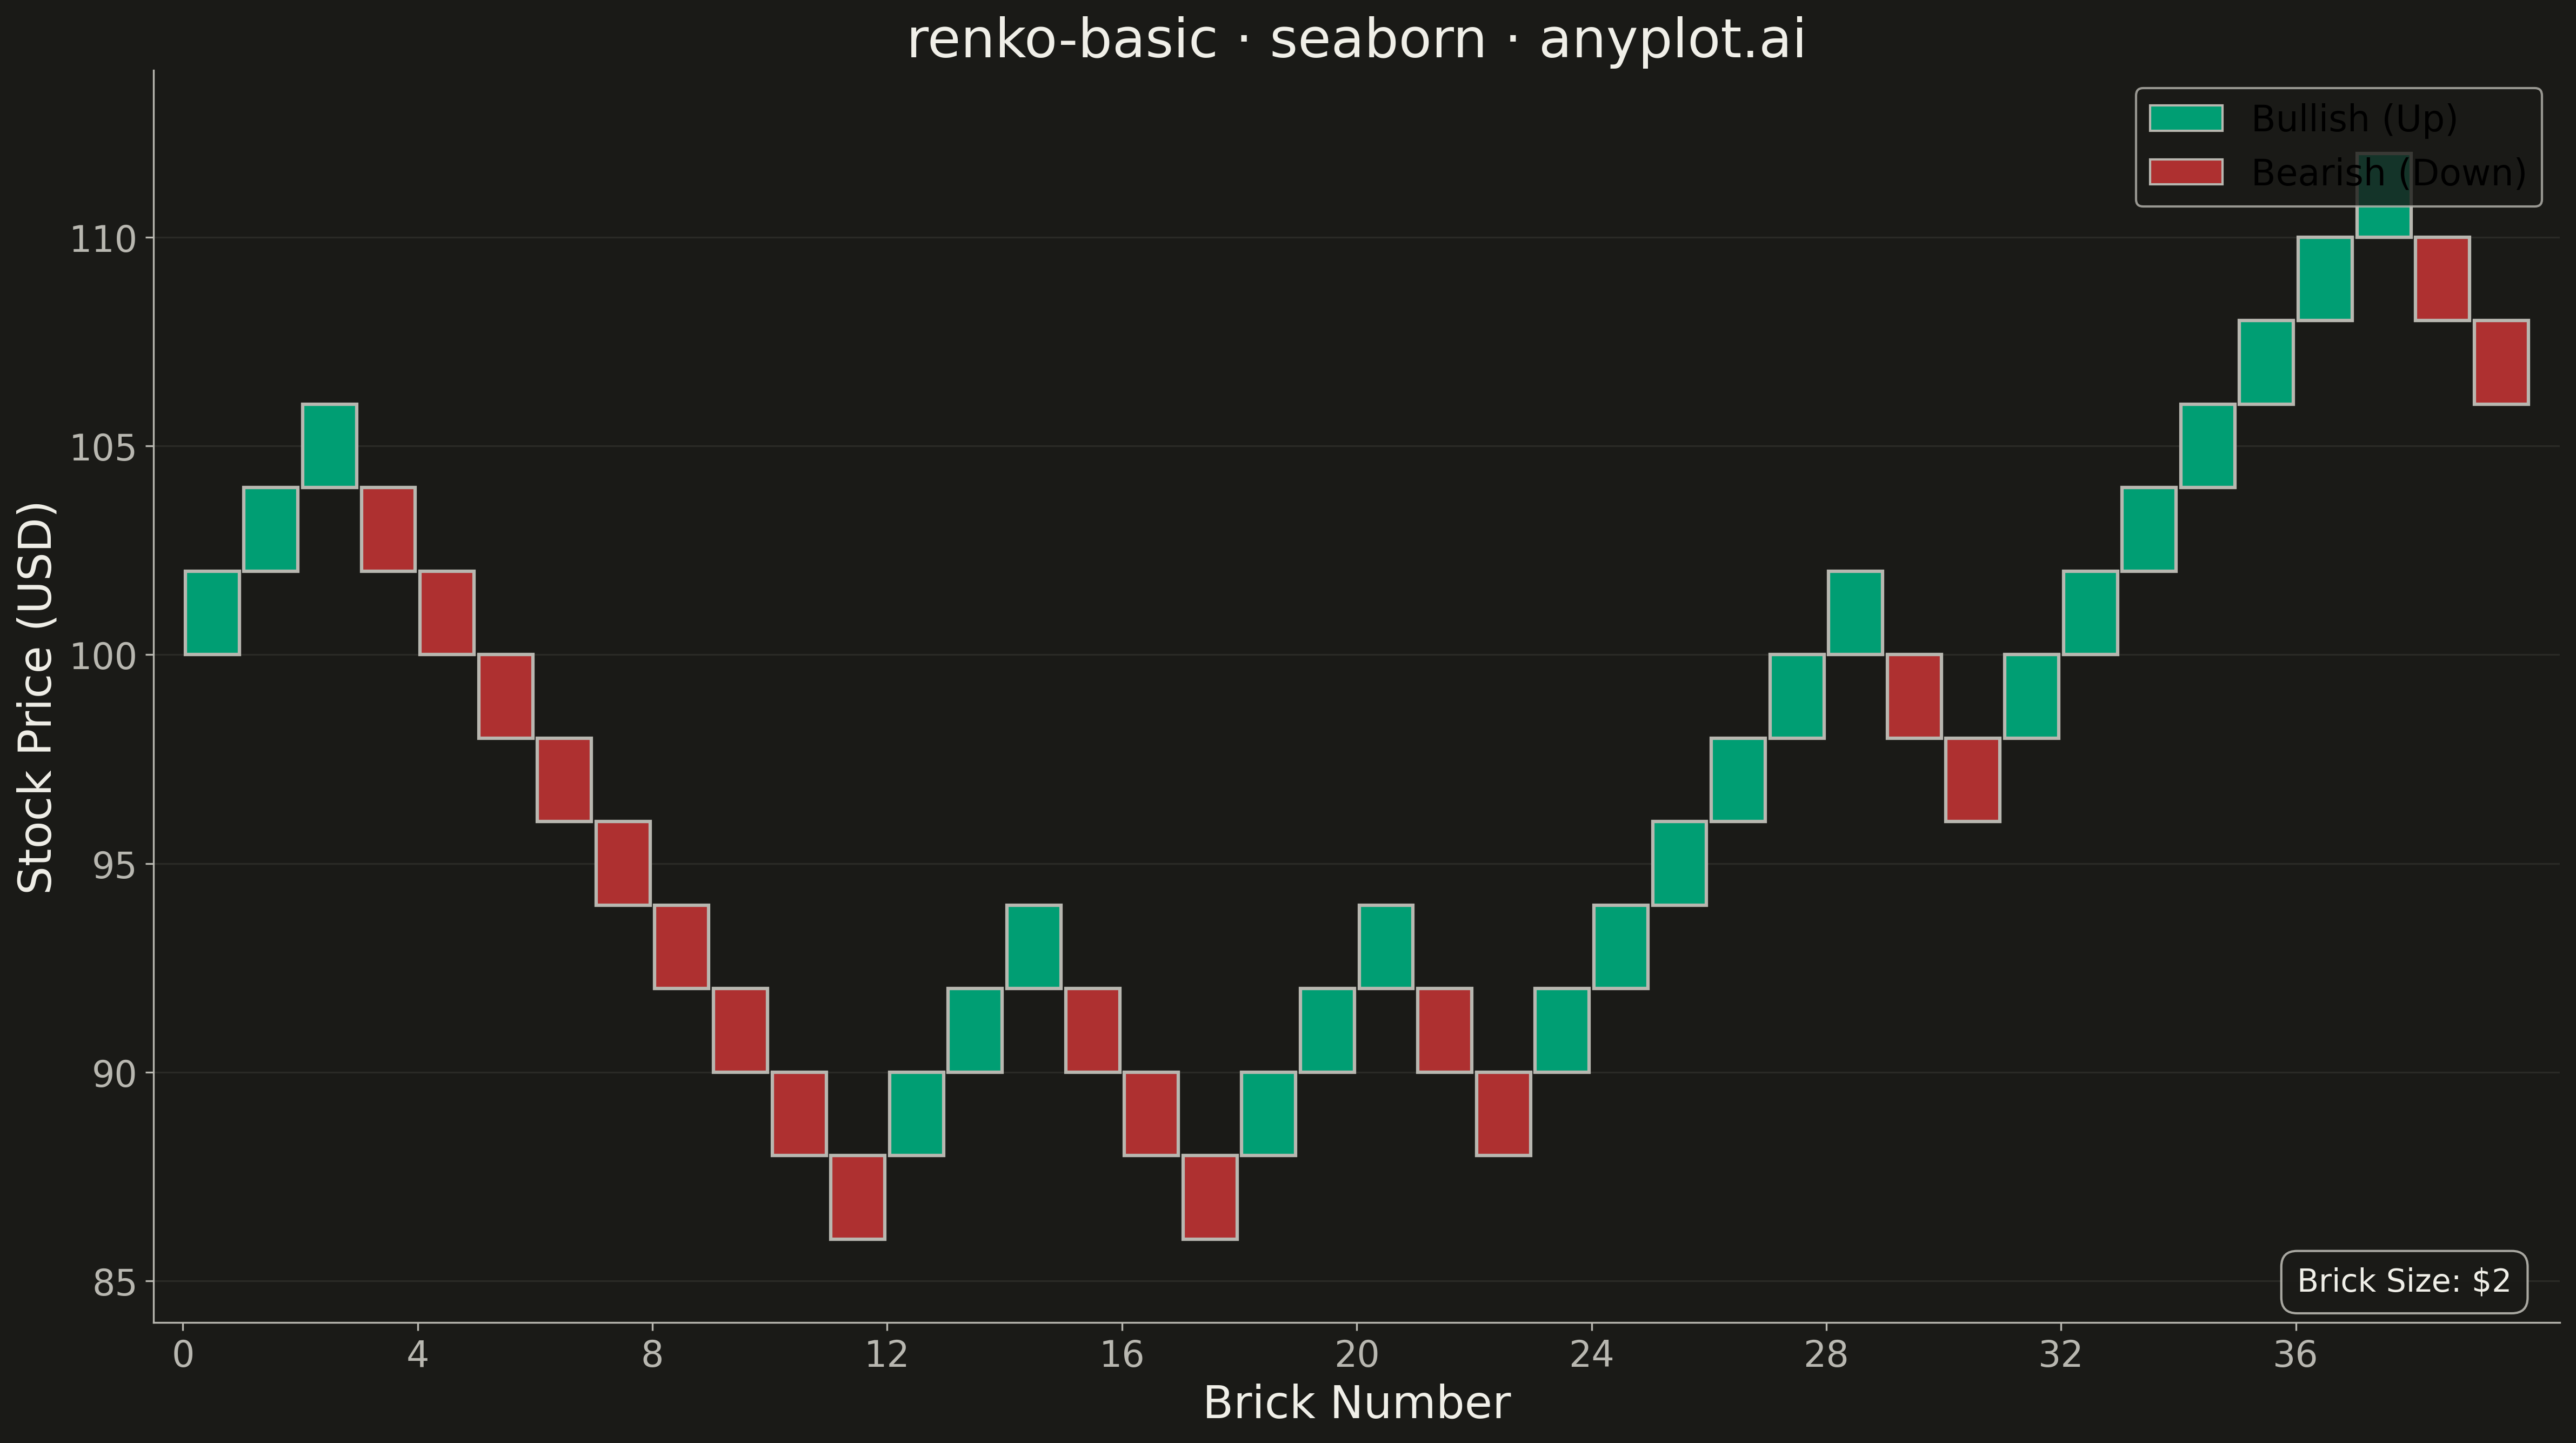
A Renko chart displays price movements using fixed-size bricks that ignore time and focus purely on price action. A new brick is drawn only when the price moves by a specified amount (brick size), filtering out market noise and minor fluctuations. Bullish bricks (price increase) and bearish bricks (price decrease) alternate direction on trend reversals, making it easy to identify trends, support/resistance levels, and potential trading signals.
""" anyplot.ai
renko-basic: Basic Renko Chart
Library: seaborn 0.13.2 | Python 3.13.13
Quality: 86/100 | Updated: 2026-05-17
"""

import os

import matplotlib.pyplot as plt
import numpy as np
import pandas as pd
from matplotlib.patches import Rectangle


# Theme tokens
THEME = os.getenv("ANYPLOT_THEME", "light")
PAGE_BG = "#FAF8F1" if THEME == "light" else "#1A1A17"
INK = "#1A1A17" if THEME == "light" else "#F0EFE8"
INK_SOFT = "#4A4A44" if THEME == "light" else "#B8B7B0"

# imprint semantic anchors
BULLISH = "#009E73"  # green — up bricks
BEARISH = "#AE3030"  # red — down bricks

# Generate synthetic stock price data
np.random.seed(42)
n_days = 250
dates = pd.date_range("2025-01-01", periods=n_days, freq="D")

# Simulate price movement with random walk
returns = np.random.normal(0.0005, 0.015, n_days)
prices = 100 * np.cumprod(1 + returns)

df = pd.DataFrame({"date": dates, "close": prices})

# Renko brick calculation
brick_size = 2.0  # $2 per brick
bricks = []

# Start from first price
current_price = df["close"].iloc[0]
brick_high = np.floor(current_price / brick_size) * brick_size
brick_low = brick_high

for price in df["close"]:
    # Check for upward bricks
    while price >= brick_high + brick_size:
        brick_high += brick_size
        brick_low = brick_high - brick_size
        bricks.append({"direction": "up", "open": brick_low, "close": brick_high})

    # Check for downward bricks
    while price <= brick_low - brick_size:
        brick_low -= brick_size
        brick_high = brick_low + brick_size
        bricks.append({"direction": "down", "open": brick_high, "close": brick_low})

renko_df = pd.DataFrame(bricks)

# Create figure
fig, ax = plt.subplots(figsize=(16, 9), facecolor=PAGE_BG)
ax.set_facecolor(PAGE_BG)

# Gap ratio for small separation between bricks
gap_ratio = 0.08
brick_width = 1.0 - gap_ratio

# Draw bricks in proper stair-step pattern
for idx, row in renko_df.iterrows():
    bottom = min(row["open"], row["close"])
    x_pos = idx + gap_ratio / 2

    if row["direction"] == "up":
        rect = Rectangle((x_pos, bottom), brick_width, brick_size, facecolor=BULLISH, edgecolor=INK_SOFT, linewidth=1.5)
    else:
        rect = Rectangle((x_pos, bottom), brick_width, brick_size, facecolor=BEARISH, edgecolor=INK_SOFT, linewidth=1.5)

    ax.add_patch(rect)

# Add legend handles
legend_handles = [
    Rectangle((0, 0), 1, 1, facecolor=BULLISH, edgecolor=INK_SOFT, label="Bullish (Up)"),
    Rectangle((0, 0), 1, 1, facecolor=BEARISH, edgecolor=INK_SOFT, label="Bearish (Down)"),
]

# Set axis limits with padding
price_min = renko_df[["open", "close"]].min().min() - brick_size
price_max = renko_df[["open", "close"]].max().max() + brick_size
ax.set_ylim(price_min, price_max)
ax.set_xlim(-0.5, len(renko_df) + 0.5)

# Labels and styling
ax.set_xlabel("Brick Number", fontsize=20, color=INK)
ax.set_ylabel("Stock Price (USD)", fontsize=20, color=INK)
ax.set_title("renko-basic · seaborn · anyplot.ai", fontsize=24, fontweight="medium", color=INK)
ax.tick_params(axis="both", labelsize=16, colors=INK_SOFT)

# Add legend positioned outside plot area
ax.legend(handles=legend_handles, fontsize=16, loc="upper right", frameon=True, facecolor=PAGE_BG, edgecolor=INK_SOFT)

# Add subtle grid on y-axis only
ax.grid(True, alpha=0.10, linestyle="-", axis="y", linewidth=0.8, color=INK_SOFT)
ax.set_axisbelow(True)

# Simplify x-axis ticks for cleaner look
tick_step = max(1, len(renko_df) // 10)
ax.set_xticks(range(0, len(renko_df), tick_step))

# Spine styling
ax.spines["top"].set_visible(False)
ax.spines["right"].set_visible(False)
ax.spines["left"].set_color(INK_SOFT)
ax.spines["bottom"].set_color(INK_SOFT)

# Add annotation about brick size
ax.annotate(
    f"Brick Size: ${brick_size:.0f}",
    xy=(0.98, 0.02),
    xycoords="axes fraction",
    fontsize=14,
    color=INK,
    ha="right",
    va="bottom",
    bbox={"boxstyle": "round,pad=0.5", "facecolor": PAGE_BG, "edgecolor": INK_SOFT, "alpha": 0.9},
)

plt.tight_layout()
plt.savefig(f"plot-{THEME}.png", dpi=300, bbox_inches="tight", facecolor=PAGE_BG)
Runnable source as JSON, for any HTTP client: https://api.anyplot.ai/specs/renko-basic/seaborn/code. Any spec id and library id listed in llms-full.txt fit the same URL shape; every URL below is complete and callable.
{
  "spec_id": "renko-basic",
  "language": "python",
  "library": "seaborn",
  "page": "https://anyplot.ai/renko-basic/python/seaborn",
  "hub": "https://anyplot.ai/renko-basic",
  "code_json": "https://api.anyplot.ai/specs/renko-basic/seaborn/code",
  "spec_json": "https://api.anyplot.ai/specs/renko-basic",
  "render_light_png": "https://storage.googleapis.com/anyplot-images/plots/renko-basic/python/seaborn/plot-light.png",
  "render_dark_png": "https://storage.googleapis.com/anyplot-images/plots/renko-basic/python/seaborn/plot-dark.png",
  "quality_score": 86.0,
  "license": "MIT",
  "guide": "https://anyplot.ai/llms.txt"
}
Part of Basic Renko Chart on anyplot.ai.