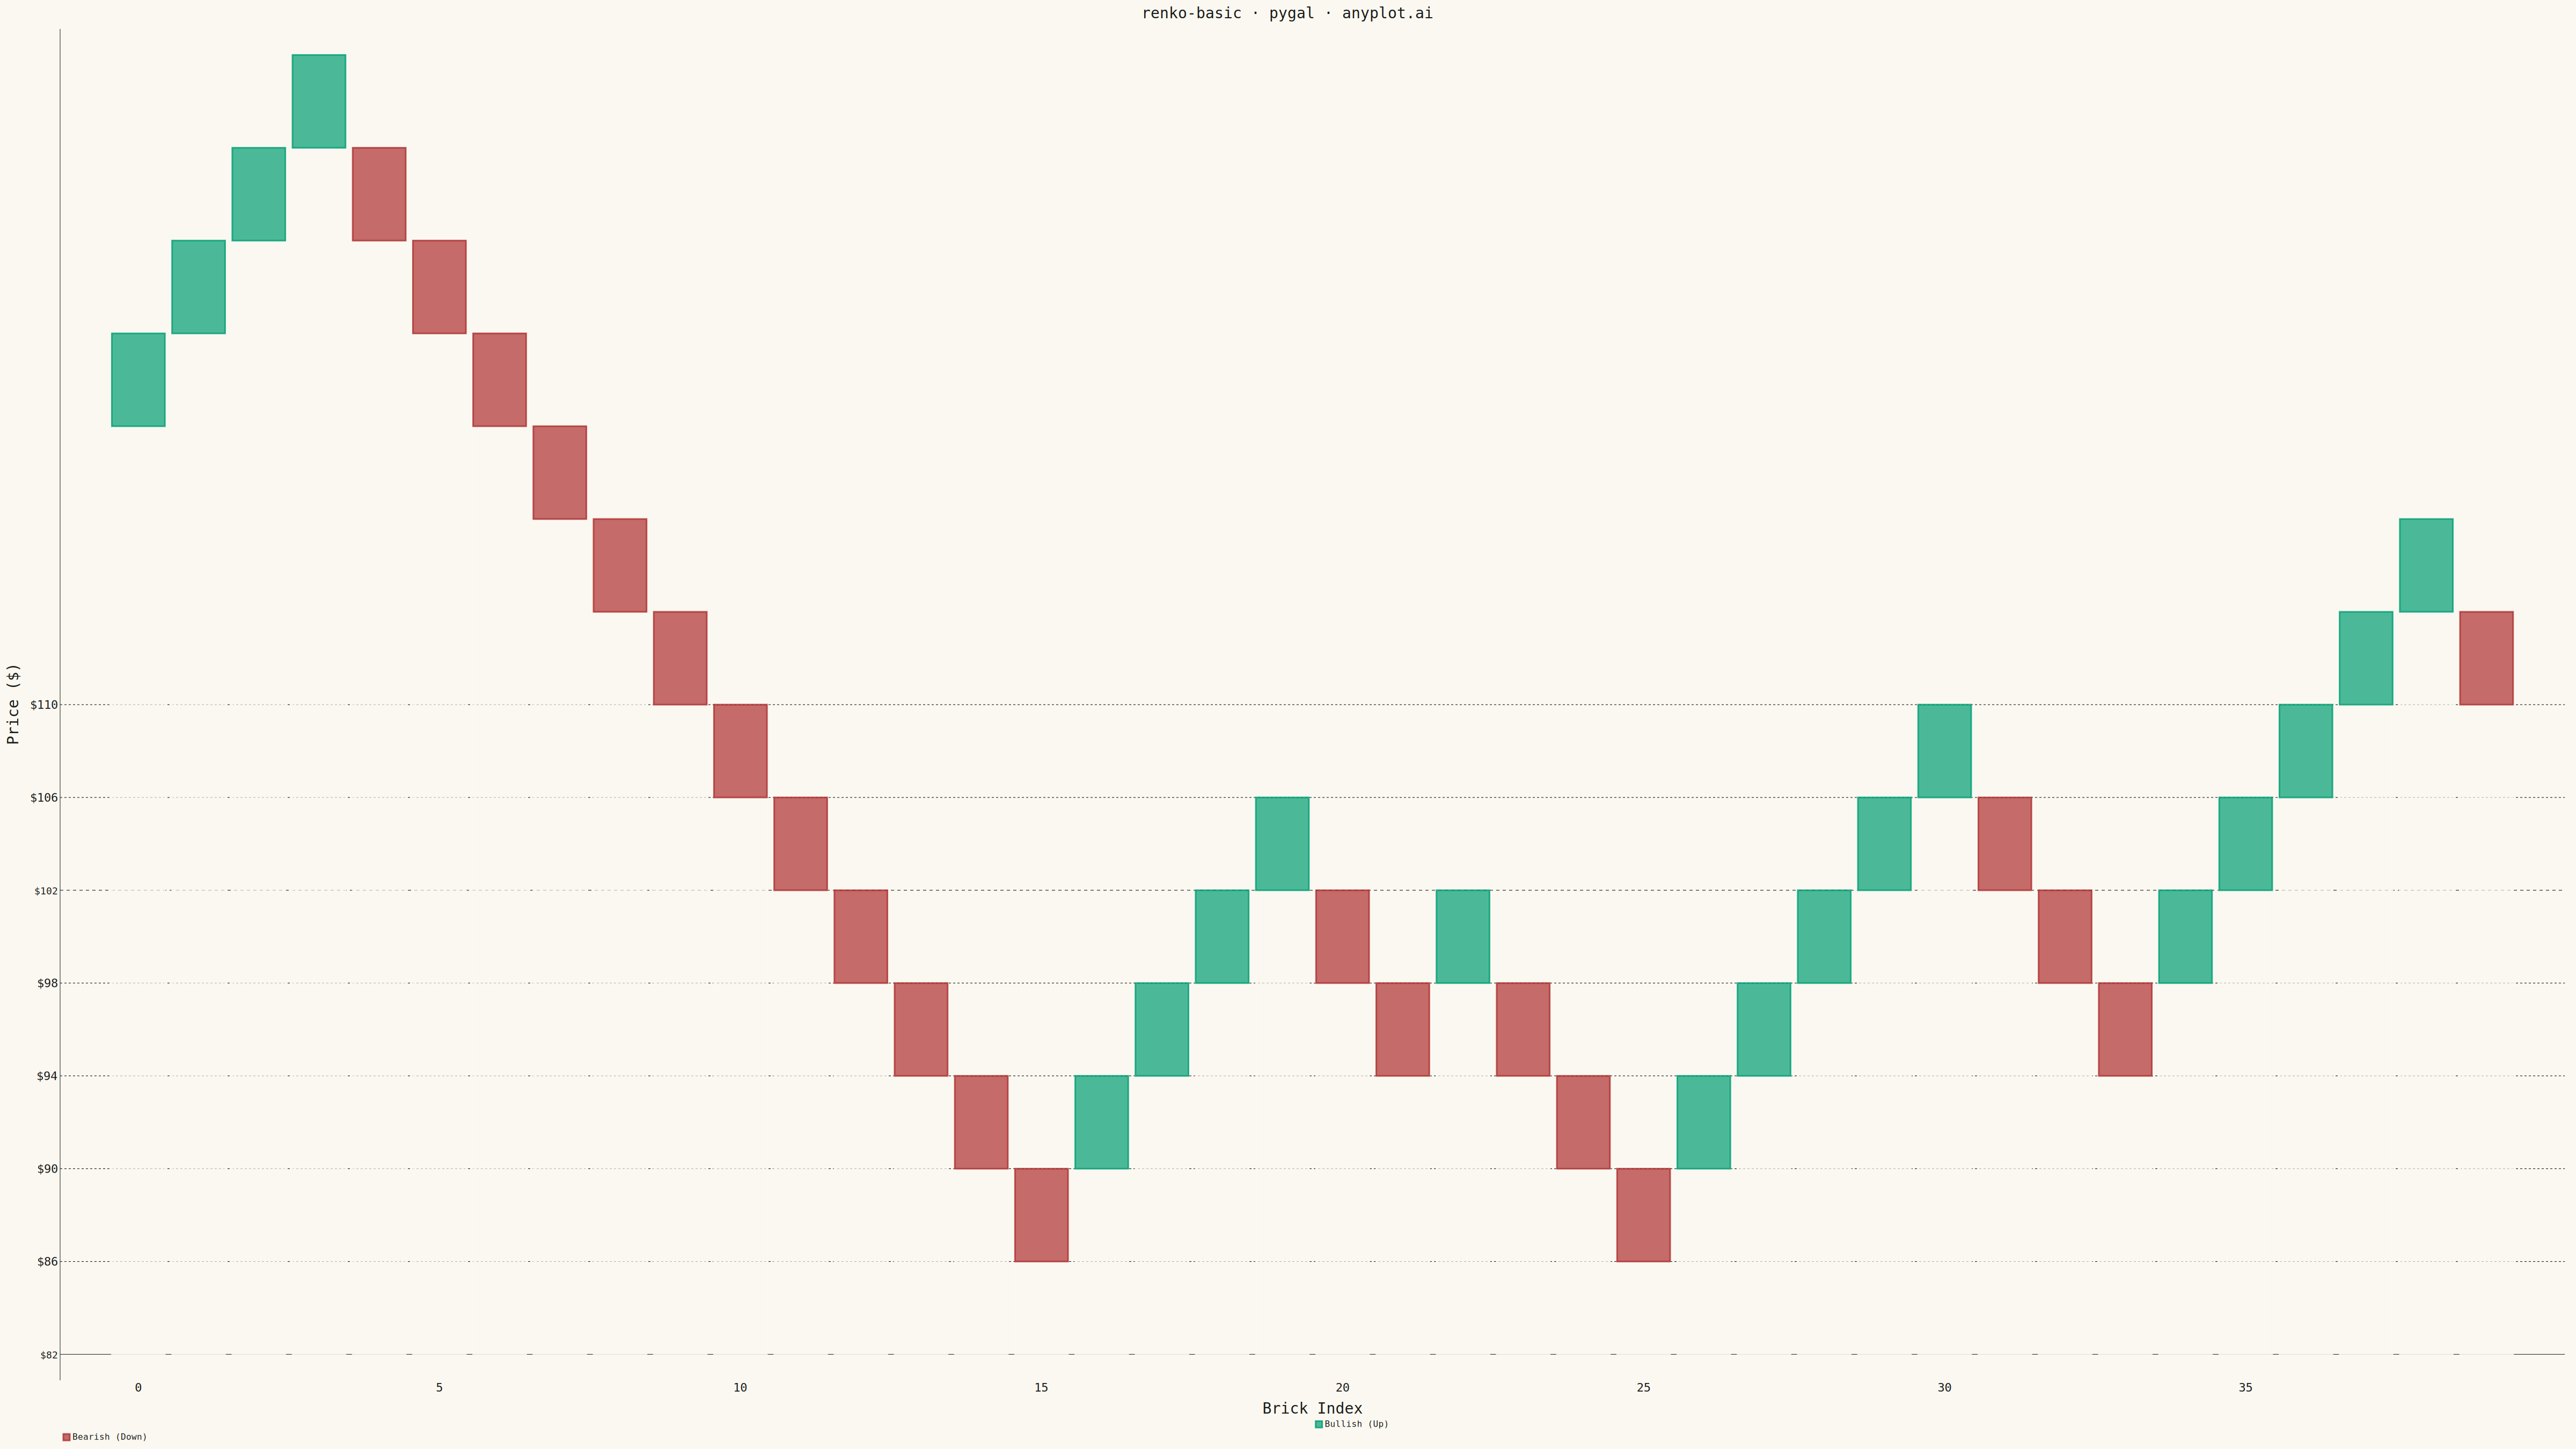
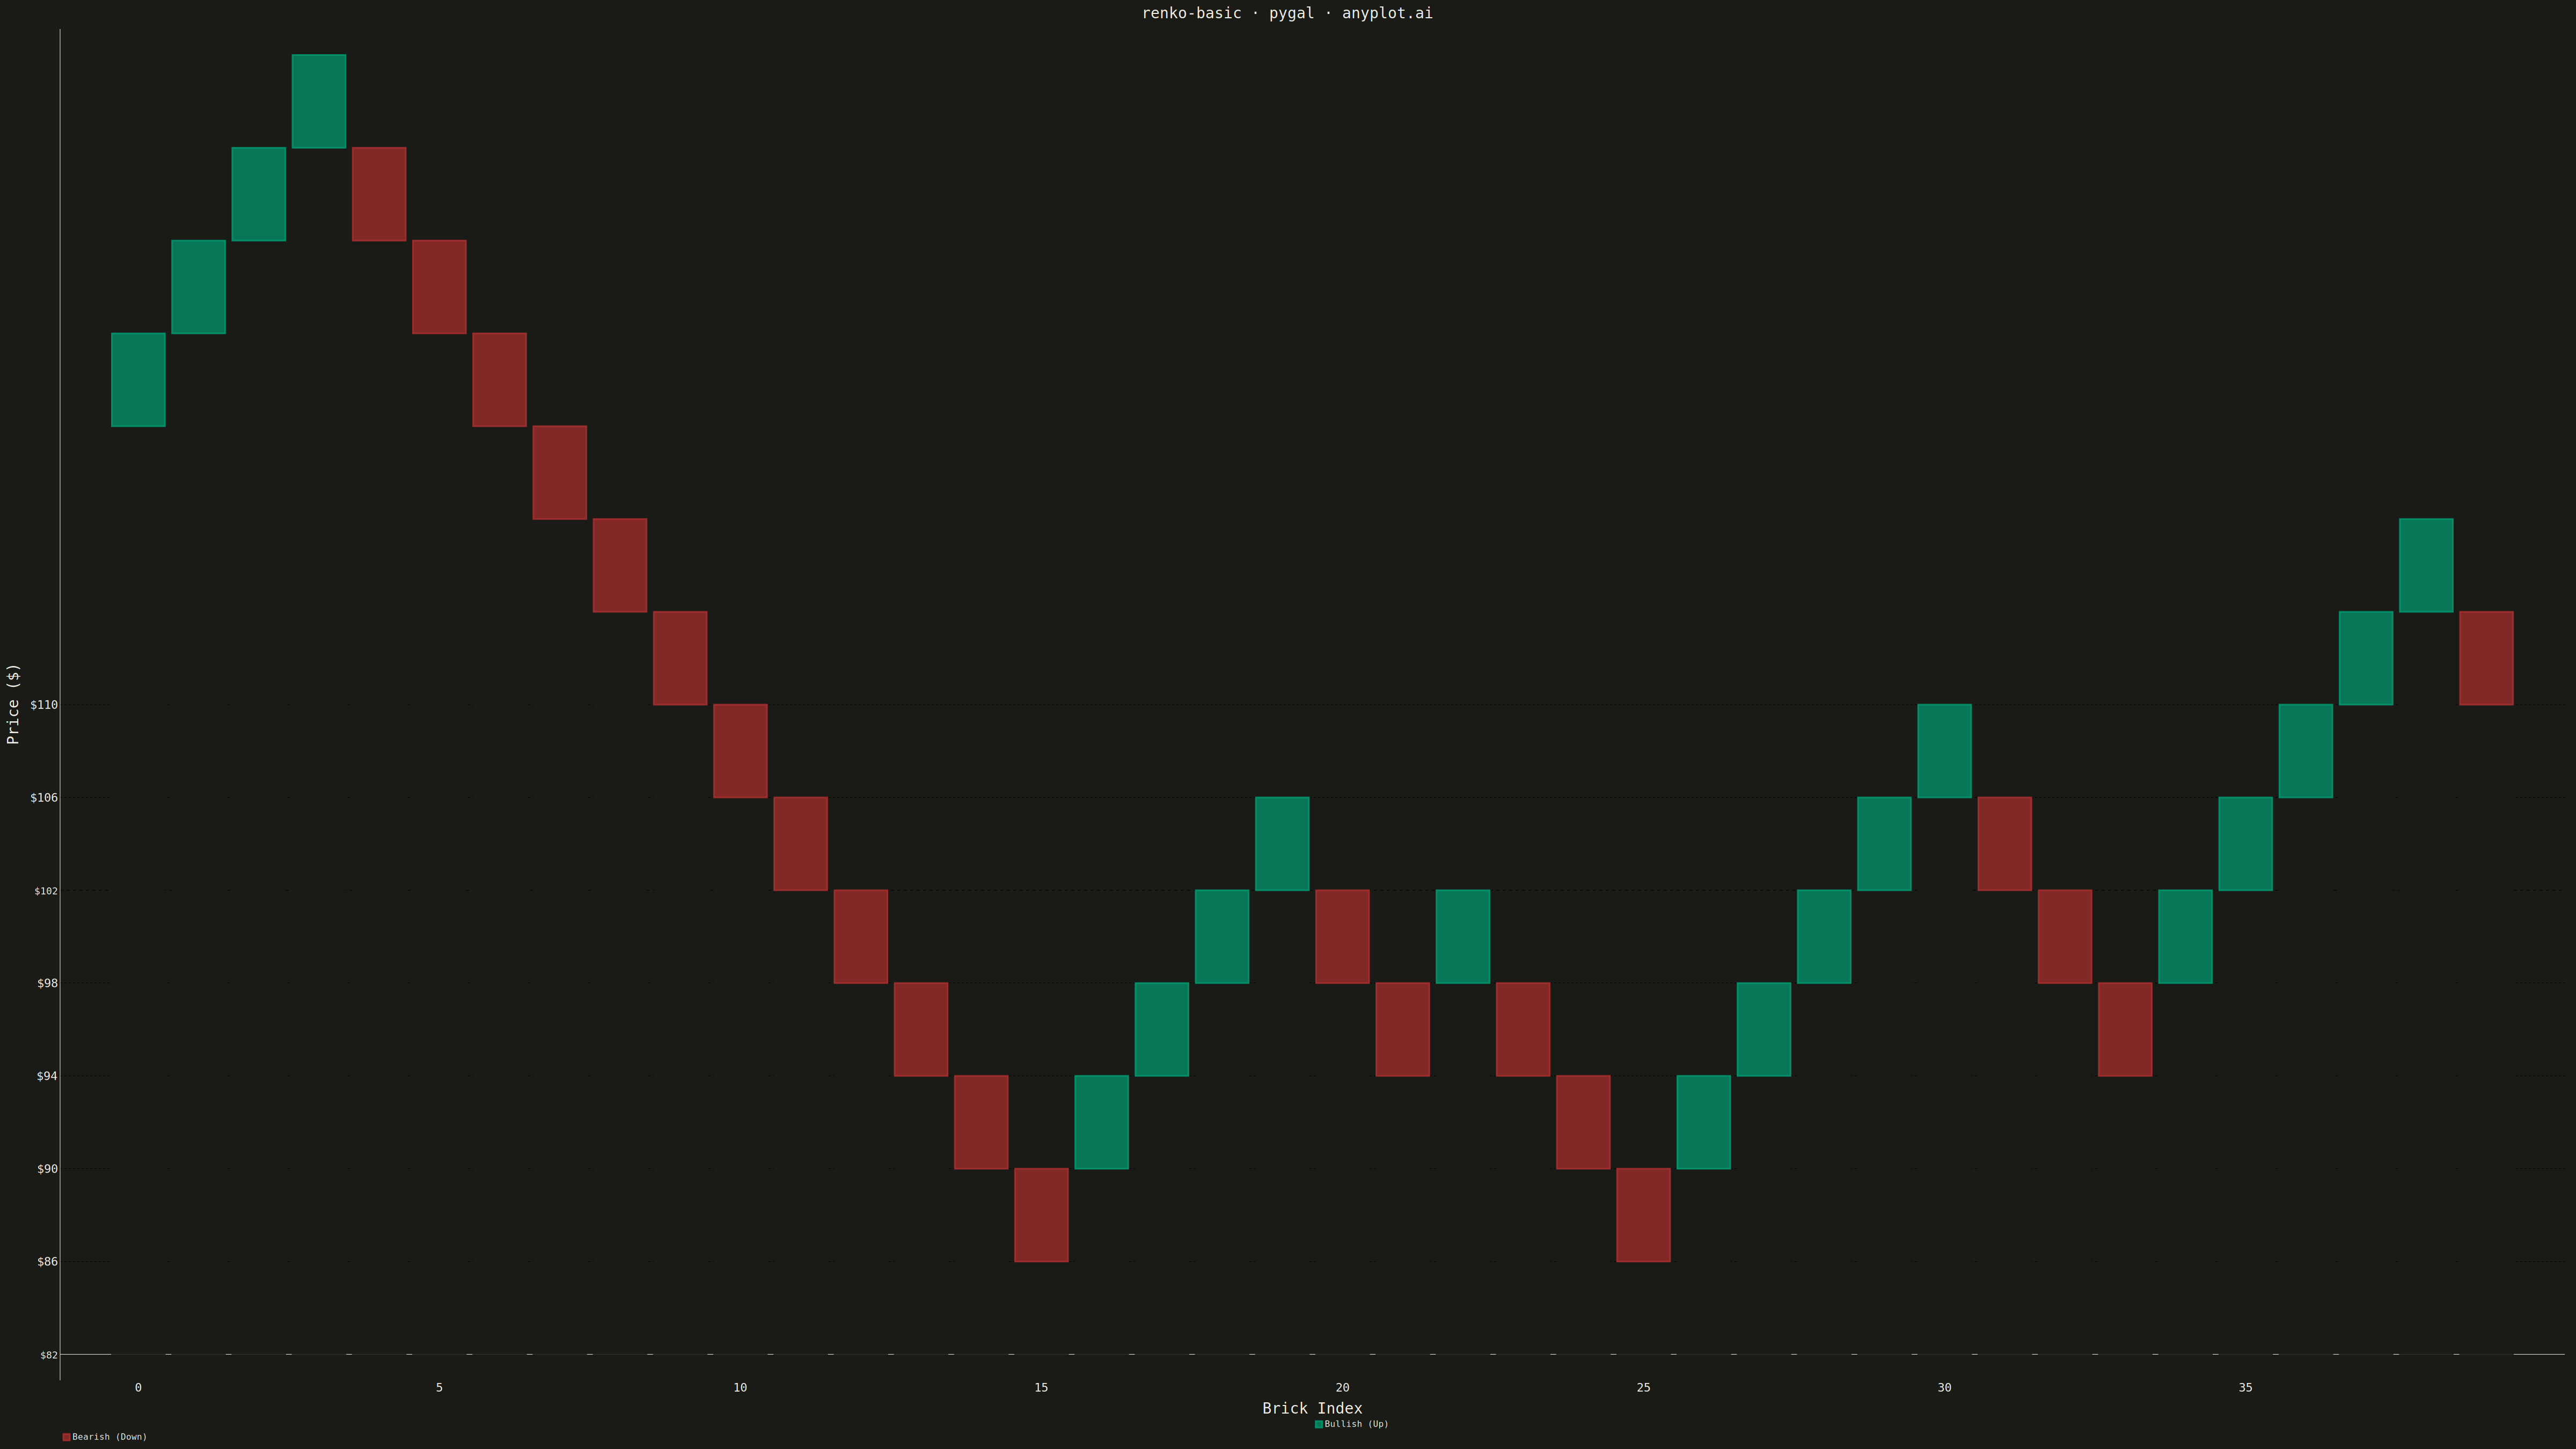
A Renko chart displays price movements using fixed-size bricks that ignore time and focus purely on price action. A new brick is drawn only when the price moves by a specified amount (brick size), filtering out market noise and minor fluctuations. Bullish bricks (price increase) and bearish bricks (price decrease) alternate direction on trend reversals, making it easy to identify trends, support/resistance levels, and potential trading signals.
""" anyplot.ai
renko-basic: Basic Renko Chart
Library: pygal 3.1.0 | Python 3.13.13
Quality: 92/100 | Updated: 2026-05-17
"""

import os

import numpy as np
import pygal
from pygal.style import Style


np.random.seed(42)

# Theme tokens
THEME = os.getenv("ANYPLOT_THEME", "light")
PAGE_BG = "#FAF8F1" if THEME == "light" else "#1A1A17"
INK = "#1A1A17" if THEME == "light" else "#F0EFE8"
INK_SOFT = "#4A4A44" if THEME == "light" else "#B8B7B0"
INK_MUTED = "#6B6A63" if THEME == "light" else "#A8A79F"

# imprint semantic anchors: bullish (up) uses #009E73 green, bearish (down) uses #AE3030 red
BULLISH = "#009E73"  # Okabe-Ito position 1 (brand green)
BEARISH = "#AE3030"  # imprint red — bearish

# Generate synthetic stock price data (6 months of daily closes)
n_days = 180
initial_price = 100
returns = np.random.normal(0.001, 0.02, n_days)
prices = initial_price * np.cumprod(1 + returns)

# Renko brick calculation
brick_size = 2.0

# Build Renko bricks from price data
bricks = []
current_brick_price = round(prices[0] / brick_size) * brick_size
direction = None

for price in prices:
    while True:
        if direction is None:
            if price >= current_brick_price + brick_size:
                bricks.append({"price": current_brick_price, "direction": "up"})
                current_brick_price += brick_size
                direction = "up"
            elif price <= current_brick_price - brick_size:
                bricks.append({"price": current_brick_price - brick_size, "direction": "down"})
                current_brick_price -= brick_size
                direction = "down"
            else:
                break
        elif direction == "up":
            if price >= current_brick_price + brick_size:
                bricks.append({"price": current_brick_price, "direction": "up"})
                current_brick_price += brick_size
            elif price <= current_brick_price - 2 * brick_size:
                current_brick_price -= brick_size
                bricks.append({"price": current_brick_price - brick_size, "direction": "down"})
                current_brick_price -= brick_size
                direction = "down"
            else:
                break
        else:
            if price <= current_brick_price - brick_size:
                bricks.append({"price": current_brick_price - brick_size, "direction": "down"})
                current_brick_price -= brick_size
            elif price >= current_brick_price + 2 * brick_size:
                current_brick_price += brick_size
                bricks.append({"price": current_brick_price, "direction": "up"})
                current_brick_price += brick_size
                direction = "up"
            else:
                break

bricks = bricks[:40] if len(bricks) > 40 else bricks

# Calculate price range
min_price = min(b["price"] for b in bricks)
max_price = max(b["price"] for b in bricks) + brick_size
y_min = min_price - brick_size
y_max = max_price + brick_size

# Custom style with theme-adaptive colors
custom_style = Style(
    background=PAGE_BG,
    plot_background=PAGE_BG,
    foreground=INK,
    foreground_strong=INK,
    foreground_subtle=INK_MUTED,
    colors=(PAGE_BG, BULLISH, BEARISH),  # Spacer (invisible), Bullish, Bearish
    title_font_size=28,
    label_font_size=22,
    major_label_font_size=18,
    legend_font_size=16,
    value_font_size=14,
    stroke_width=3,
)

# Create chart
chart = pygal.StackedBar(
    width=4800,
    height=2700,
    title="renko-basic · pygal · anyplot.ai",
    x_title="Brick Index",
    y_title="Price ($)",
    style=custom_style,
    show_legend=True,
    legend_at_bottom=True,
    show_y_guides=True,
    show_x_guides=False,
    print_values=False,
    spacing=6,
)

# Set x-axis labels (show every 5th index)
chart.x_labels = [str(i) if i % 5 == 0 else "" for i in range(len(bricks))]

# Create y-axis labels with actual price values
y_labels = []
for y in range(int(y_min), int(y_max) + 1, int(brick_size * 2)):
    y_labels.append(f"${y}")
chart.y_labels = y_labels

# Build data for stacked bar representation
spacer_values = []
up_values = []
down_values = []

for brick in bricks:
    spacer_height = brick["price"] - y_min
    spacer_values.append(spacer_height)

    if brick["direction"] == "up":
        up_values.append(brick_size)
        down_values.append(None)
    else:
        up_values.append(None)
        down_values.append(brick_size)

# Add series (spacer is invisible, then bullish and bearish)
chart.add("", spacer_values)
chart.add("Bullish (Up)", up_values)
chart.add("Bearish (Down)", down_values)

# Save outputs
chart.render_to_png(f"plot-{THEME}.png")
with open(f"plot-{THEME}.html", "wb") as f:
    f.write(chart.render())
Runnable source as JSON, for any HTTP client: https://api.anyplot.ai/specs/renko-basic/pygal/code. Any spec id and library id listed in llms-full.txt fit the same URL shape; every URL below is complete and callable.
{
  "spec_id": "renko-basic",
  "language": "python",
  "library": "pygal",
  "page": "https://anyplot.ai/renko-basic/python/pygal",
  "hub": "https://anyplot.ai/renko-basic",
  "code_json": "https://api.anyplot.ai/specs/renko-basic/pygal/code",
  "spec_json": "https://api.anyplot.ai/specs/renko-basic",
  "render_light_png": "https://storage.googleapis.com/anyplot-images/plots/renko-basic/python/pygal/plot-light.png",
  "render_dark_png": "https://storage.googleapis.com/anyplot-images/plots/renko-basic/python/pygal/plot-dark.png",
  "interactive_light_html": "https://storage.googleapis.com/anyplot-images/plots/renko-basic/python/pygal/plot-light.html",
  "interactive_dark_html": "https://storage.googleapis.com/anyplot-images/plots/renko-basic/python/pygal/plot-dark.html",
  "quality_score": 92.0,
  "license": "MIT",
  "guide": "https://anyplot.ai/llms.txt"
}
Part of Basic Renko Chart on anyplot.ai.