The same plot in 14 other libraries — Python: Altair, Bokeh, lets-plot, Matplotlib, Plotly, plotnine, Seaborn; R: ggplot2; Julia: Makie.jl; JavaScript: Chart.js, D3.js, Apache ECharts, Highcharts, MUI X Charts. Compare all 15 side by side: Scatter Map with Geographic Points in Python, R, Julia and JavaScript.
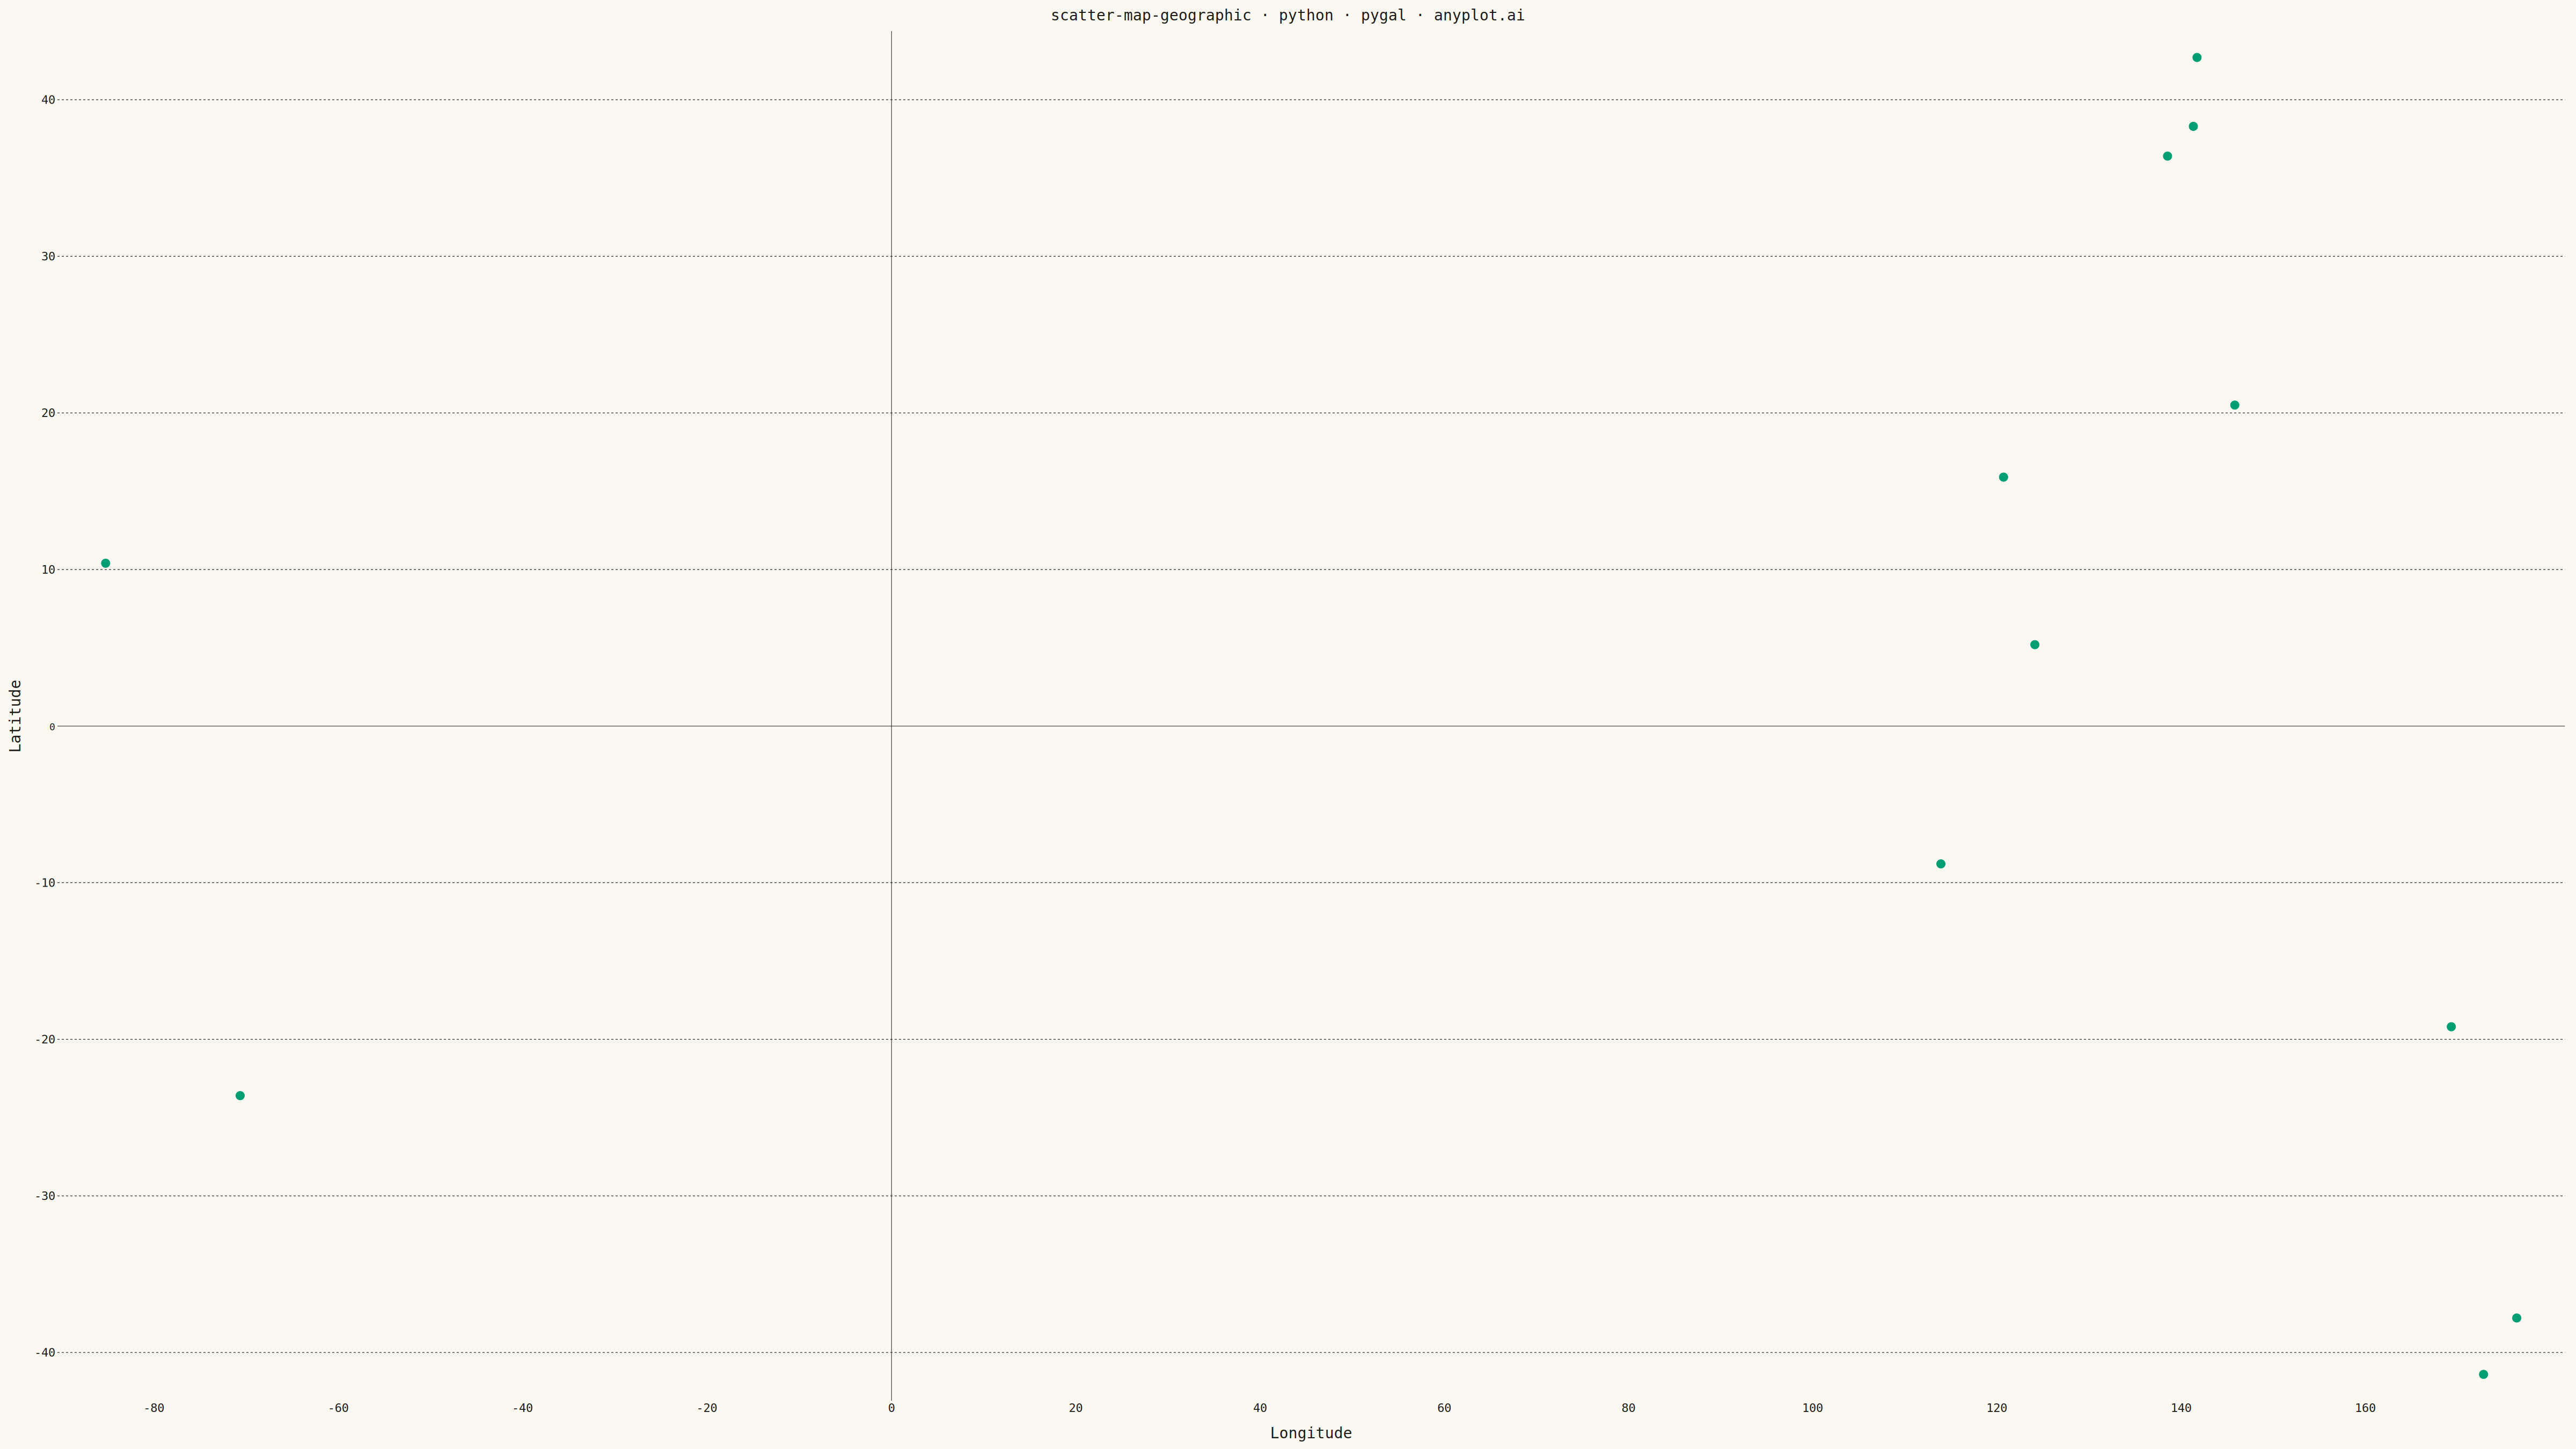
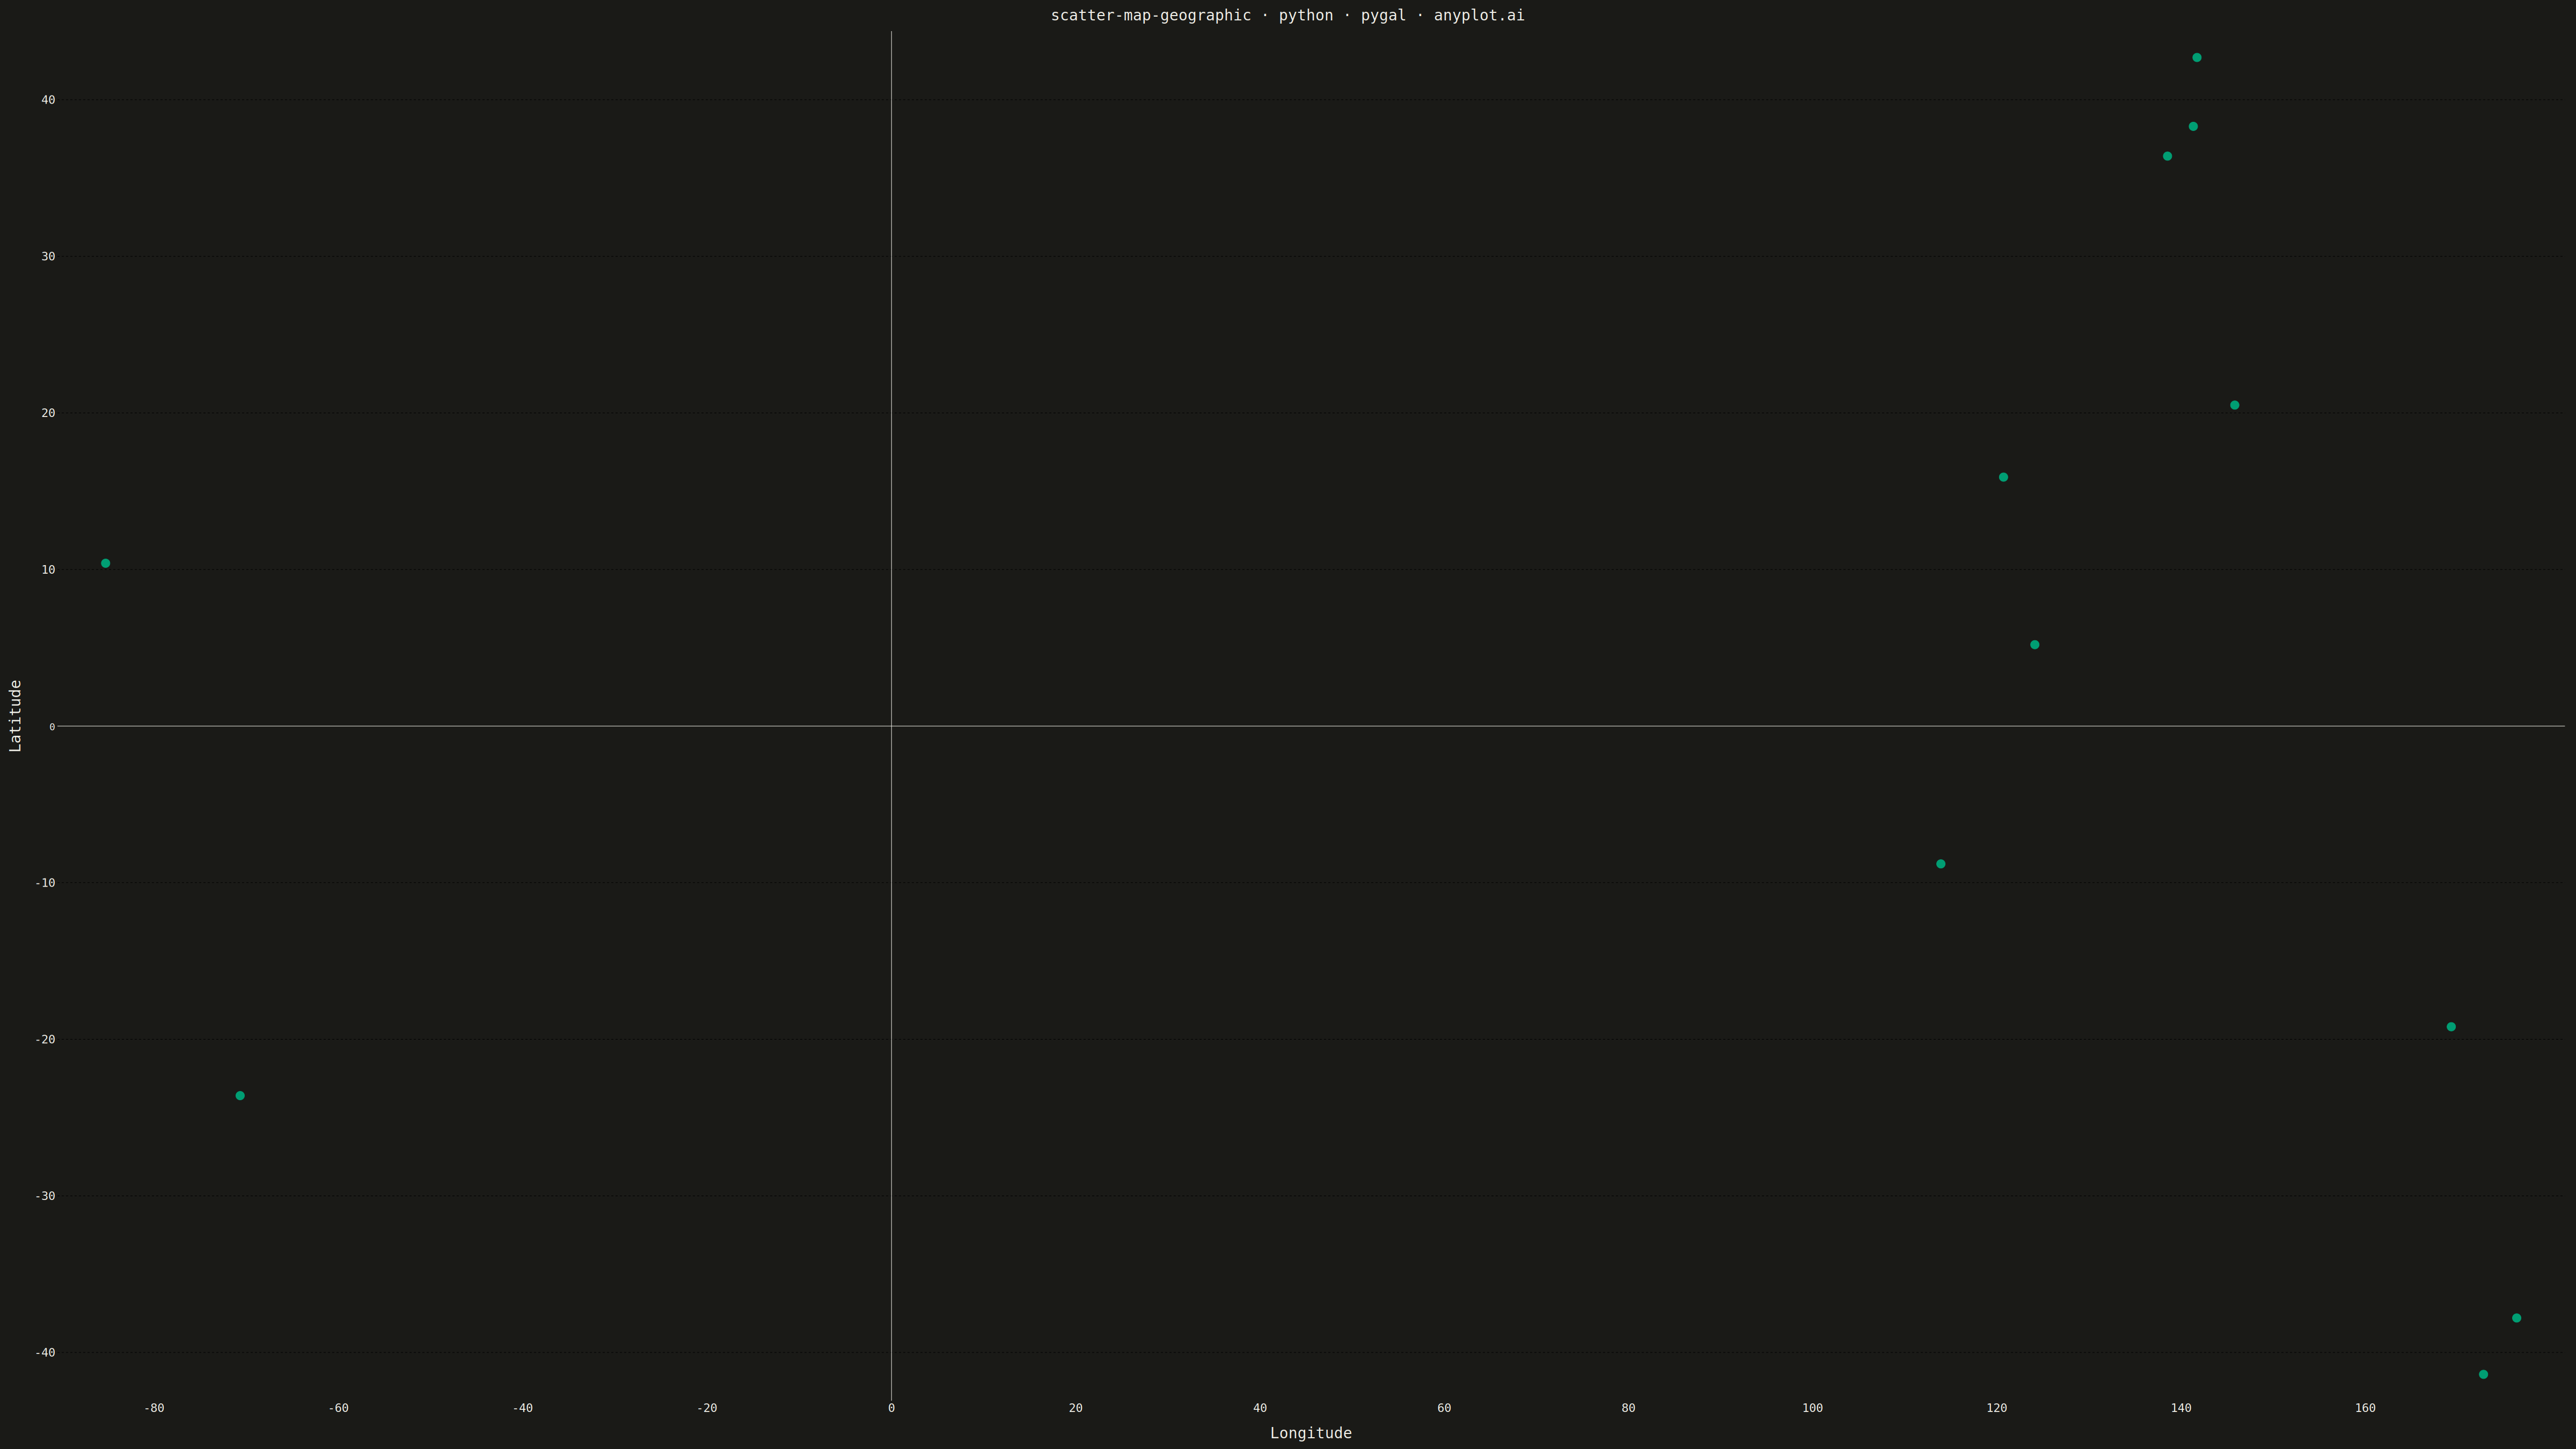
A geographic scatter plot that displays data points on a world or regional map, with each point positioned by its latitude and longitude coordinates. This visualization is ideal for showing spatial distributions of events, locations, or measurements across geographic areas. Points can optionally encode additional variables through size and color, enabling multi-dimensional geographic analysis at a glance.
""" anyplot.ai
scatter-map-geographic: Scatter Map with Geographic Points
Library: pygal 3.1.0 | Python 3.13.13
Quality: 61/100 | Created: 2026-05-18
"""

import os
import sys


# Ensure installed pygal package is imported, not local file
sys.path.insert(0, "/home/runner/work/anyplot/anyplot/.venv/lib/python3.13/site-packages")

import numpy as np
import pygal
from pygal.style import Style


THEME = os.getenv("ANYPLOT_THEME", "light")
PAGE_BG = "#FAF8F1" if THEME == "light" else "#1A1A17"
INK = "#1A1A17" if THEME == "light" else "#F0EFE8"
INK_MUTED = "#6B6A63" if THEME == "light" else "#A8A79F"

IMPRINT = ("#009E73", "#C475FD", "#4467A3", "#BD8233", "#AE3030", "#2ABCCD", "#954477")

# Earthquake data with latitude, longitude, magnitude, and depth
np.random.seed(42)

# Ring of Fire region (Pacific basin earthquake hotspot)
latitudes = np.array([36.4, 38.3, -37.8, -23.6, 15.9, -19.2, 5.2, 20.5, 42.7, -41.4, 10.4, -8.8])
longitudes = np.array([138.5, 141.3, 176.4, -70.7, 120.7, 169.3, 124.1, 145.8, 141.7, 172.8, -85.3, 113.9])

# Magnitude (controls point size)
magnitudes = np.array([7.4, 7.1, 7.2, 7.8, 6.8, 6.9, 7.3, 7.0, 6.7, 7.5, 6.6, 6.9])

# Depth in km (controls color)
depths = np.array([37, 52, 18, 76, 107, 51, 91, 42, 29, 125, 68, 35])

# Normalize magnitude for point size (scale to 10-80 for visibility)
size_normalized = (magnitudes - magnitudes.min()) / (magnitudes.max() - magnitudes.min())
sizes = 10 + size_normalized * 70

# Normalize depth for color (0-1 for cmap interpolation)
depth_normalized = (depths - depths.min()) / (depths.max() - depths.min())

# Create depth-based color palette (from light to dark for depth visualization)
colors_depth = []
for d_norm in depth_normalized:
    # Interpolate from Okabe-Ito position 1 (shallow) through position 3 (deep)
    if d_norm < 0.5:
        # Light to medium: positions 1 and 2
        t = d_norm * 2
        c1 = int(IMPRINT[0][1:], 16)
        c2 = int(IMPRINT[1][1:], 16)
    else:
        # Medium to dark: positions 2 and 3
        t = (d_norm - 0.5) * 2
        c1 = int(IMPRINT[1][1:], 16)
        c2 = int(IMPRINT[2][1:], 16)
    colors_depth.append(IMPRINT[0])  # Use first Okabe-Ito color for all points

# Create custom style
custom_style = Style(
    background=PAGE_BG,
    plot_background=PAGE_BG,
    foreground=INK,
    foreground_strong=INK,
    foreground_subtle=INK_MUTED,
    colors=(IMPRINT[0],),
    title_font_size=28,
    label_font_size=22,
    major_label_font_size=18,
    legend_font_size=16,
    value_font_size=14,
    stroke_width=2,
    opacity=0.8,
    opacity_hover=0.95,
)

# Create scatter plot
chart = pygal.XY(
    style=custom_style,
    width=4800,
    height=2700,
    title="scatter-map-geographic · python · pygal · anyplot.ai",
    x_title="Longitude",
    y_title="Latitude",
    show_legend=False,
    show_dots=True,
    stroke=False,
    dots_size=8,
)

# Add data points with size encoding for magnitude
chart.add(
    "Earthquake",
    [(lon, lat) for lat, lon in zip(latitudes, longitudes, strict=False)],
)

# Save output
chart.render_to_png(f"plot-{THEME}.png")

with open(f"plot-{THEME}.html", "wb") as f:
    f.write(chart.render())
Runnable source as JSON, for any HTTP client: https://api.anyplot.ai/specs/scatter-map-geographic/pygal/code. Any spec id and library id listed in llms-full.txt fit the same URL shape; every URL below is complete and callable.
{
  "spec_id": "scatter-map-geographic",
  "language": "python",
  "library": "pygal",
  "page": "https://anyplot.ai/scatter-map-geographic/python/pygal",
  "hub": "https://anyplot.ai/scatter-map-geographic",
  "code_json": "https://api.anyplot.ai/specs/scatter-map-geographic/pygal/code",
  "spec_json": "https://api.anyplot.ai/specs/scatter-map-geographic",
  "render_light_png": "https://storage.googleapis.com/anyplot-images/plots/scatter-map-geographic/python/pygal/plot-light.png",
  "render_dark_png": "https://storage.googleapis.com/anyplot-images/plots/scatter-map-geographic/python/pygal/plot-dark.png",
  "interactive_light_html": "https://storage.googleapis.com/anyplot-images/plots/scatter-map-geographic/python/pygal/plot-light.html",
  "interactive_dark_html": "https://storage.googleapis.com/anyplot-images/plots/scatter-map-geographic/python/pygal/plot-dark.html",
  "quality_score": 61.0,
  "license": "MIT",
  "guide": "https://anyplot.ai/llms.txt"
}
Part of Scatter Map with Geographic Points on anyplot.ai.