The same plot in 14 other libraries — Python: Altair, Bokeh, lets-plot, Matplotlib, Plotly, plotnine, Pygal, Seaborn; Julia: Makie.jl; JavaScript: Chart.js, D3.js, Apache ECharts, Highcharts, MUI X Charts. Compare all 15 side by side: Scatter Map with Geographic Points in Python, R, Julia and JavaScript.
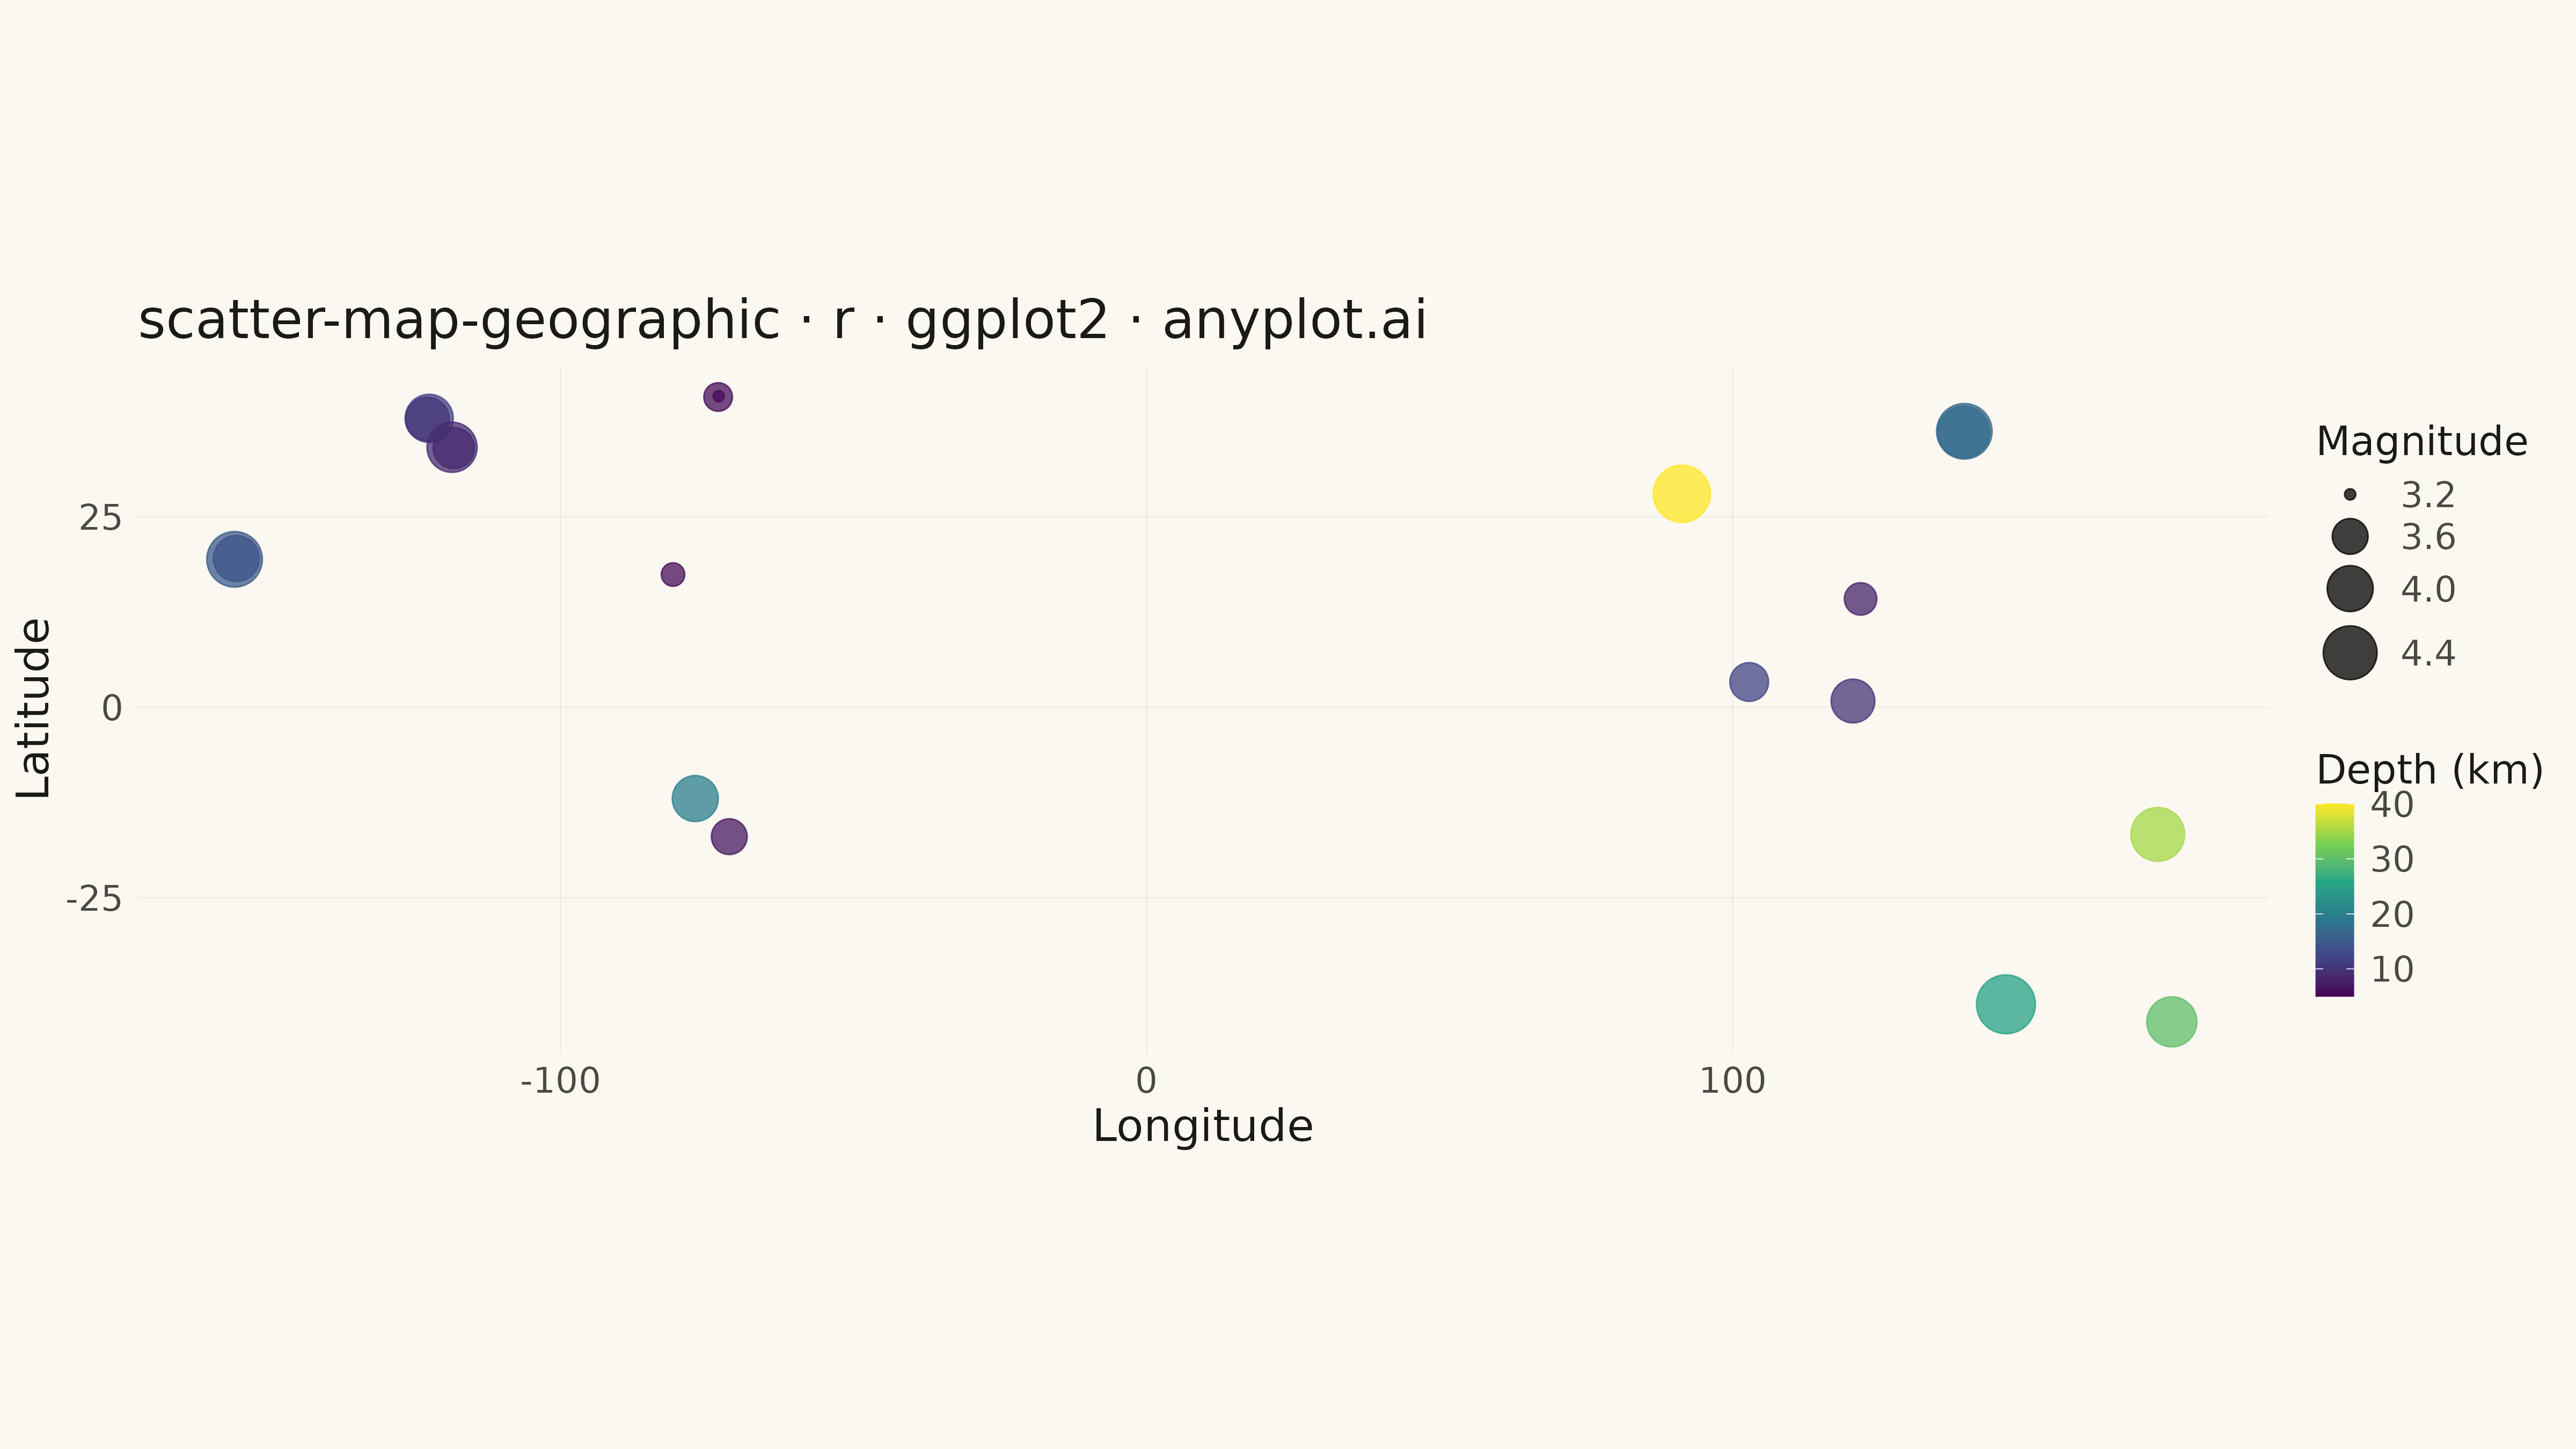
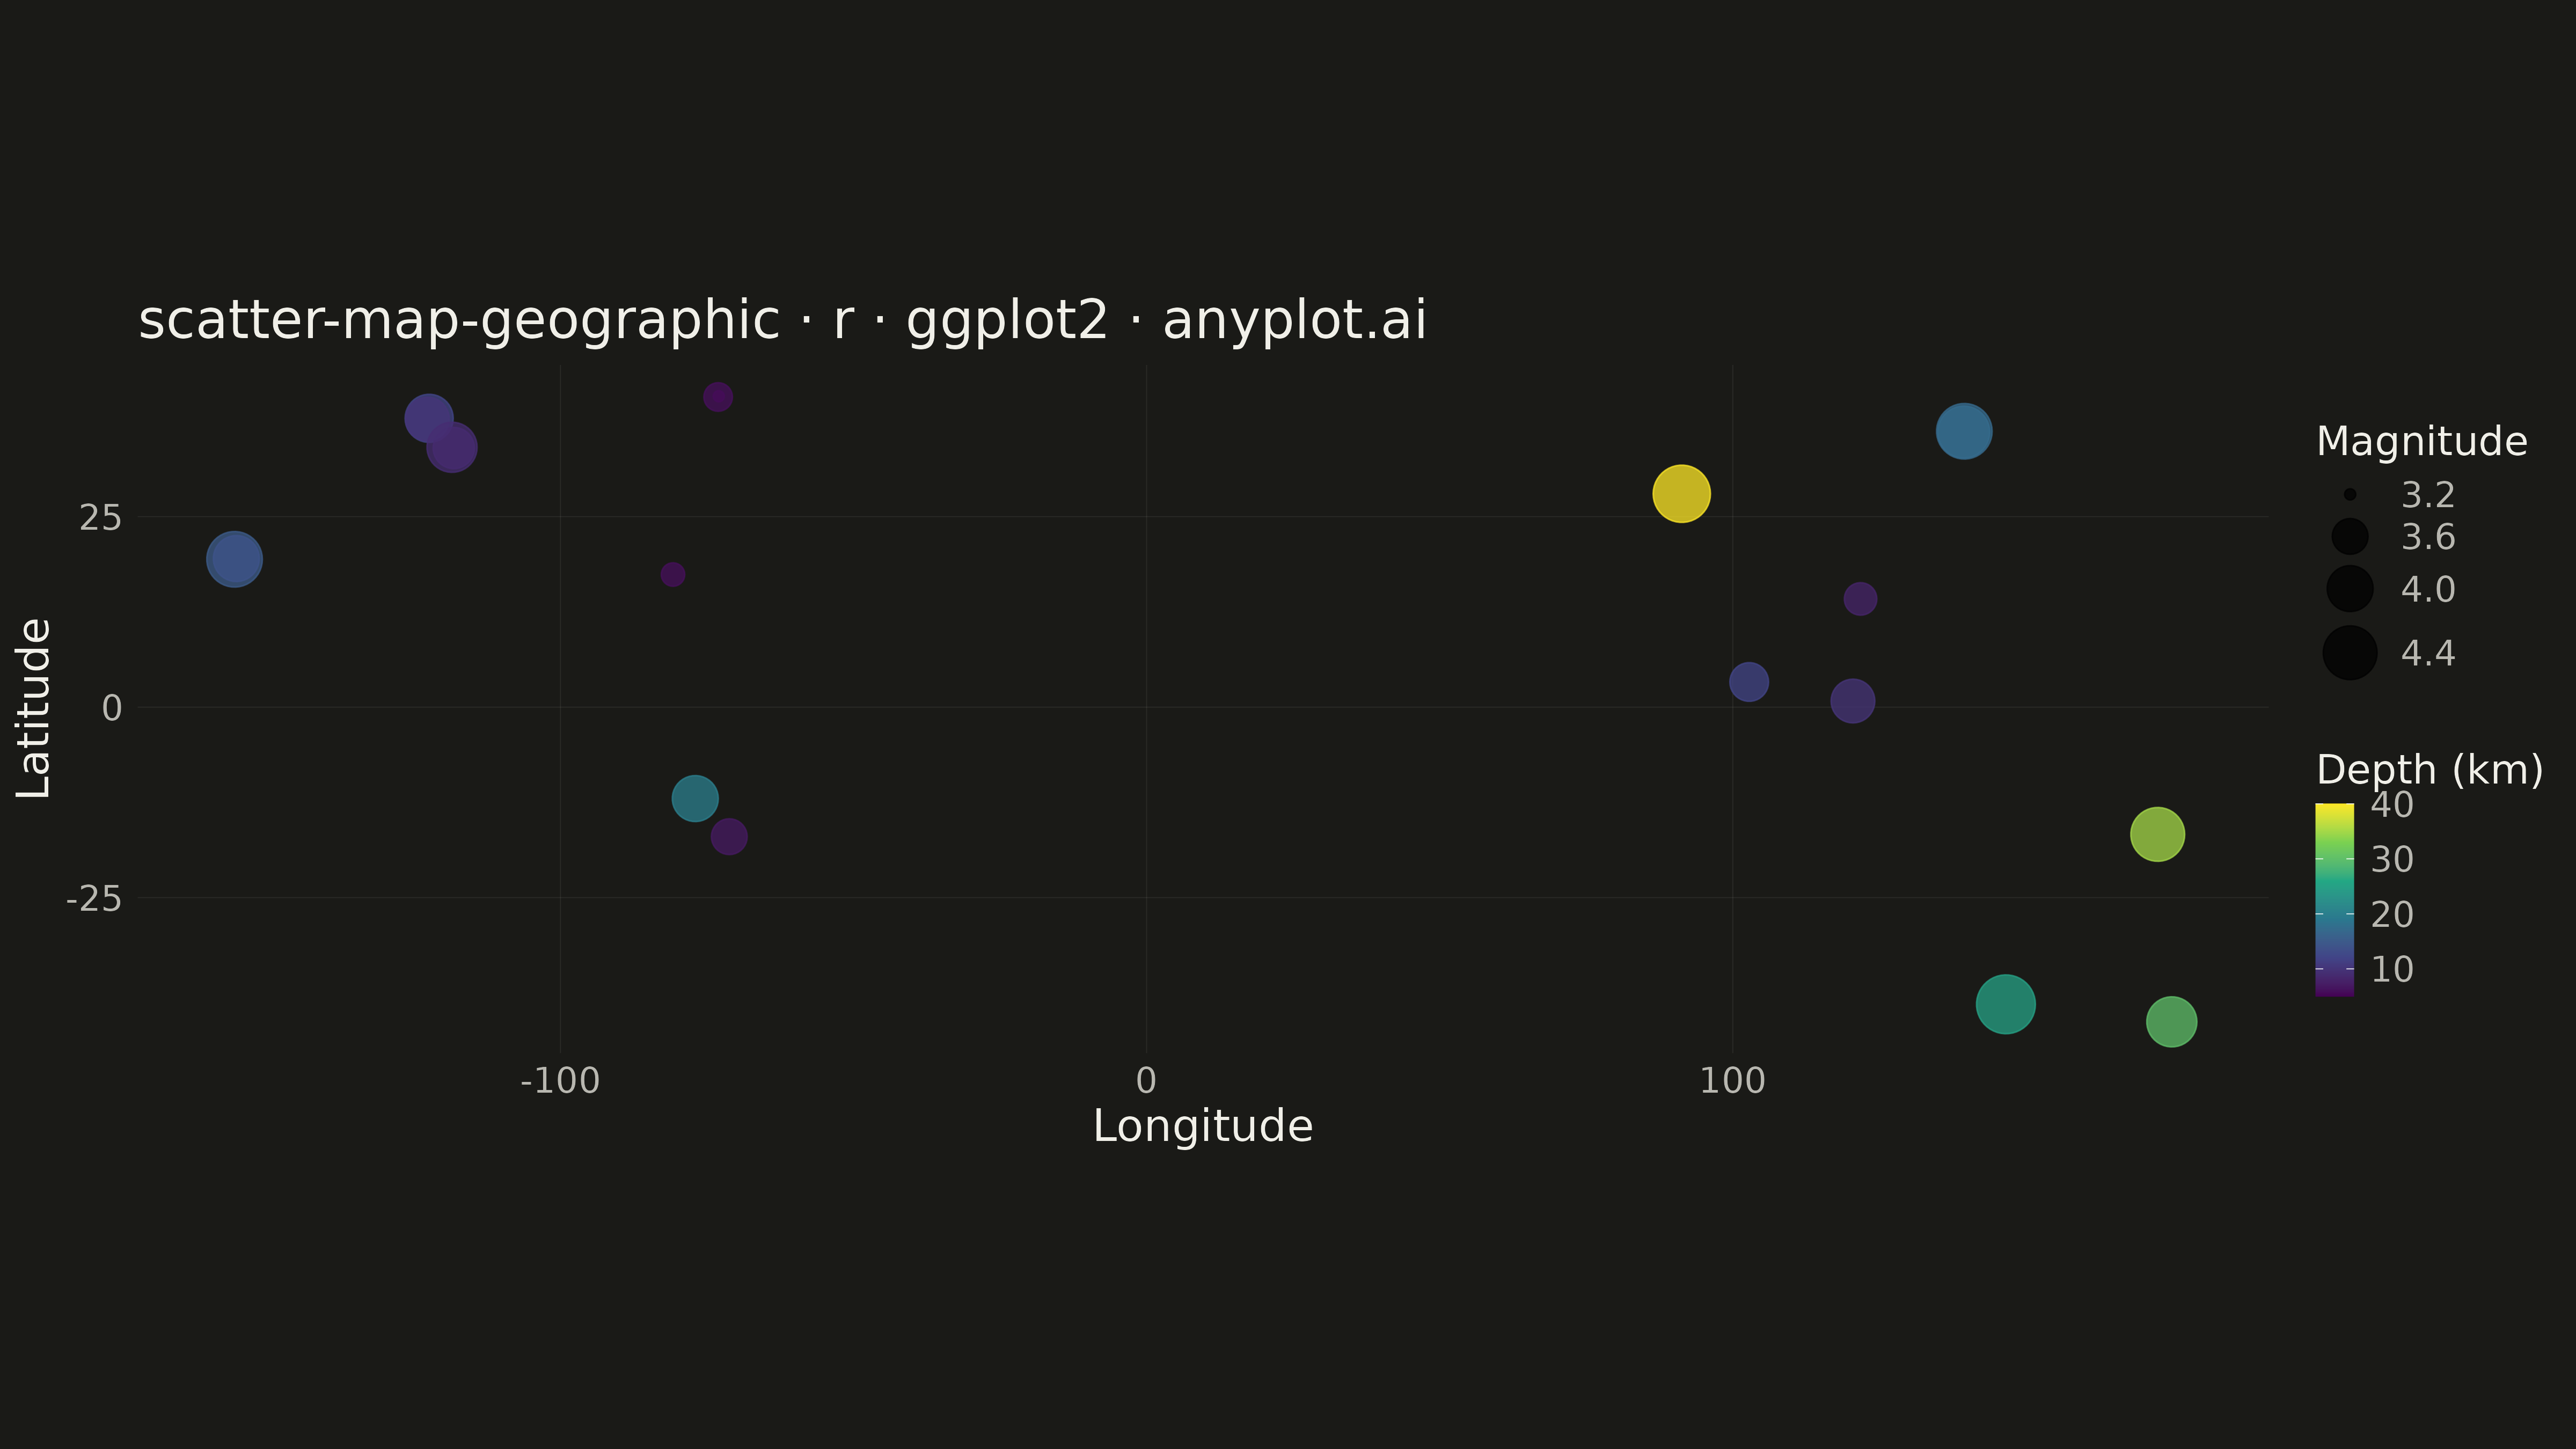
A geographic scatter plot that displays data points on a world or regional map, with each point positioned by its latitude and longitude coordinates. This visualization is ideal for showing spatial distributions of events, locations, or measurements across geographic areas. Points can optionally encode additional variables through size and color, enabling multi-dimensional geographic analysis at a glance.
#' anyplot.ai
#' scatter-map-geographic: Scatter Map with Geographic Points
#' Library: ggplot2 3.5.1 | R 4.4.1
#' Quality: 92/100 | Created: 2026-05-18

library(ggplot2)
library(dplyr)
library(scales)
library(ragg)

set.seed(42)

# --- Theme tokens -----------------------------------------------------------
THEME       <- Sys.getenv("ANYPLOT_THEME", "light")
PAGE_BG     <- if (THEME == "light") "#FAF8F1" else "#1A1A17"
INK         <- if (THEME == "light") "#1A1A17" else "#F0EFE8"
INK_SOFT    <- if (THEME == "light") "#4A4A44" else "#B8B7B0"
GRID_COLOR  <- if (THEME == "light") scales::alpha("#1A1A17", 0.08) else scales::alpha("#F0EFE8", 0.08)
IMPRINT   <- c("#009E73", "#C475FD", "#4467A3", "#BD8233",
                 "#AE3030", "#2ABCCD", "#954477")

# --- Data: Earthquake epicenters with magnitude and depth -------------------
earthquakes <- tibble::tibble(
  longitude = c(-122.4, -118.2, -155.6, -73.0, 139.4, 146.6, 174.9, 120.5,
                 -71.2, -77.0, 102.8, 121.8, 172.5, -80.8, 91.3,
                 -122.7, -118.5, -155.3, -73.1, 139.5),
  latitude = c(37.9, 34.0, 19.4, 40.8, 36.1, -39.0, -41.3, 0.8,
               -17.0, -12.0, 3.3, 14.2, -16.7, 17.4, 28.0,
               37.8, 34.1, 19.5, 40.7, 36.2),
  magnitude = c(4.1, 3.8, 4.5, 3.2, 4.3, 4.7, 4.2, 3.9,
                3.6, 4.0, 3.7, 3.5, 4.4, 3.3, 4.6,
                3.9, 4.2, 4.0, 3.4, 4.5),
  depth_km = c(12, 8, 15, 5, 18, 25, 30, 10,
               7, 20, 12, 8, 35, 6, 40,
               10, 9, 14, 6, 17)
)

# --- Plot -------------------------------------------------------------------
anyplot_theme <- theme_minimal(base_size = 14) +
  theme(
    plot.background   = element_rect(fill = PAGE_BG, color = PAGE_BG),
    panel.background  = element_rect(fill = PAGE_BG, color = NA),
    panel.grid.major  = element_line(color = GRID_COLOR, linewidth = 0.2),
    panel.grid.minor  = element_blank(),
    axis.title        = element_text(color = INK, size = 20),
    axis.text         = element_text(color = INK_SOFT, size = 16),
    plot.title        = element_text(color = INK, size = 24, face = "plain"),
    legend.background = element_rect(fill = PAGE_BG, color = NA),
    legend.text       = element_text(color = INK_SOFT, size = 16),
    legend.title      = element_text(color = INK, size = 18),
    panel.border      = element_blank()
  )

p <- ggplot(earthquakes, aes(x = longitude, y = latitude)) +
  geom_point(aes(size = magnitude, color = depth_km), alpha = 0.75) +
  scale_size_continuous(name = "Magnitude", range = c(2, 12)) +
  scale_color_viridis_c(name = "Depth (km)", option = "viridis") +
  labs(
    title = "scatter-map-geographic · r · ggplot2 · anyplot.ai",
    x = "Longitude",
    y = "Latitude"
  ) +
  coord_fixed(ratio = 1.3) +
  anyplot_theme

# --- Save -------------------------------------------------------------------
ggsave(
  filename = sprintf("plot-%s.png", THEME),
  plot     = p,
  device   = ragg::agg_png,
  width    = 16,
  height   = 9,
  units    = "in",
  dpi      = 300
)
Runnable source as JSON, for any HTTP client: https://api.anyplot.ai/specs/scatter-map-geographic/ggplot2/code. Any spec id and library id listed in llms-full.txt fit the same URL shape; every URL below is complete and callable.
{
  "spec_id": "scatter-map-geographic",
  "language": "r",
  "library": "ggplot2",
  "page": "https://anyplot.ai/scatter-map-geographic/r/ggplot2",
  "hub": "https://anyplot.ai/scatter-map-geographic",
  "code_json": "https://api.anyplot.ai/specs/scatter-map-geographic/ggplot2/code",
  "spec_json": "https://api.anyplot.ai/specs/scatter-map-geographic",
  "render_light_png": "https://storage.googleapis.com/anyplot-images/plots/scatter-map-geographic/r/ggplot2/plot-light.png",
  "render_dark_png": "https://storage.googleapis.com/anyplot-images/plots/scatter-map-geographic/r/ggplot2/plot-dark.png",
  "quality_score": 92.0,
  "license": "MIT",
  "guide": "https://anyplot.ai/llms.txt"
}
Part of Scatter Map with Geographic Points on anyplot.ai.