The same plot in 14 other libraries — JavaScript: Chart.js, D3.js, Apache ECharts, Highcharts; Python: Altair, Bokeh, lets-plot, Matplotlib, Plotly, plotnine, Pygal, Seaborn; R: ggplot2; Julia: Makie.jl. Compare all 15 side by side: Scatter Map with Geographic Points in Python, R, Julia and JavaScript.
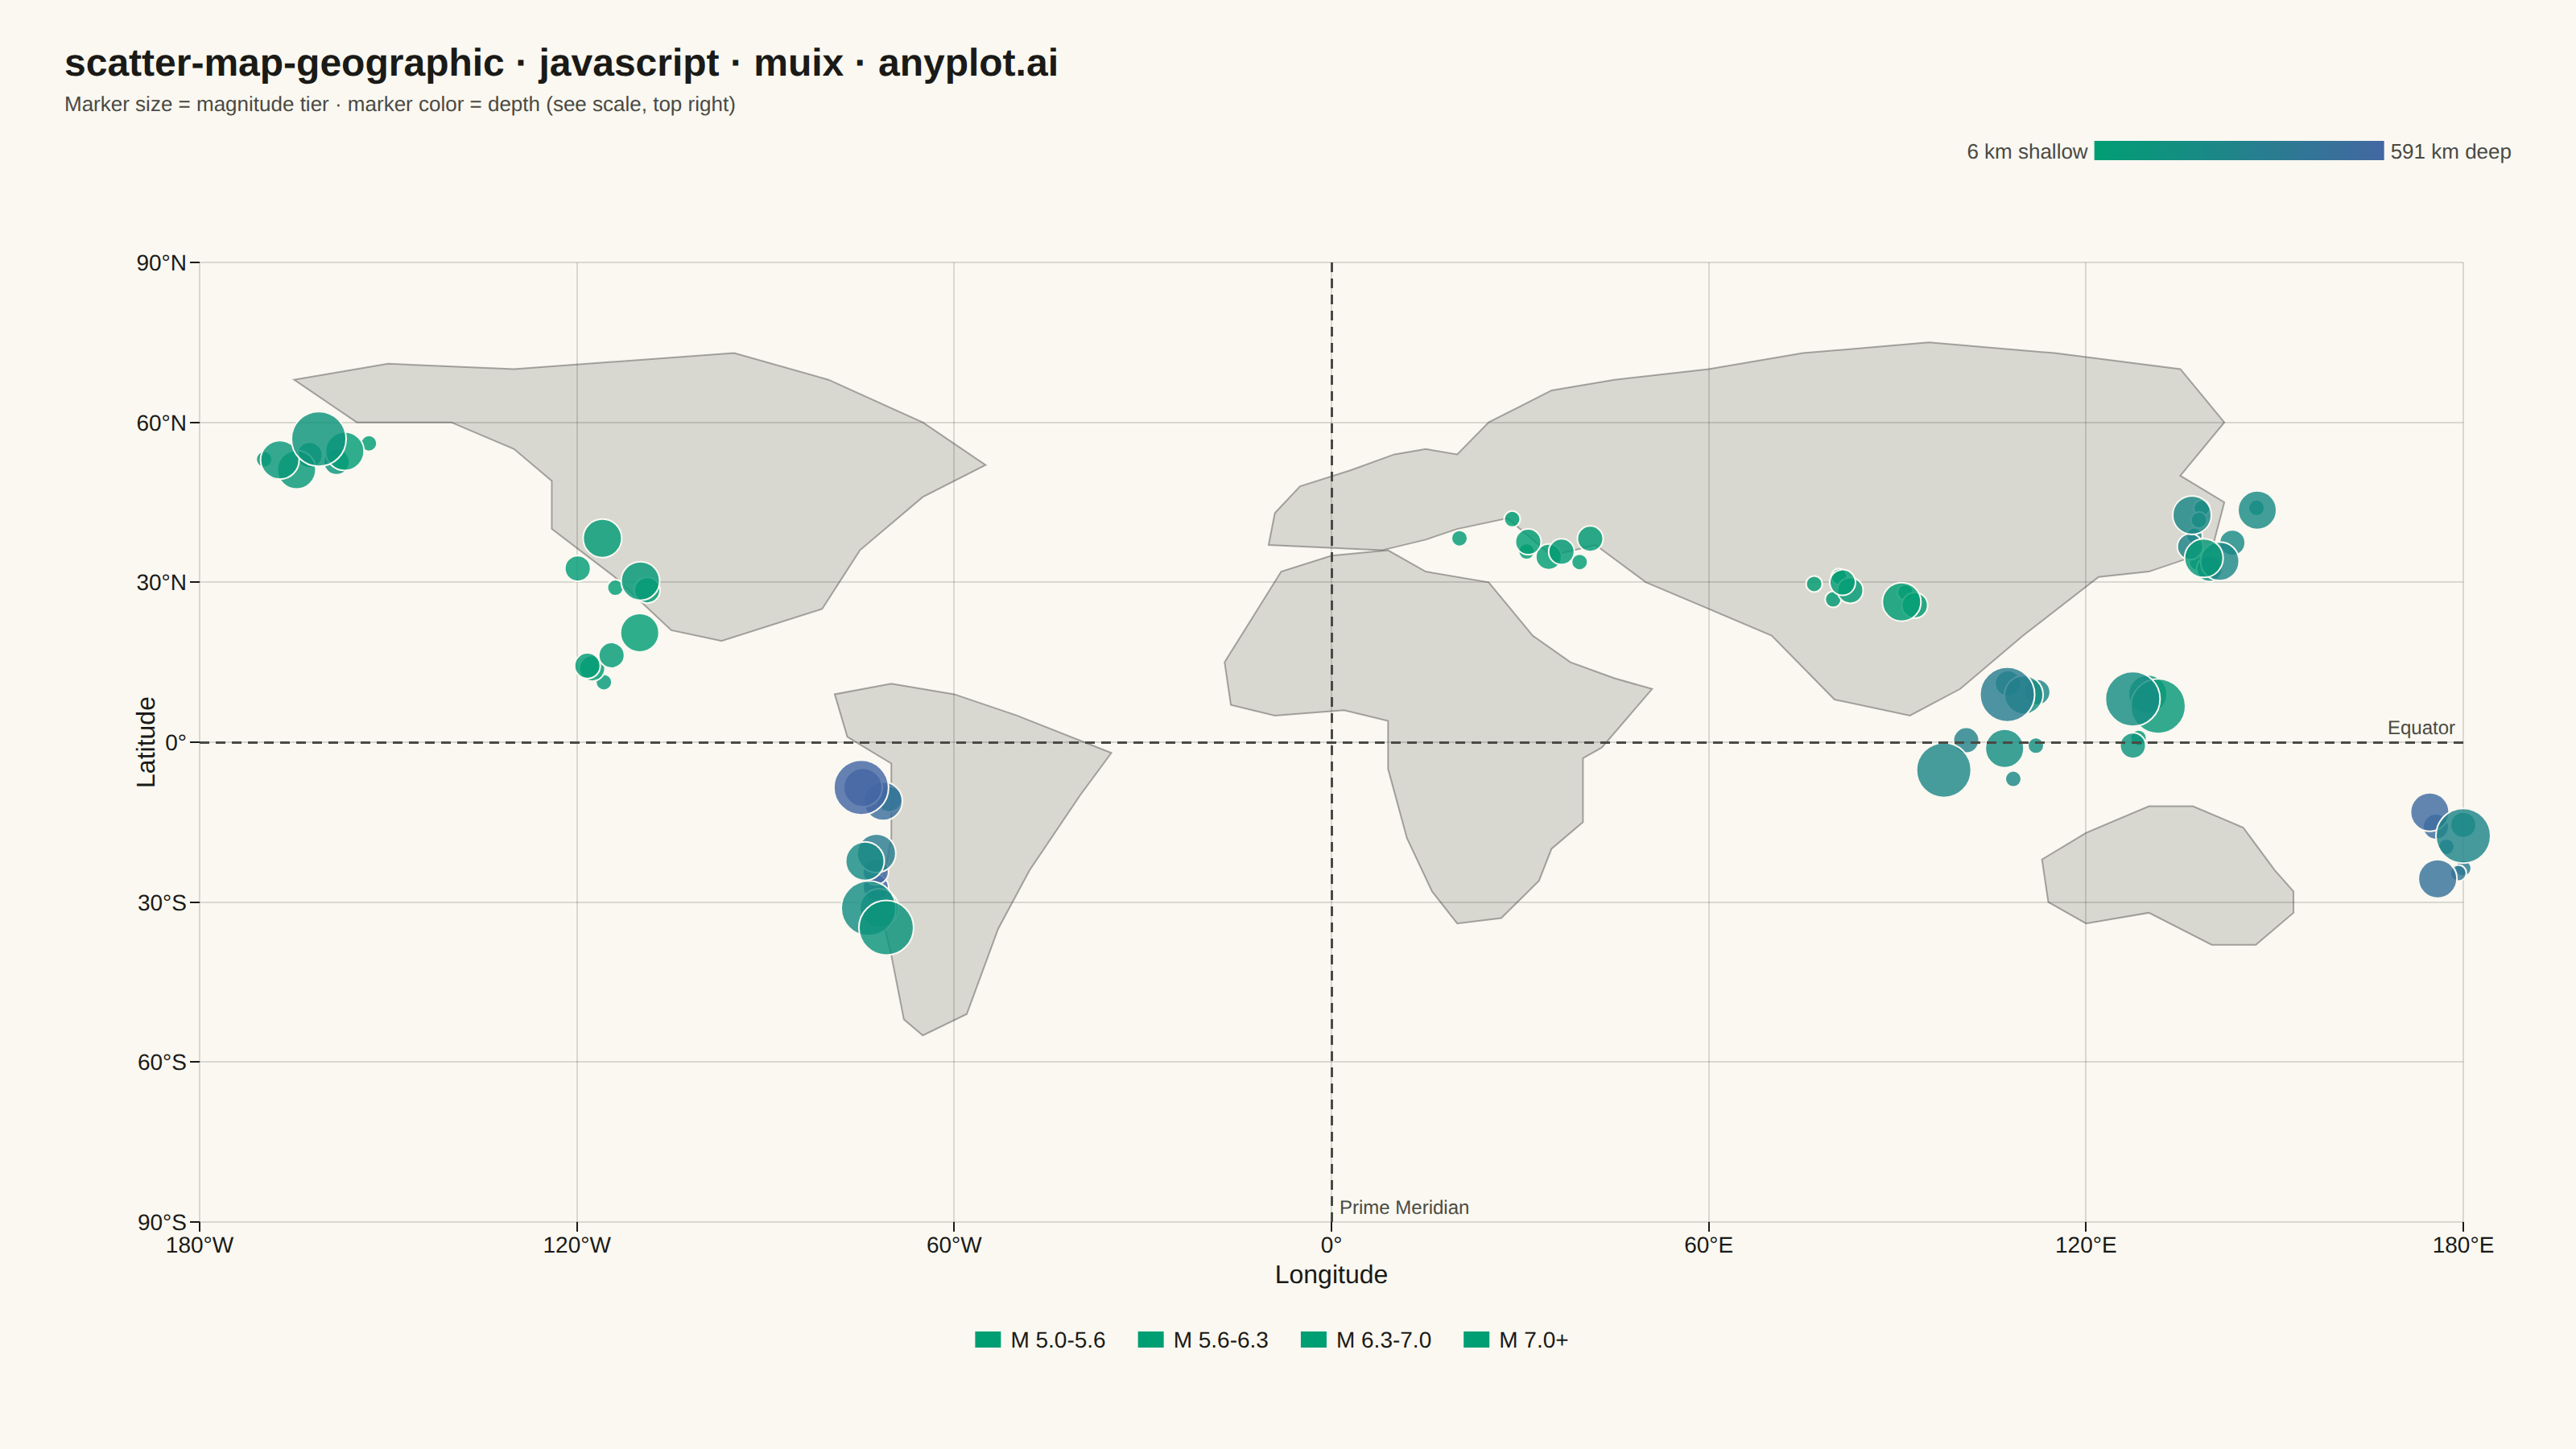
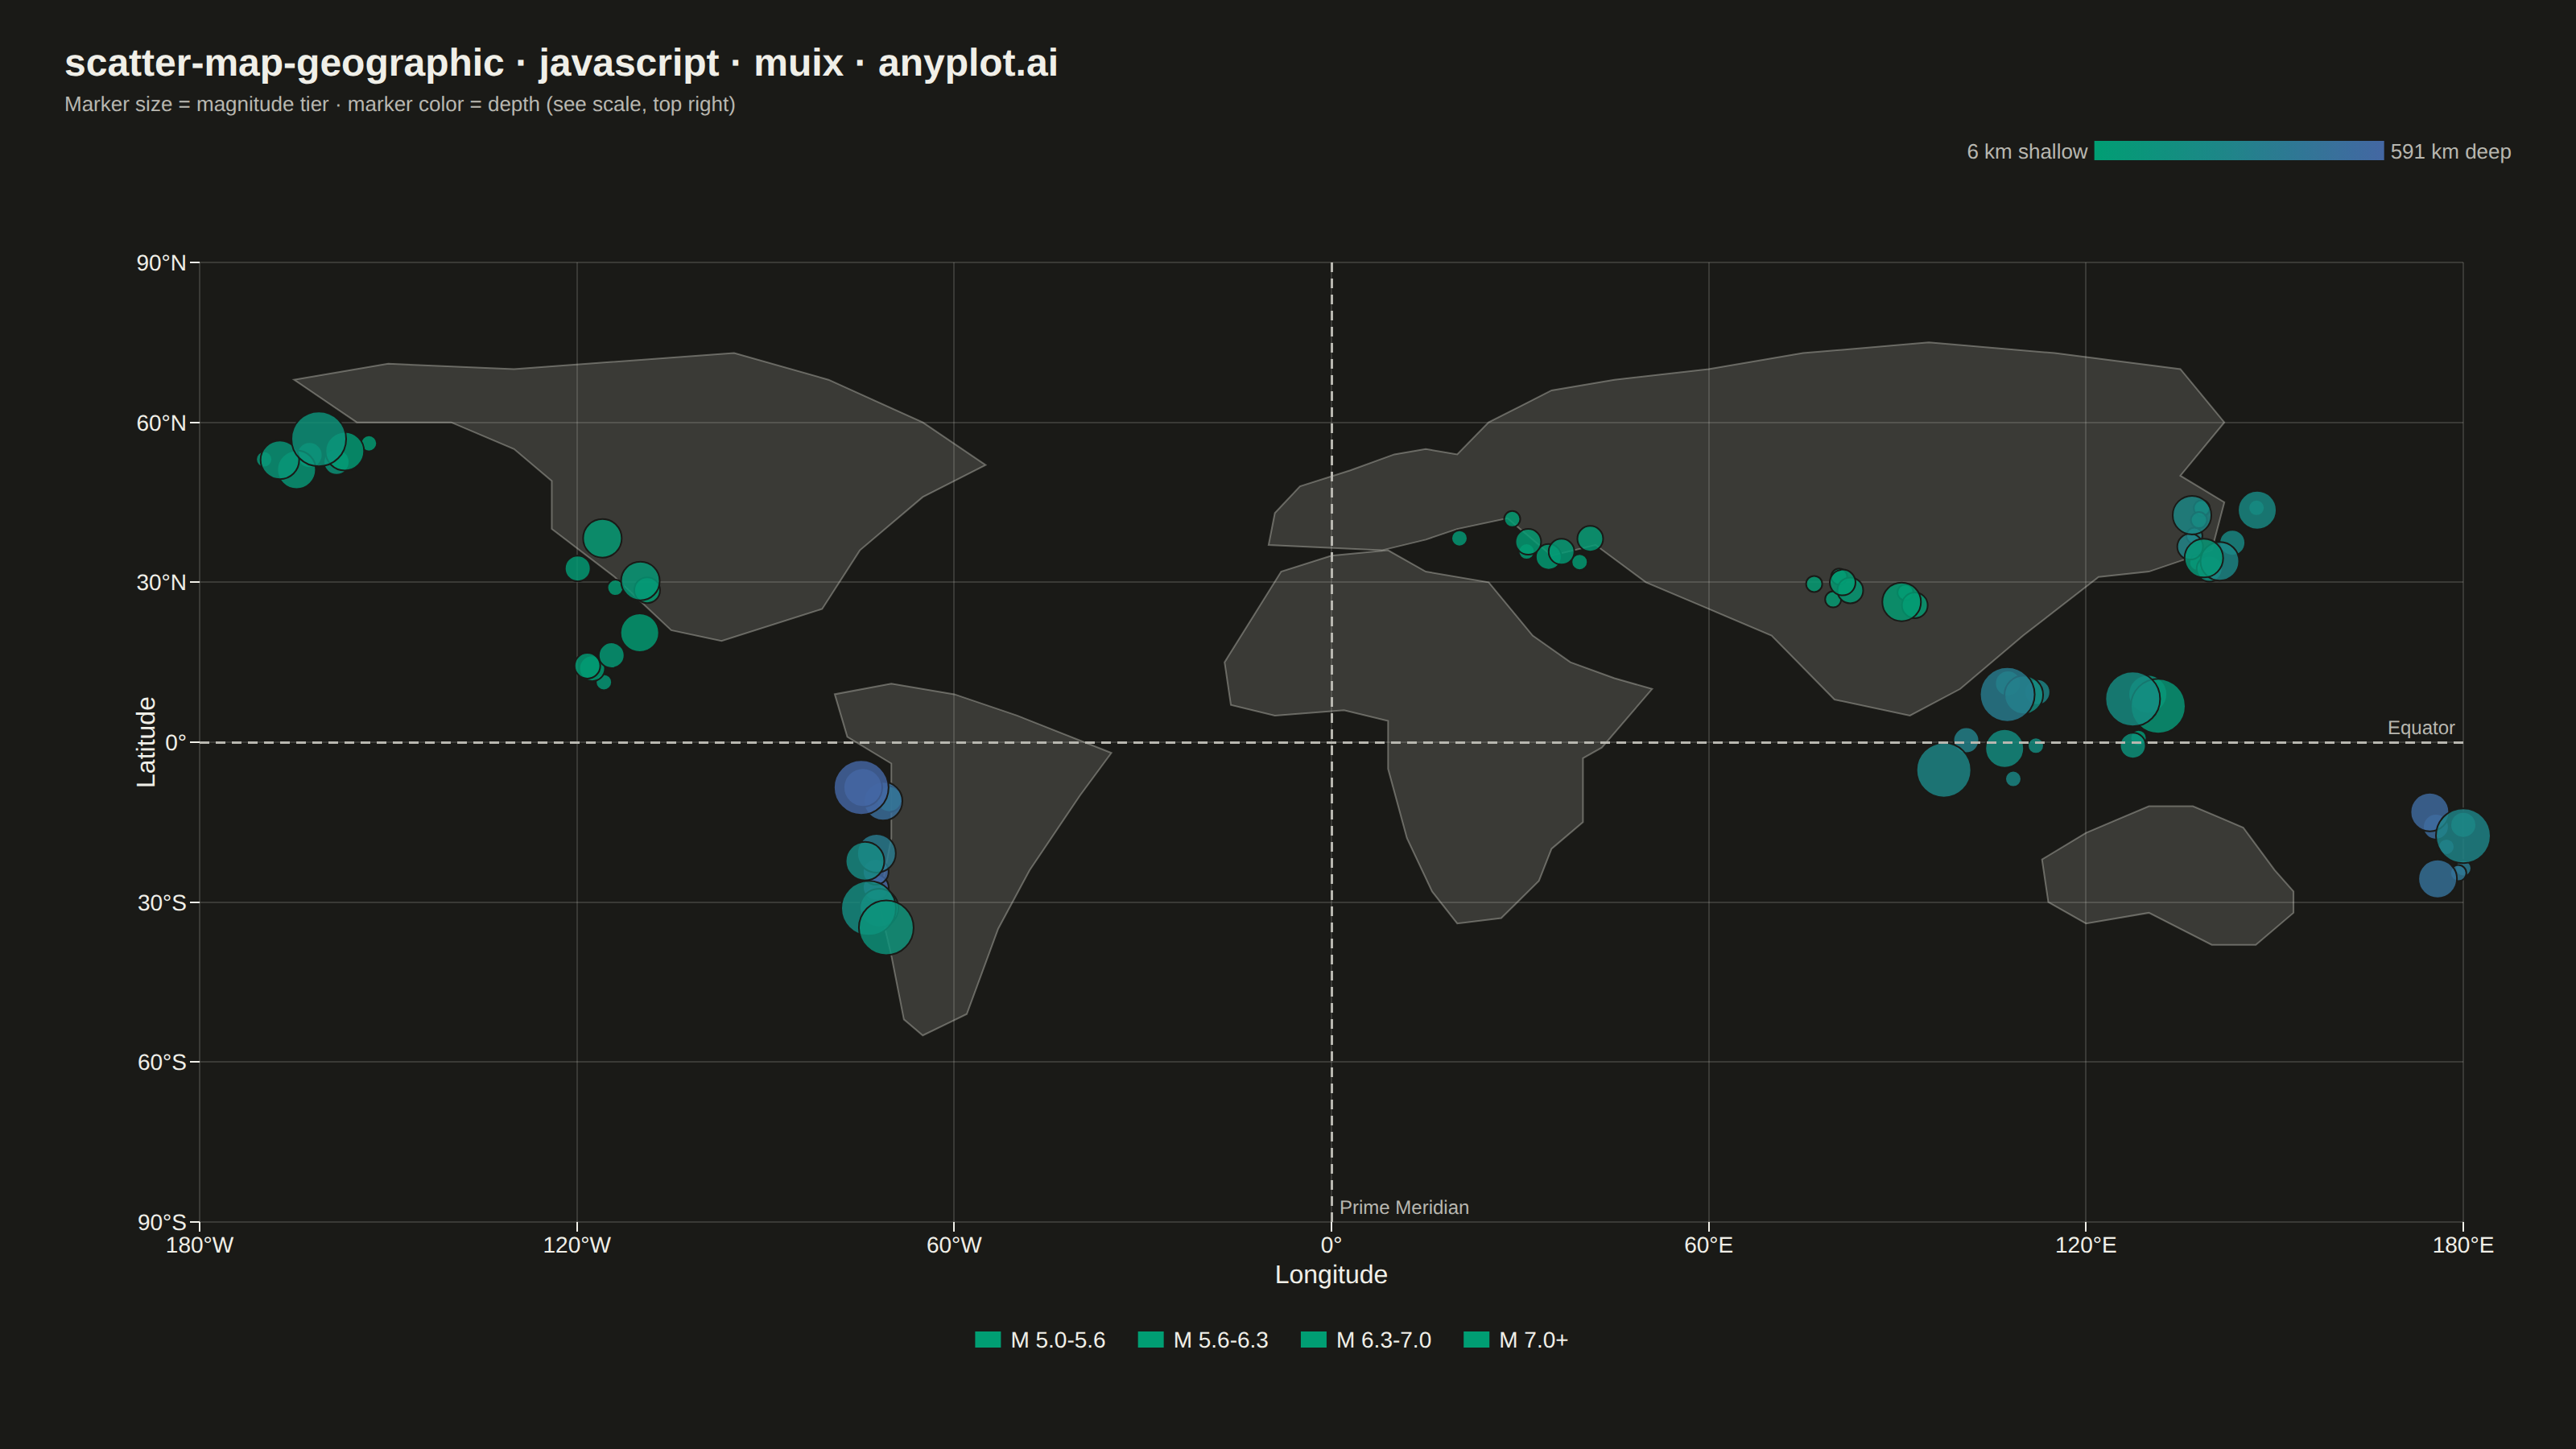
A geographic scatter plot that displays data points on a world or regional map, with each point positioned by its latitude and longitude coordinates. This visualization is ideal for showing spatial distributions of events, locations, or measurements across geographic areas. Points can optionally encode additional variables through size and color, enabling multi-dimensional geographic analysis at a glance.
// anyplot.ai
// scatter-map-geographic: Scatter Map with Geographic Points
// Library: muix 7.29.1 | JavaScript 22.23.2
// Quality: 90/100 | Created: 2026-09-02
import { ScatterChart } from "@mui/x-charts/ScatterChart";
import { ChartsReferenceLine } from "@mui/x-charts/ChartsReferenceLine";
import { ContinuousColorLegend } from "@mui/x-charts/ChartsLegend";
import { Box, Typography } from "@mui/material";

const t = window.ANYPLOT_TOKENS;

// --- Data (in-memory, deterministic) ----------------------------------------
// Simulated M5.0+ earthquake epicenters clustered along the world's major
// subduction and collision zones (Ring of Fire, Alpide belt). Longitude/
// latitude place each point on an equirectangular (plate carree) projection —
// the simplest valid map projection: lon maps linearly to x, lat to y. A
// 60 deg/30 deg graticule plus the equator and prime meridian reference lines
// stand in for a basemap (no coastline dataset ships with the community
// package and pulling one in would mean importing D3, which is out of scope
// for muix).
let seed = 8831;
const rand = () => {
  seed = (seed * 1103515245 + 12345) % 2147483648;
  return seed / 2147483648;
};

const FAULT_ZONES = [
  { lon: 142, lat: 38, spreadLon: 6, spreadLat: 6, count: 12, mag: [5.0, 7.2], depth: [10, 300] }, // Japan-Kuril arc
  { lon: -160, lat: 55, spreadLon: 10, spreadLat: 4, count: 8, mag: [5.0, 7.5], depth: [10, 150] }, // Aleutian-Alaska arc
  { lon: -112, lat: 24, spreadLon: 9, spreadLat: 15, count: 10, mag: [5.0, 6.9], depth: [5, 60] }, // Cascadia-Mexico coast
  { lon: -72, lat: -20, spreadLon: 3, spreadLat: 16, count: 12, mag: [5.0, 7.8], depth: [10, 600] }, // Andes subduction
  { lon: 115, lat: 2, spreadLon: 18, spreadLat: 10, count: 14, mag: [5.0, 7.6], depth: [10, 400] }, // Indonesia-Philippines arc
  { lon: 178, lat: -20, spreadLon: 4, spreadLat: 8, count: 8, mag: [5.0, 7.4], depth: [10, 600] }, // Tonga-Kermadec trench
  { lon: 30, lat: 37, spreadLon: 12, spreadLat: 5, count: 8, mag: [5.0, 6.8], depth: [5, 40] }, // Anatolia-Aegean
  { lon: 84, lat: 29, spreadLon: 10, spreadLat: 4, count: 8, mag: [5.0, 7.2], depth: [5, 40] }, // Himalayan front
];

const epicenters = FAULT_ZONES.flatMap((zone, zoneIndex) =>
  Array.from({ length: zone.count }, (_, i) => {
    const longitude = Math.max(-180, Math.min(180, zone.lon + (rand() - 0.5) * 2 * zone.spreadLon));
    const latitude = Math.max(-90, Math.min(90, zone.lat + (rand() - 0.5) * 2 * zone.spreadLat));
    const magnitude = zone.mag[0] + rand() * (zone.mag[1] - zone.mag[0]);
    const depthKm = Math.round(zone.depth[0] + rand() * (zone.depth[1] - zone.depth[0]));
    return { id: `eq-${zoneIndex}-${i}`, longitude, latitude, magnitude, depthKm };
  }),
);

const depths = epicenters.map((e) => e.depthKm);
const depthDomain = [Math.min(...depths), Math.max(...depths)];

// Magnitude tiers -> marker size. The community ScatterChart sizes markers
// per series (not per point), so a size legend for a continuous magnitude
// needs binning into a handful of series, each drawn at its own markerSize.
const MAGNITUDE_TIERS = [
  { id: "minor", label: "M 5.0-5.6", max: 5.6, markerSize: 5 },
  { id: "light", label: "M 5.6-6.3", max: 6.3, markerSize: 8 },
  { id: "strong", label: "M 6.3-7.0", max: 7.0, markerSize: 12 },
  { id: "major", label: "M 7.0+", max: Infinity, markerSize: 17 },
];

const tierSeries = MAGNITUDE_TIERS.map((tier, tierIndex) => {
  const lowerBound = tierIndex === 0 ? -Infinity : MAGNITUDE_TIERS[tierIndex - 1].max;
  const points = epicenters.filter((e) => e.magnitude > lowerBound && e.magnitude <= tier.max);
  return {
    type: "scatter",
    id: tier.id,
    label: tier.label,
    markerSize: tier.markerSize,
    color: t.palette[0],
    zAxisId: "depth",
    data: points.map((e) => ({ x: e.longitude, y: e.latitude, z: e.depthKm, id: e.id })),
    valueFormatter: (v) => `${v.x.toFixed(1)}°, ${v.y.toFixed(1)}° · depth ${v.z} km`,
  };
});

const formatLongitude = (value) => (value === 0 ? "0°" : `${Math.abs(Math.round(value))}°${value > 0 ? "E" : "W"}`);
const formatLatitude = (value) => (value === 0 ? "0°" : `${Math.abs(Math.round(value))}°${value > 0 ? "N" : "S"}`);

const TITLE = "scatter-map-geographic · javascript · muix · anyplot.ai";
const SUBTITLE = "Marker size = magnitude tier · marker color = depth (see scale, top right)";

// Minimal hardcoded [lon, lat] continent outlines (plate-carree, heavily
// simplified) — a lightweight basemap so the plot reads as a world map at a
// glance without pulling in a geo/D3 dependency, which is out of scope for
// the community-only muix surface.
const CONTINENTS = [
  {
    name: "north-america",
    points: [
      [-165, 68], [-150, 71], [-130, 70], [-95, 73], [-80, 68], [-65, 60], [-55, 52],
      [-65, 46], [-75, 36], [-81, 25], [-97, 19], [-105, 21], [-114, 31], [-124, 40],
      [-124, 49], [-130, 55], [-140, 60], [-155, 60], [-165, 68],
    ],
  },
  {
    name: "south-america",
    points: [
      [-79, 9], [-77, 1], [-70, -4], [-70, -18], [-72, -30], [-70, -40], [-68, -52],
      [-65, -55], [-58, -51], [-53, -35], [-48, -24], [-40, -10], [-35, -2], [-50, 5],
      [-60, 9], [-70, 11], [-79, 9],
    ],
  },
  {
    name: "africa",
    points: [
      [-17, 15], [-16, 7], [-9, 5], [2, 6], [9, 4], [9, -5], [12, -18], [16, -28],
      [20, -34], [27, -33], [33, -26], [35, -20], [40, -15], [40, -3], [43, -1],
      [51, 10], [45, 12], [38, 15], [32, 20], [25, 30], [15, 32], [9, 36], [0, 35],
      [-8, 32], [-17, 15],
    ],
  },
  {
    name: "eurasia",
    points: [
      [-10, 37], [-9, 43], [-5, 48], [3, 51], [10, 54], [15, 55], [20, 54], [25, 60],
      [30, 63], [35, 66], [45, 68], [60, 70], [75, 73], [95, 75], [115, 73], [135, 70],
      [142, 60], [135, 50], [142, 45], [140, 36], [130, 32], [122, 31], [110, 20],
      [100, 10], [92, 5], [80, 8], [70, 20], [60, 25], [50, 30], [42, 37], [35, 35],
      [28, 42], [20, 40], [15, 38], [8, 36], [-10, 37],
    ],
  },
  {
    name: "australia",
    points: [
      [113, -22], [120, -17], [130, -12], [137, -12], [145, -16], [150, -24],
      [153, -28], [153, -32], [147, -38], [140, -38], [130, -32], [120, -34],
      [114, -30], [113, -22],
    ],
  },
];

// Direct plate-carree projection matching the chart's linear lon/lat axes
// (min/max -180..180 / -90..90, no scale padding) so the outlines line up
// exactly with the data points and graticule.
const projectPath = (points, w, h) =>
  points
    .map(([lon, lat], i) => `${i === 0 ? "M" : "L"} ${((lon + 180) / 360) * w} ${((90 - lat) / 180) * h}`)
    .join(" ") + " Z";

// --- Chart (default-exported component — the harness mounts it) ------------
export default function Chart() {
  const size = window.ANYPLOT_SIZE;
  const padding = { top: 28, right: 40, bottom: 24, left: 40 };
  const titleBlockHeight = 76;
  const chartWidth = size.width - padding.left - padding.right;
  const chartHeight = size.height - padding.top - padding.bottom - titleBlockHeight;
  const margin = { top: 76, right: 30, bottom: 100, left: 84 };
  const drawWidth = chartWidth - margin.left - margin.right;
  const drawHeight = chartHeight - margin.top - margin.bottom;

  return (
    <Box
      sx={{
        width: size.width,
        height: size.height,
        boxSizing: "border-box",
        padding: `${padding.top}px ${padding.right}px ${padding.bottom}px ${padding.left}px`,
        display: "flex",
        flexDirection: "column",
      }}
    >
      <Typography sx={{ fontSize: 24, fontWeight: 600, color: "text.primary", mb: "6px", lineHeight: 1 }}>
        {TITLE}
      </Typography>
      <Typography sx={{ fontSize: 13, color: "text.secondary", mb: "16px", lineHeight: 1 }}>{SUBTITLE}</Typography>
      <Box sx={{ position: "relative", width: chartWidth, height: chartHeight }}>
        <Box
          sx={{
            position: "absolute",
            left: margin.left,
            top: margin.top,
            width: drawWidth,
            height: drawHeight,
            overflow: "hidden",
            pointerEvents: "none",
          }}
        >
          <svg width={drawWidth} height={drawHeight} style={{ display: "block" }}>
            {CONTINENTS.map((c) => (
              <path
                key={c.name}
                d={projectPath(c.points, drawWidth, drawHeight)}
                fill={t.grid}
                stroke={t.inkSoft}
                strokeOpacity={0.45}
                strokeWidth={1}
              />
            ))}
          </svg>
        </Box>
        <ScatterChart
          width={chartWidth}
          height={chartHeight}
          skipAnimation
          disableVoronoi
          series={tierSeries}
          margin={margin}
          xAxis={[
            {
              id: "lon",
              min: -180,
              max: 180,
              domainLimit: "strict",
              label: "Longitude",
              disableLine: true,
              tickInterval: [-180, -120, -60, 0, 60, 120, 180],
              valueFormatter: (v, ctx) => (ctx.location === "tick" ? formatLongitude(v) : `${v.toFixed(1)}°`),
              tickLabelStyle: { fontSize: 14 },
              labelStyle: { fontSize: 16 },
            },
          ]}
          yAxis={[
            {
              id: "lat",
              min: -90,
              max: 90,
              domainLimit: "strict",
              label: "Latitude",
              disableLine: true,
              tickInterval: [-90, -60, -30, 0, 30, 60, 90],
              valueFormatter: (v, ctx) => (ctx.location === "tick" ? formatLatitude(v) : `${v.toFixed(1)}°`),
              tickLabelStyle: { fontSize: 14 },
              labelStyle: { fontSize: 16 },
            },
          ]}
          zAxis={[
            {
              id: "depth",
              min: depthDomain[0],
              max: depthDomain[1],
              colorMap: { type: "continuous", min: depthDomain[0], max: depthDomain[1], color: [t.seq[0], t.seq[1]] },
            },
          ]}
          grid={{ horizontal: true, vertical: true }}
          slotProps={{
            legend: {
              direction: "row",
              position: { vertical: "bottom", horizontal: "middle" },
              labelStyle: { fontSize: 14 },
              itemMarkWidth: 16,
              itemMarkHeight: 10,
              markGap: 6,
              itemGap: 20,
            },
          }}
          sx={{
            "& circle": { fillOpacity: 0.82, stroke: t.pageBg, strokeWidth: 1 },
            "& .MuiChartsGrid-line": { stroke: t.grid, strokeDasharray: "none" },
          }}
        >
          <ChartsReferenceLine
            x={0}
            label="Prime Meridian"
            labelAlign="end"
            lineStyle={{ stroke: t.inkSoft, strokeDasharray: "6 4", strokeWidth: 1.5 }}
            labelStyle={{ fontSize: 12, fill: t.inkSoft }}
          />
          <ChartsReferenceLine
            y={0}
            label="Equator"
            labelAlign="end"
            lineStyle={{ stroke: t.inkSoft, strokeDasharray: "6 4", strokeWidth: 1.5 }}
            labelStyle={{ fontSize: 12, fill: t.inkSoft }}
          />
          <ContinuousColorLegend
            axisDirection="z"
            axisId="depth"
            direction="row"
            position={{ horizontal: "right", vertical: "top" }}
            length={180}
            thickness={12}
            minLabel={({ formattedValue }) => `${formattedValue} km shallow`}
            maxLabel={({ formattedValue }) => `${formattedValue} km deep`}
            labelStyle={{ fontSize: 13, fill: t.inkSoft }}
          />
        </ScatterChart>
      </Box>
    </Box>
  );
}
Runnable source as JSON, for any HTTP client: https://api.anyplot.ai/specs/scatter-map-geographic/muix/code. Any spec id and library id listed in llms-full.txt fit the same URL shape; every URL below is complete and callable.
{
  "spec_id": "scatter-map-geographic",
  "language": "javascript",
  "library": "muix",
  "page": "https://anyplot.ai/scatter-map-geographic/javascript/muix",
  "hub": "https://anyplot.ai/scatter-map-geographic",
  "code_json": "https://api.anyplot.ai/specs/scatter-map-geographic/muix/code",
  "spec_json": "https://api.anyplot.ai/specs/scatter-map-geographic",
  "render_light_png": "https://storage.googleapis.com/anyplot-images/plots/scatter-map-geographic/javascript/muix/plot-light.png",
  "render_dark_png": "https://storage.googleapis.com/anyplot-images/plots/scatter-map-geographic/javascript/muix/plot-dark.png",
  "interactive_light_html": "https://storage.googleapis.com/anyplot-images/plots/scatter-map-geographic/javascript/muix/plot-light.html",
  "interactive_dark_html": "https://storage.googleapis.com/anyplot-images/plots/scatter-map-geographic/javascript/muix/plot-dark.html",
  "quality_score": 90.0,
  "license": "MIT",
  "guide": "https://anyplot.ai/llms.txt"
}
Part of Scatter Map with Geographic Points on anyplot.ai.