The same plot in 14 other libraries — JavaScript: Chart.js, D3.js, Highcharts, MUI X Charts; Python: Altair, Bokeh, lets-plot, Matplotlib, Plotly, plotnine, Pygal, Seaborn; R: ggplot2; Julia: Makie.jl. Compare all 15 side by side: Scatter Map with Geographic Points in Python, R, Julia and JavaScript.
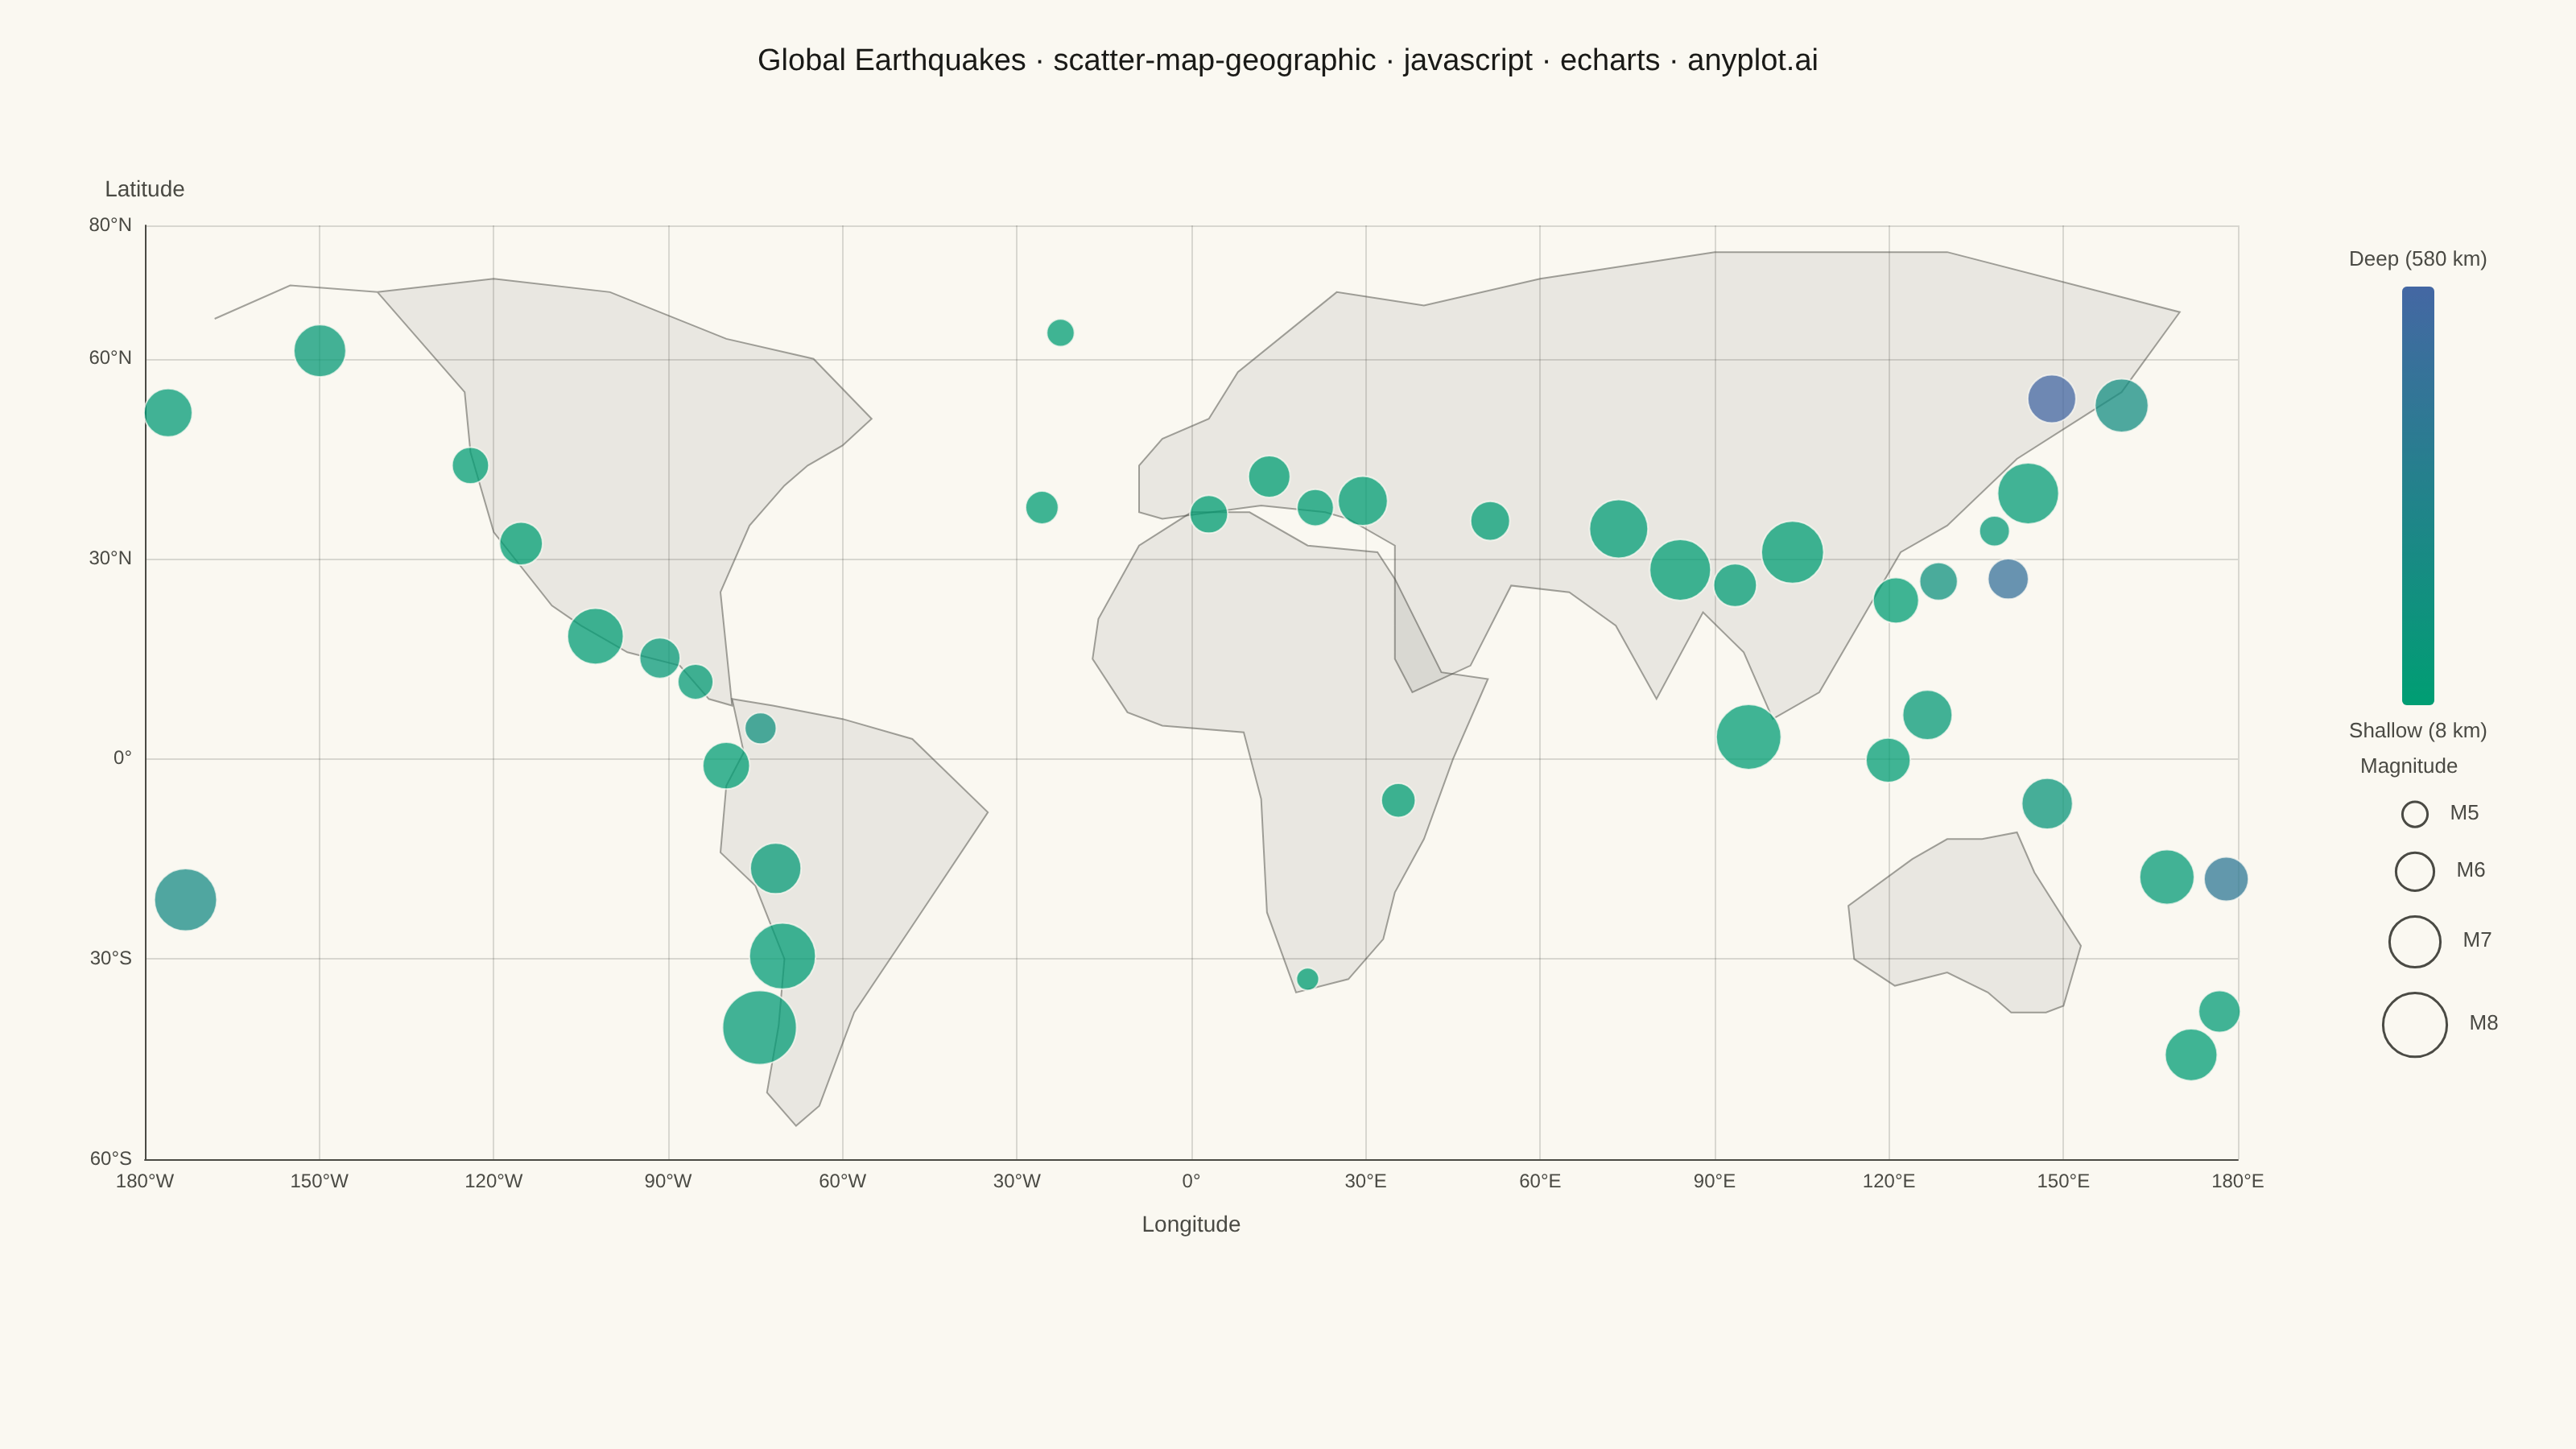
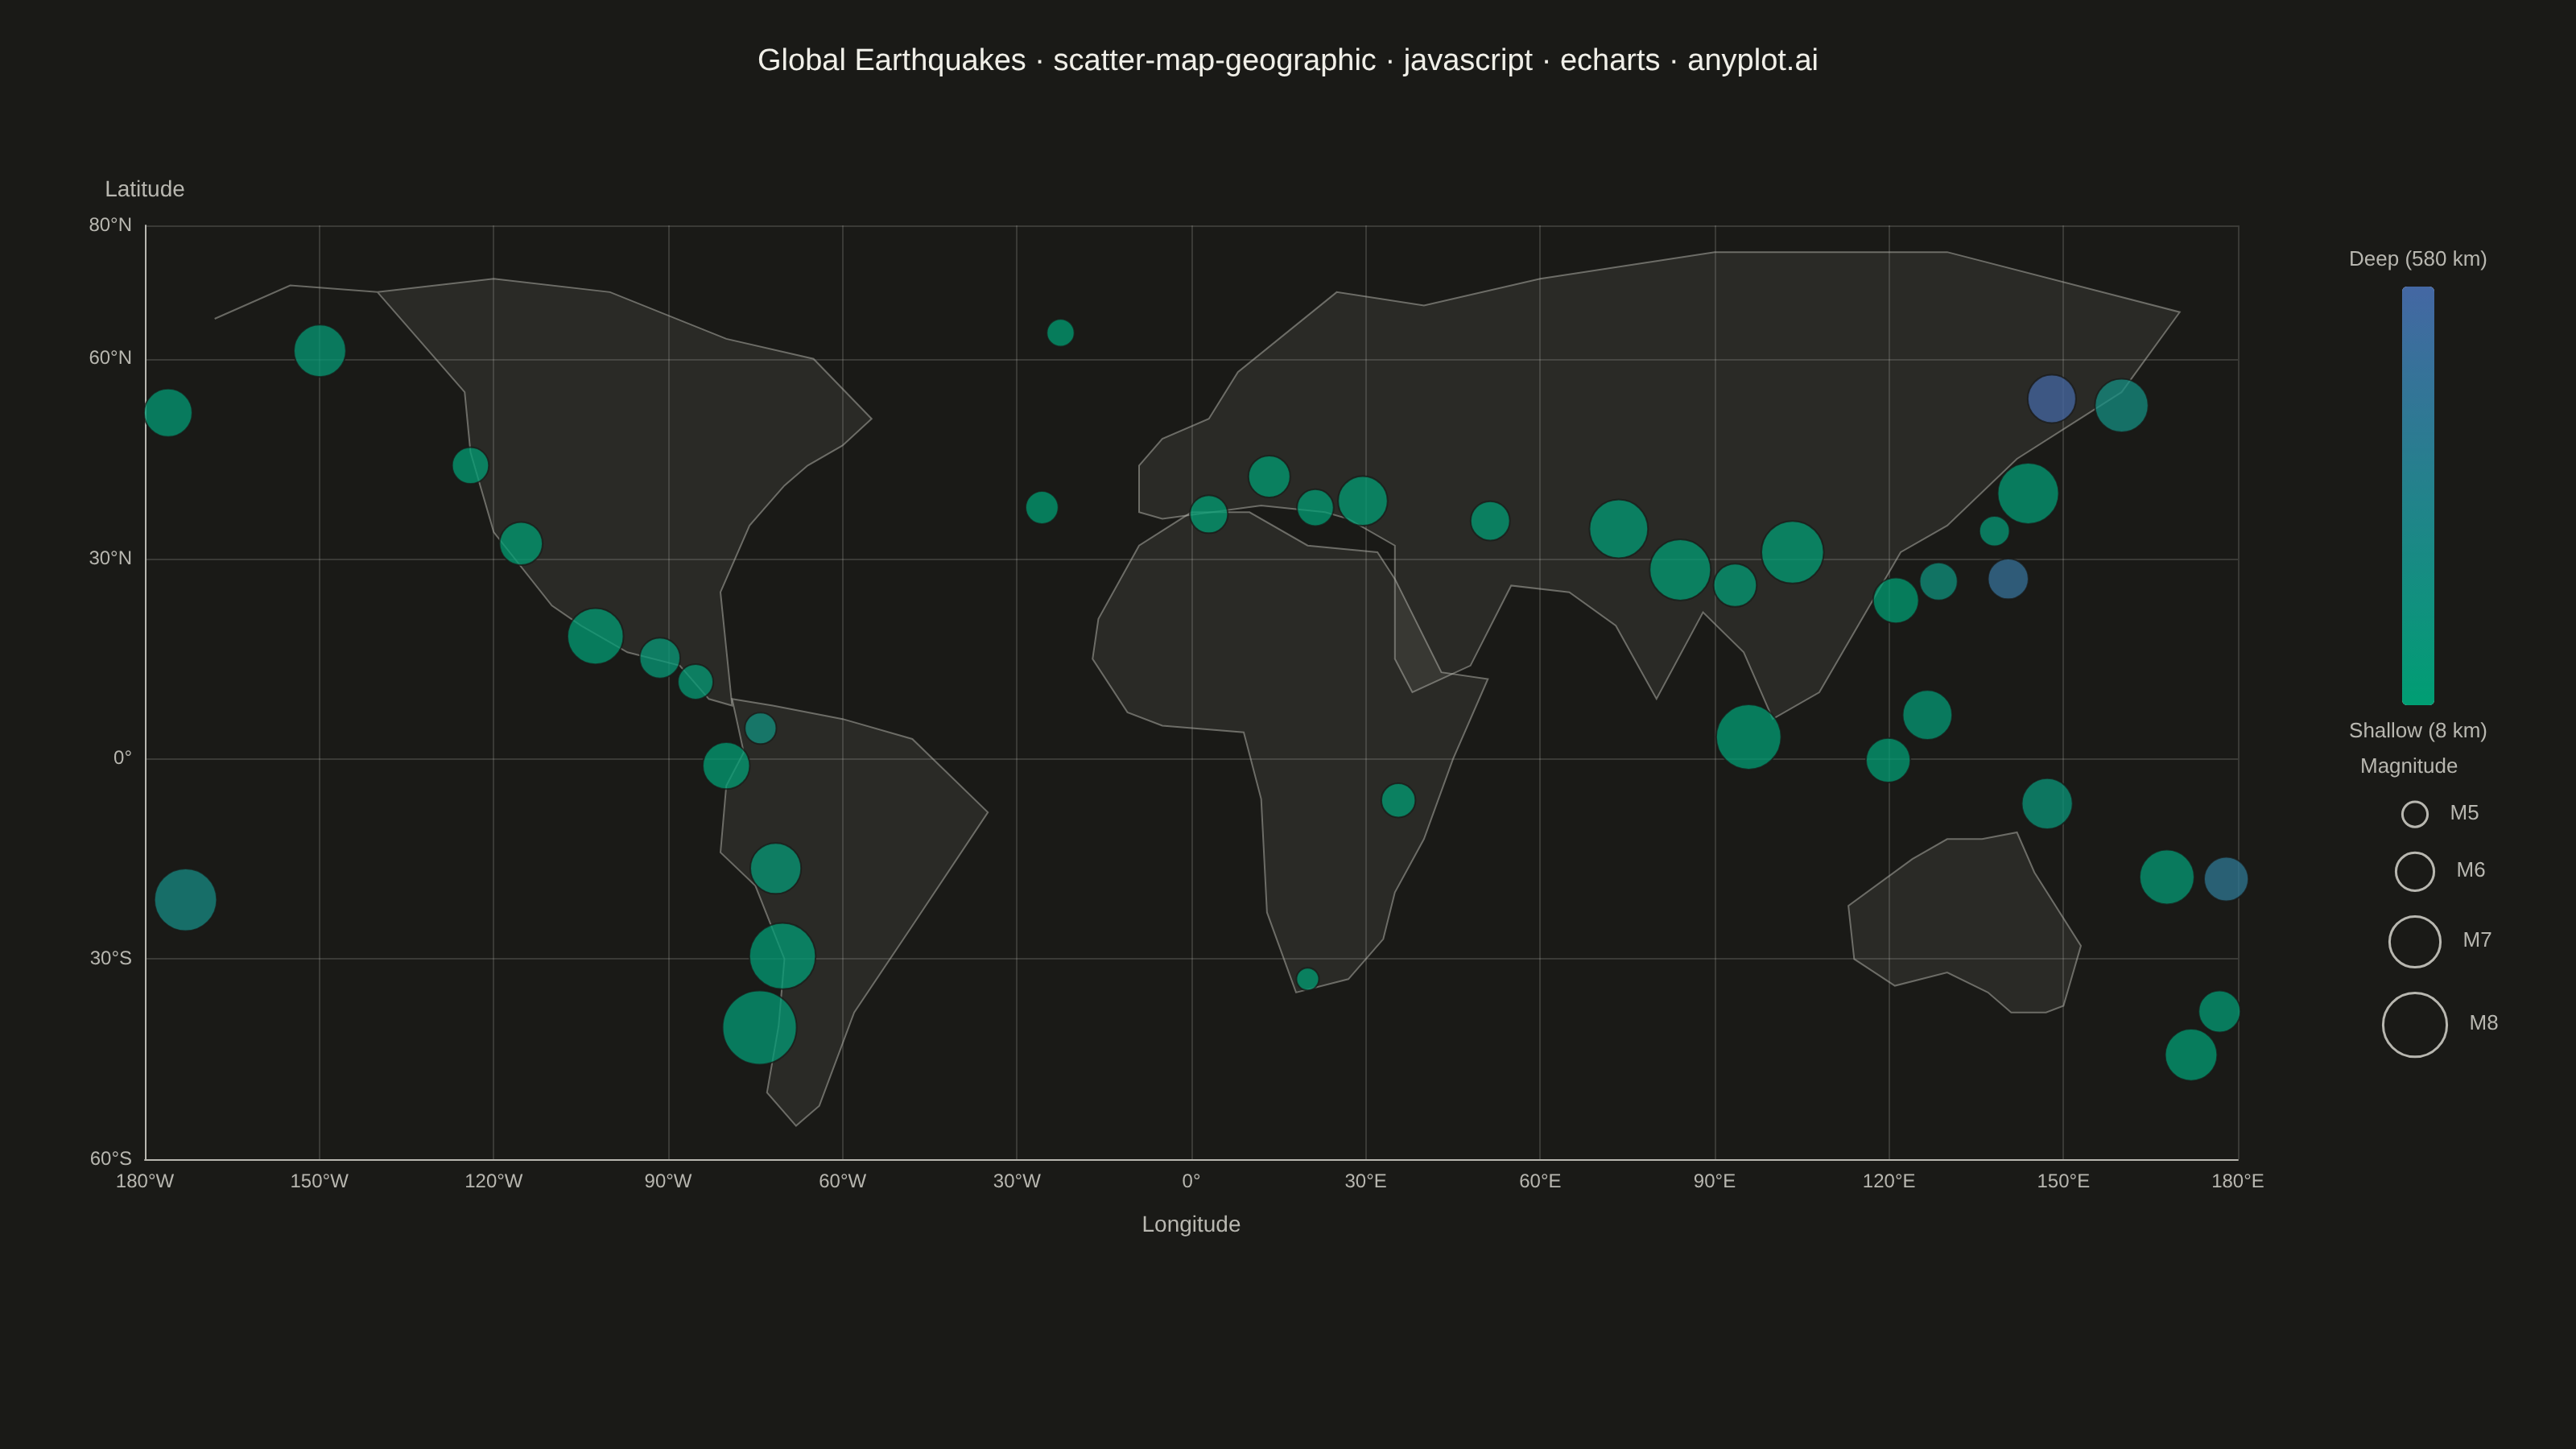
A geographic scatter plot that displays data points on a world or regional map, with each point positioned by its latitude and longitude coordinates. This visualization is ideal for showing spatial distributions of events, locations, or measurements across geographic areas. Points can optionally encode additional variables through size and color, enabling multi-dimensional geographic analysis at a glance.
// anyplot.ai
// scatter-map-geographic: Scatter Map with Geographic Points
// Library: echarts 6.1.0 | JavaScript 22.23.2
// Quality: 90/100 | Created: 2026-09-02
//# anyplot-orientation: landscape

const t = window.ANYPLOT_TOKENS;

// --- Data (in-memory, deterministic) ----------------------------------------
// Notable earthquake epicenters (illustrative, approximate). Magnitude drives
// point size, focal depth drives point color (continuous, imprint_seq).
const RAW_EARTHQUAKES = [
  { place: "Tohoku, Japan", lon: 142.37, lat: 38.3, mag: 7.8, depth: 32 },
  { place: "Sumatra, Indonesia", lon: 95.85, lat: 3.3, mag: 8.1, depth: 22 },
  { place: "Sulawesi, Indonesia", lon: 119.85, lat: -0.18, mag: 6.5, depth: 15 },
  { place: "Mindanao, Philippines", lon: 126.6, lat: 6.6, mag: 6.9, depth: 45 },
  { place: "Kanto, Japan", lon: 139.7, lat: 35.7, mag: 5.4, depth: 60 },
  { place: "Kamchatka, Russia", lon: 160.0, lat: 53.0, mag: 7.2, depth: 180 },
  { place: "Aleutian Islands, USA", lon: -176.0, lat: 51.9, mag: 6.8, depth: 35 },
  { place: "Southern Alaska, USA", lon: -149.9, lat: 61.2, mag: 7.1, depth: 47 },
  { place: "Cascadia, USA", lon: -124.0, lat: 44.0, mag: 5.9, depth: 20 },
  { place: "Baja California, Mexico", lon: -115.3, lat: 32.3, mag: 6.4, depth: 10 },
  { place: "Michoacan, Mexico", lon: -102.5, lat: 18.4, mag: 7.4, depth: 24 },
  { place: "Guatemala", lon: -90.5, lat: 14.6, mag: 6.2, depth: 65 },
  { place: "Managua, Nicaragua", lon: -86.2, lat: 12.1, mag: 5.8, depth: 40 },
  { place: "Valparaiso, Chile", lon: -71.6, lat: -33.0, mag: 8.2, depth: 28 },
  { place: "Concepcion, Chile", lon: -73.0, lat: -36.8, mag: 8.8, depth: 35 },
  { place: "Arequipa, Peru", lon: -71.5, lat: -16.4, mag: 7.0, depth: 55 },
  { place: "Bogota, Colombia", lon: -74.1, lat: 4.6, mag: 5.5, depth: 150 },
  { place: "Ecuador Coast", lon: -80.0, lat: -1.0, mag: 6.7, depth: 20 },
  { place: "Reykjanes, Iceland", lon: -22.5, lat: 63.9, mag: 5.2, depth: 8 },
  { place: "Azores", lon: -25.7, lat: 37.7, mag: 5.6, depth: 12 },
  { place: "L'Aquila, Italy", lon: 13.4, lat: 42.35, mag: 6.3, depth: 9 },
  { place: "Izmir, Turkey", lon: 27.1, lat: 38.4, mag: 6.9, depth: 17 },
  { place: "Athens, Greece", lon: 23.7, lat: 37.98, mag: 5.9, depth: 14 },
  { place: "Tehran, Iran", lon: 51.4, lat: 35.7, mag: 6.1, depth: 25 },
  { place: "Kashmir, Pakistan", lon: 73.5, lat: 34.5, mag: 7.6, depth: 26 },
  { place: "Gorkha, Nepal", lon: 84.7, lat: 28.2, mag: 7.8, depth: 15 },
  { place: "Assam, India", lon: 92.9, lat: 26.2, mag: 6.4, depth: 34 },
  { place: "Sichuan, China", lon: 103.4, lat: 31.0, mag: 7.9, depth: 19 },
  { place: "Taiwan Strait", lon: 121.5, lat: 23.9, mag: 6.6, depth: 12 },
  { place: "Ryukyu Islands, Japan", lon: 128.2, lat: 26.5, mag: 6.0, depth: 130 },
  { place: "Vanuatu", lon: 167.8, lat: -17.7, mag: 7.3, depth: 42 },
  { place: "Tonga Trench", lon: -173.0, lat: -21.1, mag: 7.9, depth: 205 },
  { place: "Fiji", lon: 178.0, lat: -18.0, mag: 6.5, depth: 400 },
  { place: "North Island, New Zealand", lon: 176.2, lat: -38.7, mag: 6.3, depth: 30 },
  { place: "South Island, New Zealand", lon: 172.6, lat: -43.5, mag: 7.1, depth: 15 },
  { place: "Papua New Guinea", lon: 147.2, lat: -6.7, mag: 7.0, depth: 90 },
  { place: "East Africa Rift, Tanzania", lon: 35.6, lat: -6.2, mag: 5.7, depth: 18 },
  { place: "Algiers, Algeria", lon: 3.0, lat: 36.7, mag: 6.0, depth: 10 },
  { place: "Cape Town Margin, S. Africa", lon: 20.0, lat: -33.0, mag: 4.8, depth: 8 },
  { place: "Sea of Okhotsk", lon: 148.0, lat: 54.0, mag: 6.8, depth: 580 },
  { place: "Bonin Islands, Japan", lon: 140.5, lat: 27.0, mag: 6.2, depth: 470 },
];

// --- Basemap: simplified continent silhouettes (rough, low-vertex trace --
// geographic context only, not a precise survey boundary). Rendered as
// unprojected (equirectangular / plate carrée) lon/lat on the chart's own
// value axes rather than a Natural Earth/Robinson or Mercator projection:
// ECharts has no bundled world GeoJSON to register, and reprojecting the
// data points to match a curved projection without fetching one would need
// an extra library. Equirectangular is an accepted world-map tradeoff. -----
const NORTH_AMERICA = [
  [-168, 66], [-155, 71], [-140, 70], [-125, 55], [-124, 46], [-120, 34],
  [-110, 23], [-105, 20], [-97, 16], [-88, 14], [-83, 9], [-79, 8],
  [-81, 25], [-76, 35], [-70, 41], [-66, 44], [-60, 47], [-55, 51],
  [-65, 60], [-80, 63], [-100, 70], [-120, 72], [-140, 70], [-155, 71], [-168, 66],
];
const SOUTH_AMERICA = [
  [-79, 9], [-77, 1], [-80, -4], [-81, -14], [-75, -19], [-70, -30],
  [-71, -40], [-73, -50], [-68, -55], [-64, -52], [-58, -38], [-48, -25],
  [-35, -8], [-48, 3], [-60, 6], [-72, 8], [-79, 9],
];
const AFRICA = [
  [-17, 15], [-16, 21], [-9, 32], [0, 37], [10, 37], [20, 32], [32, 31],
  [35, 27], [43, 13], [51, 12], [45, 0], [40, -12], [35, -20], [33, -27],
  [27, -33], [18, -35], [13, -23], [12, -6], [9, 4], [-5, 5], [-11, 7], [-17, 15],
];
const EURASIA = [
  [-9, 37], [-9, 44], [-5, 48], [3, 51], [8, 58], [25, 70], [40, 68],
  [60, 72], [90, 76], [130, 76], [170, 67], [160, 55], [142, 45], [130, 35],
  [122, 31], [108, 10], [100, 6], [95, 16], [88, 22], [80, 9], [73, 20],
  [65, 25], [55, 26], [48, 14], [38, 10], [35, 15], [35, 32], [27, 36],
  [23, 37], [12, 38], [-5, 36], [-9, 37],
];
const AUSTRALIA = [
  [113, -22], [114, -30], [121, -34], [130, -32], [137, -35], [141, -38],
  [147, -38], [150, -37], [153, -28], [145, -17], [142, -11], [136, -12],
  [130, -12], [124, -15], [113, -22],
];
const CONTINENTS = [NORTH_AMERICA, SOUTH_AMERICA, AFRICA, EURASIA, AUSTRALIA];

// Fills+outlines one continent polygon; coordinates are projected through the
// chart's own lon/lat value axes via api.coord (cartesian2d custom series --
// ECharts has no bundled world GeoJSON to register, so the basemap is drawn
// as ordinary shapes on the same axes the data points use).
function makeLandRenderer(coords) {
  return function renderLand(params, api) {
    const points = coords.map(([lon, lat]) => api.coord([lon, lat]));
    return {
      type: "polygon",
      shape: { points },
      style: { fill: t.grid, stroke: t.inkSoft, lineWidth: 1, opacity: 0.5 },
      silent: true,
    };
  };
}

const MAGS = RAW_EARTHQUAKES.map((e) => e.mag);
const DEPTHS = RAW_EARTHQUAKES.map((e) => e.depth);
const MAG_MIN = Math.min(...MAGS);
const MAG_MAX = Math.max(...MAGS);
const DEPTH_MIN = Math.min(...DEPTHS);
const DEPTH_MAX = Math.max(...DEPTHS);
const SIZE_MIN = 14;
const SIZE_MAX = 46;

// Magnitude is already a log-scaled quantity (each unit ~31x the energy), so
// point diameter scales linearly with magnitude rather than sqrt(value).
function magSize(mag) {
  const ratio = (mag - MAG_MIN) / (MAG_MAX - MAG_MIN);
  return SIZE_MIN + ratio * (SIZE_MAX - SIZE_MIN);
}

// --- Declutter: nudge apart markers whose rendered circles would overlap ----
// (magnitude-driven radii can exceed the geographic spacing between nearby
// epicenters, e.g. Valparaiso/Concepcion, Izmir/Athens). Positions are
// relaxed in the chart's own pixel space, mirroring the axes/grid below, then
// converted back to lon/lat; tooltip content (name/mag/depth) is unaffected.
const GRID = { left: 90, top: 140, width: 1300, height: 580 };
const LON_RANGE = [-180, 180];
const LAT_RANGE = [-60, 80];
function toPx(lon, lat) {
  return [
    ((lon - LON_RANGE[0]) / (LON_RANGE[1] - LON_RANGE[0])) * GRID.width,
    ((LAT_RANGE[1] - lat) / (LAT_RANGE[1] - LAT_RANGE[0])) * GRID.height,
  ];
}
function fromPx(x, y) {
  return [
    LON_RANGE[0] + (x / GRID.width) * (LON_RANGE[1] - LON_RANGE[0]),
    LAT_RANGE[1] - (y / GRID.height) * (LAT_RANGE[1] - LAT_RANGE[0]),
  ];
}
function declutter(points, passes = 6) {
  const px = points.map((p) => toPx(p.lon, p.lat));
  for (let pass = 0; pass < passes; pass++) {
    for (let i = 0; i < points.length; i++) {
      for (let j = i + 1; j < points.length; j++) {
        const dx = px[j][0] - px[i][0];
        const dy = px[j][1] - px[i][1];
        const dist = Math.hypot(dx, dy) || 0.01;
        const minDist = magSize(points[i].mag) / 2 + magSize(points[j].mag) / 2 + 3;
        if (dist < minDist) {
          const push = (minDist - dist) / 2;
          const ux = dx / dist;
          const uy = dy / dist;
          px[i][0] -= ux * push;
          px[i][1] -= uy * push;
          px[j][0] += ux * push;
          px[j][1] += uy * push;
        }
      }
    }
  }
  return points.map((p, i) => {
    const [lon, lat] = fromPx(px[i][0], px[i][1]);
    return { ...p, lon, lat };
  });
}
const EARTHQUAKES = declutter(RAW_EARTHQUAKES);

// --- Init ---------------------------------------------------------------
const chart = echarts.init(document.getElementById("container"));

// --- Magnitude size-key legend (fixed screen-space graphic) -----------------
const MAG_LEGEND_VALUES = [5, 6, 7, 8];
const LEGEND_X = 1500;
const legendGraphics = [
  {
    type: "text",
    left: LEGEND_X - 34,
    top: 470,
    style: { text: "Magnitude", fill: t.inkSoft, fontSize: 13, fontWeight: 500 },
  },
];
let cy = 498;
for (const mag of MAG_LEGEND_VALUES) {
  const r = magSize(mag) / 2;
  cy += r;
  legendGraphics.push({
    type: "circle",
    shape: { cx: LEGEND_X, cy, r },
    style: { fill: "none", stroke: t.inkSoft, lineWidth: 1.5 },
  });
  legendGraphics.push({
    type: "text",
    left: LEGEND_X + r + 14,
    top: cy - 7,
    style: { text: `M${mag}`, fill: t.inkSoft, fontSize: 13 },
  });
  cy += r + 16;
}

// --- Option -----------------------------------------------------------------
const title = "Global Earthquakes · scatter-map-geographic · javascript · echarts · anyplot.ai";

chart.setOption({
  animation: false,
  backgroundColor: "transparent",
  title: {
    text: title,
    left: "center",
    top: 24,
    textStyle: { color: t.ink, fontSize: 19, fontWeight: 500 },
  },
  tooltip: {
    trigger: "item",
    formatter: (p) =>
      `${p.data.name}<br/>M${p.data.value[3].toFixed(1)} · depth ${p.data.value[2]} km`,
  },
  visualMap: {
    type: "continuous",
    dimension: 2,
    seriesIndex: CONTINENTS.length,
    min: DEPTH_MIN,
    max: DEPTH_MAX,
    orient: "vertical",
    right: 40,
    top: 140,
    itemHeight: 260,
    calculable: false,
    text: [`Deep (${DEPTH_MAX} km)`, `Shallow (${DEPTH_MIN} km)`],
    textStyle: { color: t.inkSoft, fontSize: 13 },
    inRange: { color: t.seq },
  },
  grid: GRID,
  dataZoom: [
    { type: "inside", xAxisIndex: 0, filterMode: "none" },
    { type: "inside", yAxisIndex: 0, filterMode: "none" },
  ],
  xAxis: {
    type: "value",
    name: "Longitude",
    nameLocation: "middle",
    nameGap: 34,
    nameTextStyle: { color: t.inkSoft, fontSize: 14 },
    min: LON_RANGE[0],
    max: LON_RANGE[1],
    interval: 30,
    axisLabel: {
      color: t.inkSoft,
      fontSize: 12,
      formatter: (v) => `${Math.abs(v)}°${v < 0 ? "W" : v > 0 ? "E" : ""}`,
    },
    axisLine: { onZero: false, lineStyle: { color: t.inkSoft } },
    axisTick: { show: false },
    splitLine: { lineStyle: { color: t.grid } },
  },
  yAxis: {
    type: "value",
    name: "Latitude",
    nameTextStyle: { color: t.inkSoft, fontSize: 14 },
    min: LAT_RANGE[0],
    max: LAT_RANGE[1],
    interval: 30,
    axisLabel: {
      color: t.inkSoft,
      fontSize: 12,
      formatter: (v) => `${Math.abs(v)}°${v < 0 ? "S" : v > 0 ? "N" : ""}`,
    },
    axisLine: { onZero: false, lineStyle: { color: t.inkSoft } },
    axisTick: { show: false },
    splitLine: { lineStyle: { color: t.grid } },
  },
  graphic: legendGraphics,
  series: [
    ...CONTINENTS.map((coords, i) => ({
      name: `Basemap ${i}`,
      type: "custom",
      coordinateSystem: "cartesian2d",
      renderItem: makeLandRenderer(coords),
      data: [[0, 0]],
      silent: true,
      tooltip: { show: false },
      z: 0,
    })),
    {
      name: "Earthquakes",
      type: "scatter",
      data: EARTHQUAKES.map((e) => ({
        name: e.place,
        value: [e.lon, e.lat, e.depth, e.mag],
      })),
      symbolSize: (val) => magSize(val[3]),
      itemStyle: { opacity: 0.75, borderColor: t.pageBg, borderWidth: 1 },
      emphasis: { itemStyle: { opacity: 1 } },
      z: 2,
    },
  ],
});
Runnable source as JSON, for any HTTP client: https://api.anyplot.ai/specs/scatter-map-geographic/echarts/code. Any spec id and library id listed in llms-full.txt fit the same URL shape; every URL below is complete and callable.
{
  "spec_id": "scatter-map-geographic",
  "language": "javascript",
  "library": "echarts",
  "page": "https://anyplot.ai/scatter-map-geographic/javascript/echarts",
  "hub": "https://anyplot.ai/scatter-map-geographic",
  "code_json": "https://api.anyplot.ai/specs/scatter-map-geographic/echarts/code",
  "spec_json": "https://api.anyplot.ai/specs/scatter-map-geographic",
  "render_light_png": "https://storage.googleapis.com/anyplot-images/plots/scatter-map-geographic/javascript/echarts/plot-light.png",
  "render_dark_png": "https://storage.googleapis.com/anyplot-images/plots/scatter-map-geographic/javascript/echarts/plot-dark.png",
  "interactive_light_html": "https://storage.googleapis.com/anyplot-images/plots/scatter-map-geographic/javascript/echarts/plot-light.html",
  "interactive_dark_html": "https://storage.googleapis.com/anyplot-images/plots/scatter-map-geographic/javascript/echarts/plot-dark.html",
  "quality_score": 90.0,
  "license": "MIT",
  "guide": "https://anyplot.ai/llms.txt"
}
Part of Scatter Map with Geographic Points on anyplot.ai.