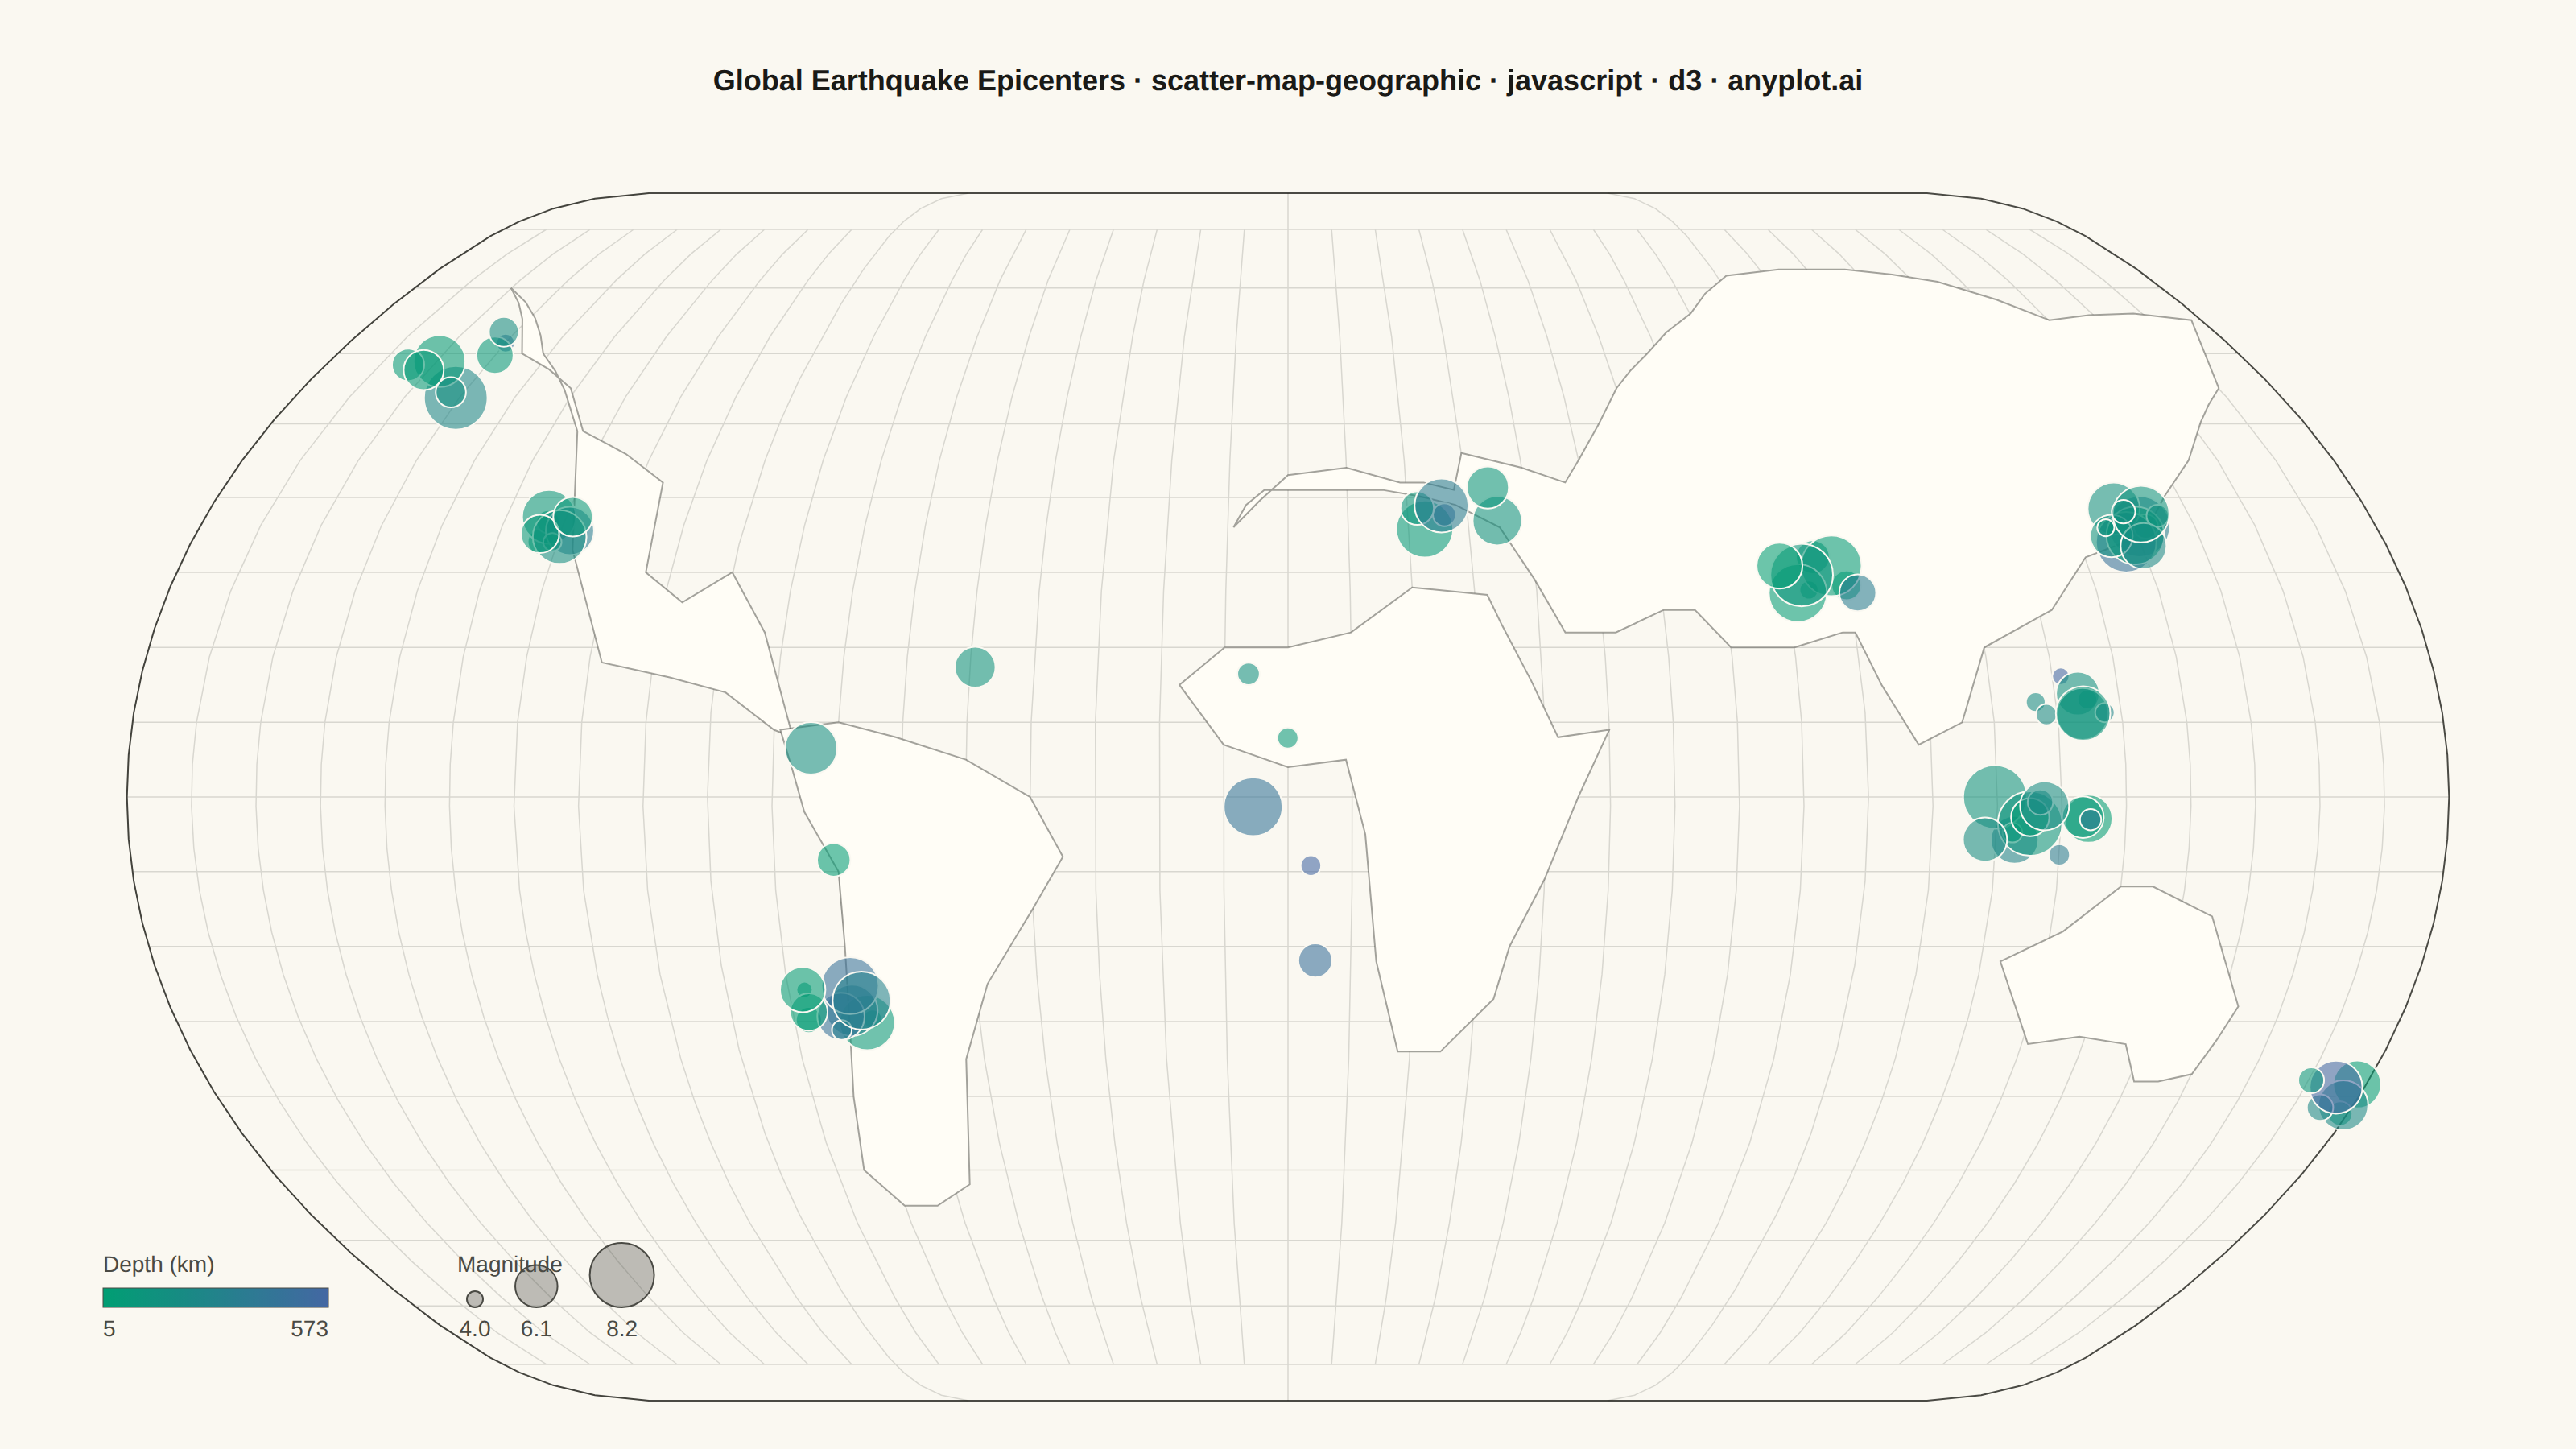
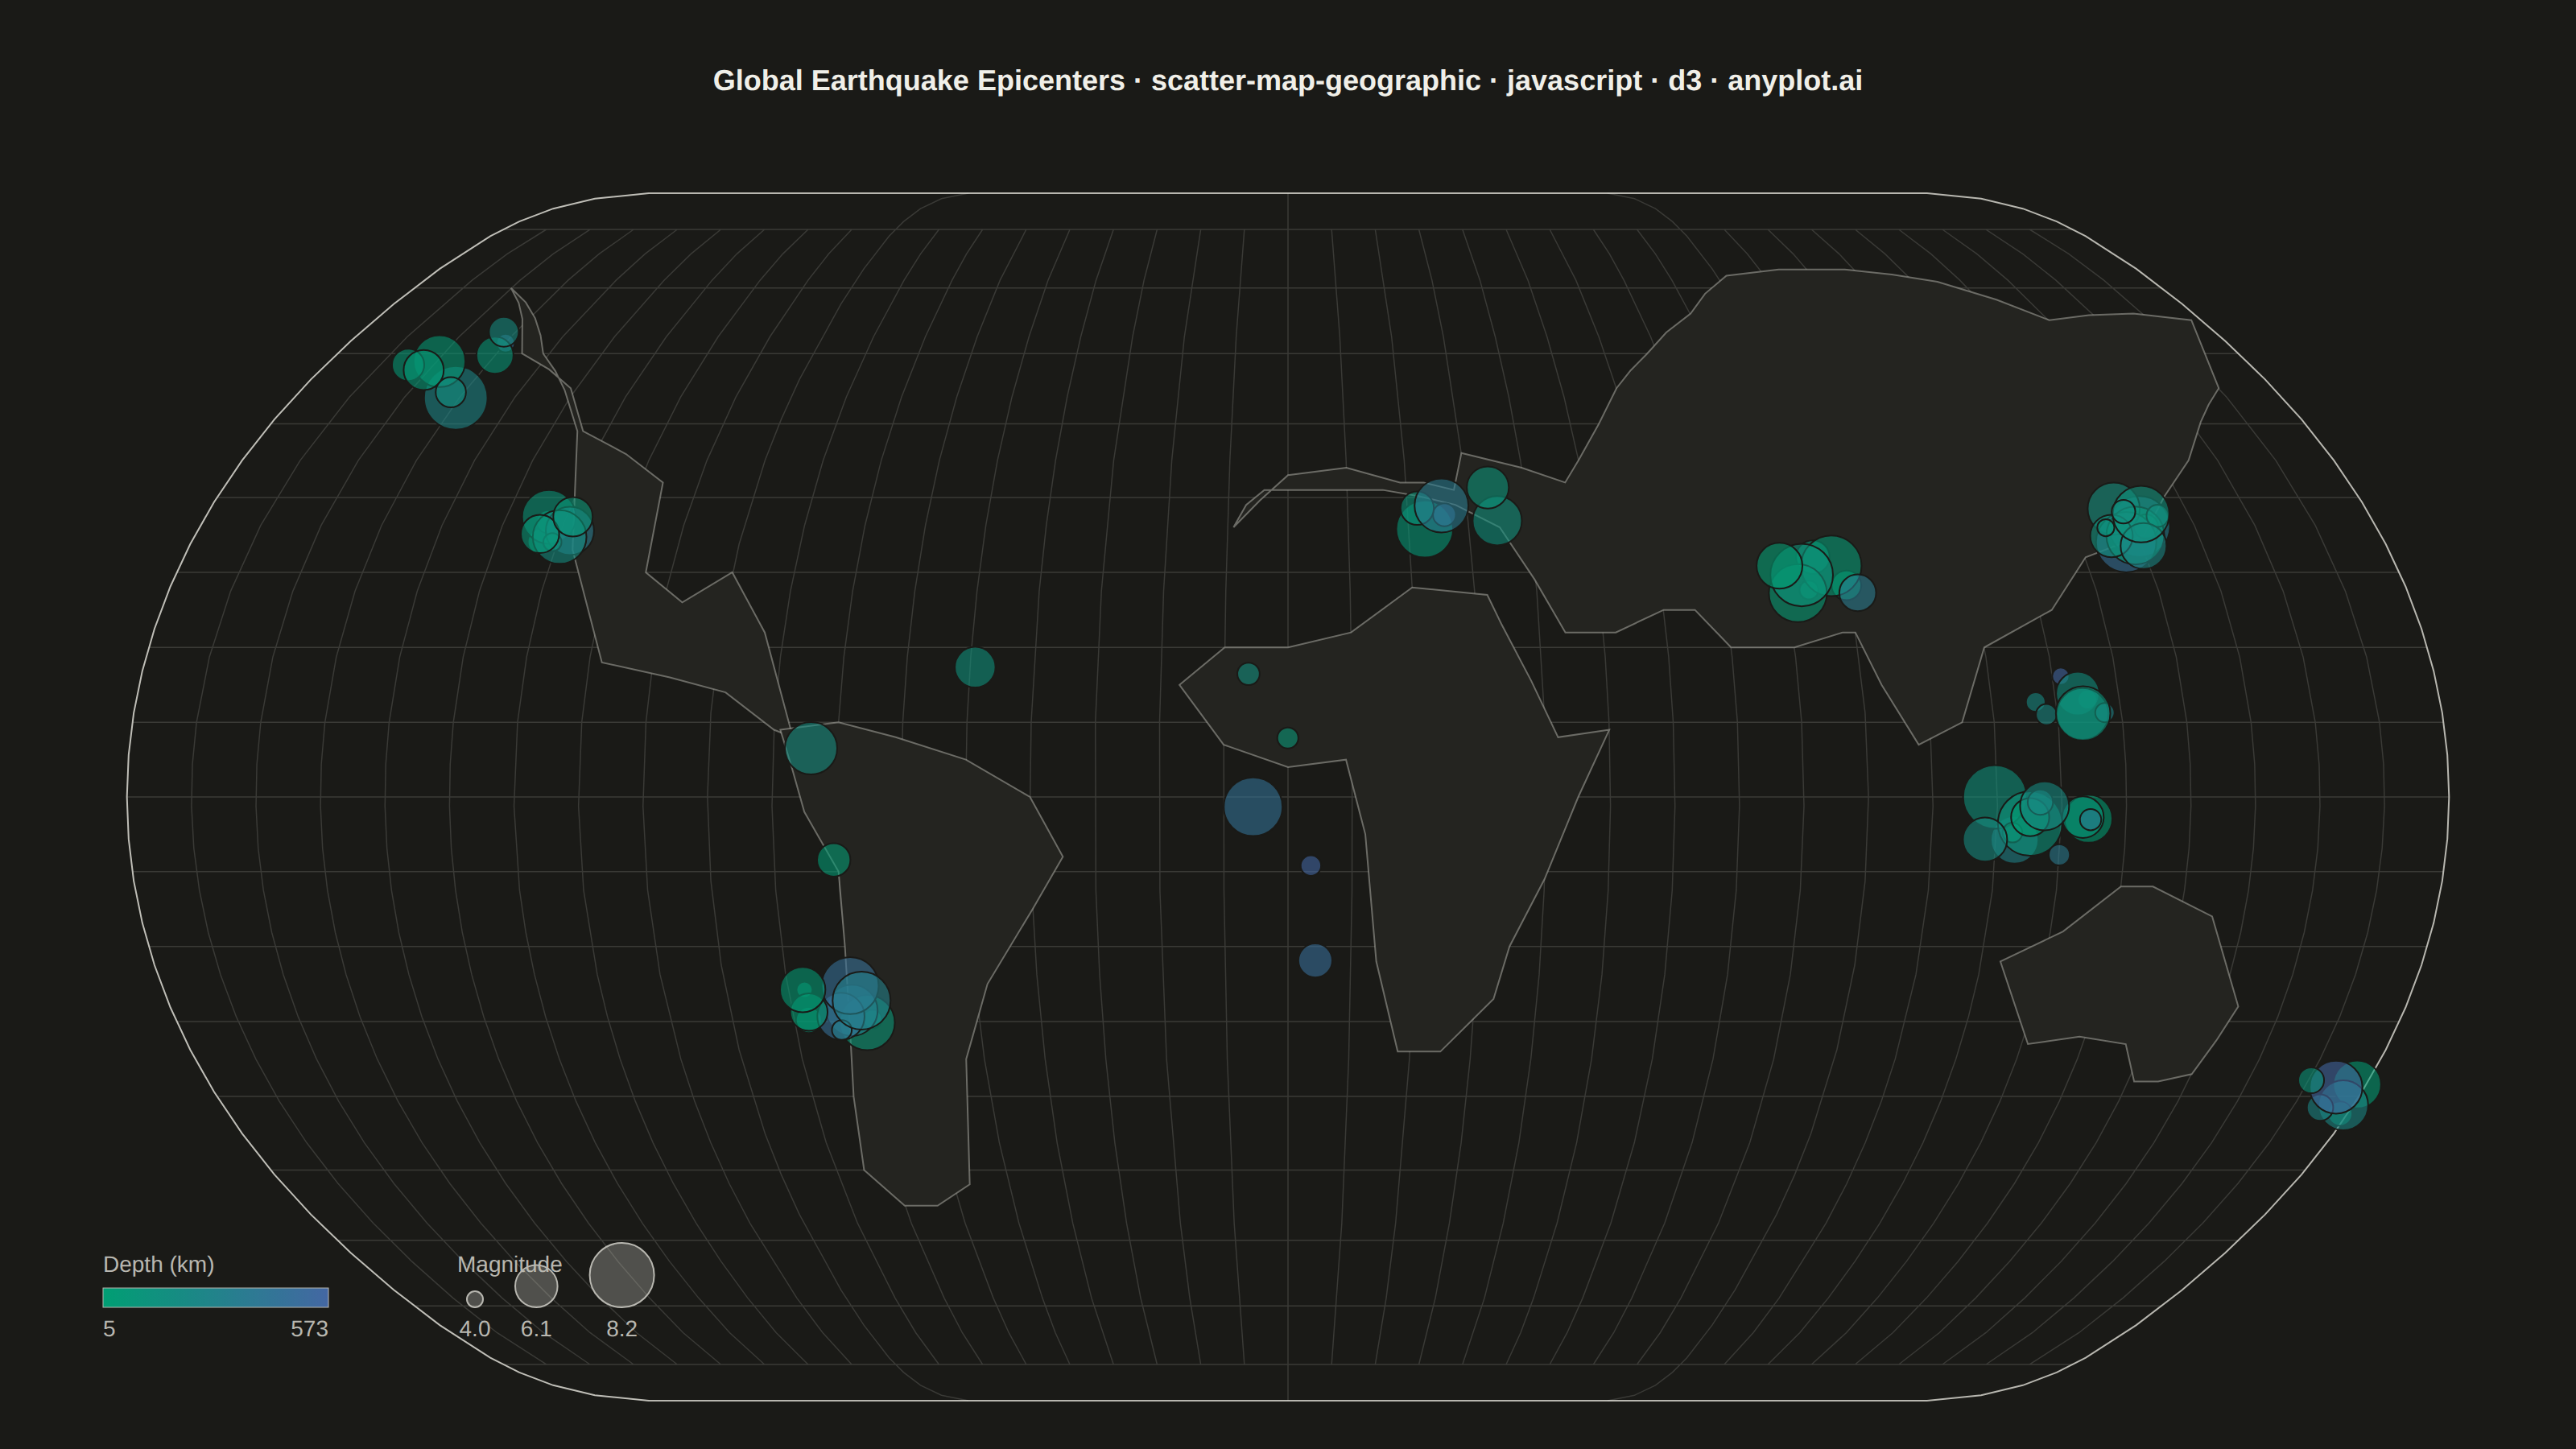
The same plot in 14 other libraries — JavaScript: Chart.js, Apache ECharts, Highcharts, MUI X Charts; Python: Altair, Bokeh, lets-plot, Matplotlib, Plotly, plotnine, Pygal, Seaborn; R: ggplot2; Julia: Makie.jl. Compare all 15 side by side: Scatter Map with Geographic Points in Python, R, Julia and JavaScript.
A geographic scatter plot that displays data points on a world or regional map, with each point positioned by its latitude and longitude coordinates. This visualization is ideal for showing spatial distributions of events, locations, or measurements across geographic areas. Points can optionally encode additional variables through size and color, enabling multi-dimensional geographic analysis at a glance.
// anyplot.ai
// scatter-map-geographic: Scatter Map with Geographic Points
// Library: d3 7.9.0 | JavaScript 22.23.2
// Quality: 89/100 | Created: 2026-09-02

//# anyplot-orientation: landscape

const t = window.ANYPLOT_TOKENS;
const { width, height } = window.ANYPLOT_SIZE;
const margin = { top: 120, right: 40, bottom: 30, left: 40 };
const iw = width - margin.left - margin.right;
const ih = height - margin.top - margin.bottom;

// --- Simplified world coastlines (low-poly, in-memory GeoJSON) --------------
const northAmerica = [
  [-160, 70], [-141, 60], [-125, 49], [-117, 33], [-108, 18], [-97, 16],
  [-88, 14], [-80, 9], [-77, 8], [-83, 22], [-90, 30], [-97, 26], [-104, 30],
  [-106, 42], [-124, 49], [-131, 55], [-145, 60], [-160, 70],
].reverse();
const southAmerica = [
  [-79, 9], [-77, 4], [-75, -2], [-70, -10], [-70, -20], [-71, -30],
  [-73, -40], [-75, -50], [-70, -55], [-64, -55], [-57, -52], [-53, -35],
  [-48, -25], [-40, -15], [-35, -8], [-40, 0], [-50, 5], [-61, 8], [-70, 10],
  [-79, 9],
].reverse();
const africa = [
  [-17, 15], [-10, 20], [0, 20], [10, 22], [20, 28], [32, 27], [34, 23],
  [42, 8], [50, 9], [45, 0], [40, -11], [35, -20], [33, -27], [25, -34],
  [18, -34], [14, -22], [12, -5], [9, 5], [0, 4], [-10, 7], [-17, 15],
];
// Southern boundary follows the Mediterranean/Red Sea/Gulf of Aden north
// shore (not the African coast), well above Africa's northern coastline
// above, so a clearly visible sea gap separates Eurasia from Africa below.
const eurasia = [
  [-9, 36], [0, 43], [10, 44], [19, 42], [23, 42], [28, 41], [30, 46],
  [40, 44], [47, 42], [50, 45], [55, 50], [60, 55], [68, 60], [80, 66],
  [92, 72], [104, 73], [118, 73], [135, 71], [150, 65], [168, 66], [178, 65],
  [170, 55], [155, 45], [141, 35], [130, 32], [122, 25], [110, 20], [105, 10],
  [98, 7], [93, 15], [90, 22], [88, 22], [80, 20], [70, 20], [65, 25],
  [60, 25], [52, 22], [44, 22], [35, 36], [28, 39], [16, 41], [6, 41],
  [-4, 41], [-7, 39], [-9, 36],
];
const australia = [
  [113, -22], [121, -33], [129, -32], [137, -33], [141, -38], [145, -38],
  [150, -37], [153, -28], [145, -16], [135, -12], [130, -12], [122, -18],
  [113, -22],
].reverse();
const landmasses = {
  type: "FeatureCollection",
  features: [northAmerica, southAmerica, africa, eurasia, australia].map(
    (ring) => ({ type: "Feature", geometry: { type: "Polygon", coordinates: [ring] } })
  ),
};

// --- Data: earthquake epicenters along major fault lines --------------------
// Small fixed-seed LCG — the browser has no seeded RNG.
let seed = 42;
const rand = () => {
  seed = (seed * 1103515245 + 12345) & 0x7fffffff;
  return seed / 0x7fffffff;
};

const faultClusters = [
  { lon: 140, lat: 36, spread: 5, n: 11 }, // Japan Trench
  { lon: 118, lat: -4, spread: 10, n: 12 }, // Indonesia
  { lon: 122, lat: 13, spread: 7, n: 8 }, // Philippines
  { lon: -71, lat: -28, spread: 7, n: 11 }, // Chile
  { lon: -120, lat: 36, spread: 4, n: 8 }, // California
  { lon: -155, lat: 58, spread: 11, n: 8 }, // Aleutians
  { lon: 174, lat: -40, spread: 5, n: 6 }, // New Zealand
  { lon: 85, lat: 29, spread: 7, n: 8 }, // Himalaya
  { lon: 28, lat: 38, spread: 7, n: 6 }, // Anatolia
  { lon: -30, lat: 0, spread: 45, n: 8 }, // Mid-Atlantic Ridge
];

const epicenters = [];
for (const c of faultClusters) {
  for (let i = 0; i < c.n; i++) {
    const lon = Math.max(-179, Math.min(179, c.lon + (rand() - 0.5) * c.spread * 2));
    const lat = Math.max(-80, Math.min(80, c.lat + (rand() - 0.5) * c.spread));
    const magnitude = 4.0 + rand() * 4.2;
    const depthKm = 5 + rand() * rand() * 640;
    epicenters.push({ lon, lat, magnitude, depthKm });
  }
}

// --- Projection + path -------------------------------------------------------
const projection = d3.geoNaturalEarth1().fitSize([iw, ih], { type: "Sphere" });
const path = d3.geoPath(projection);

const svg = d3.select("#container").append("svg").attr("width", width).attr("height", height);
const g = svg.append("g").attr("transform", `translate(${margin.left},${margin.top})`);

// Zoomable layer: sphere/graticule/land/points pan+zoom together; the title
// and legends stay fixed in screen space (per the spec's zoom/pan suggestion).
const mapLayer = g.append("g");

// --- Basemap: sphere outline, graticule, coastlines --------------------------
mapLayer
  .append("path")
  .datum({ type: "Sphere" })
  .attr("d", path)
  .attr("fill", "none")
  .attr("stroke", t.inkSoft)
  .attr("stroke-width", 1);

mapLayer
  .append("path")
  .datum(d3.geoGraticule10())
  .attr("d", path)
  .attr("fill", "none")
  .attr("stroke", t.grid)
  .attr("stroke-width", 0.75);

mapLayer
  .selectAll("path.land")
  .data(landmasses.features)
  .join("path")
  .attr("class", "land")
  .attr("d", path)
  .attr("fill", t.elevatedBg)
  .attr("stroke", t.inkSoft)
  .attr("stroke-opacity", 0.5)
  .attr("stroke-width", 1);

// --- Scales -------------------------------------------------------------------
const depthExtent = d3.extent(epicenters, (d) => d.depthKm);
const magExtent = d3.extent(epicenters, (d) => d.magnitude);
const color = d3.scaleSequential(d3.interpolateRgbBasis(t.seq)).domain(depthExtent);
const radius = d3.scaleSqrt().domain(magExtent).range([5, 20]);

// --- Points ---------------------------------------------------------------
mapLayer
  .selectAll("circle.epicenter")
  .data(epicenters)
  .join("circle")
  .attr("class", "epicenter")
  .attr("cx", (d) => projection([d.lon, d.lat])[0])
  .attr("cy", (d) => projection([d.lon, d.lat])[1])
  .attr("r", (d) => radius(d.magnitude))
  .attr("fill", (d) => color(d.depthKm))
  .attr("fill-opacity", 0.58)
  .attr("stroke", t.pageBg)
  .attr("stroke-width", 1);

// --- Zoom/pan: explore dense clusters (identity transform at rest, so the
// static screenshot is unaffected) ---------------------------------------
const zoom = d3
  .zoom()
  .scaleExtent([1, 8])
  .translateExtent([
    [0, 0],
    [iw, ih],
  ])
  .on("zoom", (event) => mapLayer.attr("transform", event.transform));
svg.call(zoom);

// --- Legend: depth (color, sequential) ---------------------------------------
const legendX = 24;
const legendY = ih - 70;
const gradientId = "depthGradient";
const defs = svg.append("defs");
const gradient = defs.append("linearGradient").attr("id", gradientId);
d3.range(0, 1.0001, 0.1).forEach((s) =>
  gradient
    .append("stop")
    .attr("offset", `${s * 100}%`)
    .attr("stop-color", color(depthExtent[0] + s * (depthExtent[1] - depthExtent[0])))
);

const legend = g.append("g").attr("transform", `translate(${legendX},${legendY})`);
legend
  .append("text")
  .attr("x", 0)
  .attr("y", -10)
  .attr("fill", t.inkSoft)
  .style("font-size", "14px")
  .text("Depth (km)");
legend
  .append("rect")
  .attr("width", 140)
  .attr("height", 12)
  .attr("fill", `url(#${gradientId})`)
  .attr("stroke", t.inkSoft)
  .attr("stroke-width", 0.5);
legend
  .append("text")
  .attr("x", 0)
  .attr("y", 30)
  .attr("fill", t.inkSoft)
  .style("font-size", "14px")
  .text(`${Math.round(depthExtent[0])}`);
legend
  .append("text")
  .attr("x", 140)
  .attr("y", 30)
  .attr("text-anchor", "end")
  .attr("fill", t.inkSoft)
  .style("font-size", "14px")
  .text(`${Math.round(depthExtent[1])}`);

// --- Legend: magnitude (size) --------------------------------------------
const sizeLegend = g.append("g").attr("transform", `translate(${legendX + 220},${legendY})`);
sizeLegend
  .append("text")
  .attr("x", 0)
  .attr("y", -10)
  .attr("fill", t.inkSoft)
  .style("font-size", "14px")
  .text("Magnitude");
const magSteps = [magExtent[0], (magExtent[0] + magExtent[1]) / 2, magExtent[1]];
let cx = 0;
magSteps.forEach((m) => {
  const r = radius(m);
  cx += r + 6;
  sizeLegend
    .append("circle")
    .attr("cx", cx)
    .attr("cy", 12 - r)
    .attr("r", r)
    .attr("fill", t.inkSoft)
    .attr("fill-opacity", 0.35)
    .attr("stroke", t.inkSoft)
    .attr("stroke-width", 1);
  sizeLegend
    .append("text")
    .attr("x", cx)
    .attr("y", 30)
    .attr("text-anchor", "middle")
    .attr("fill", t.inkSoft)
    .style("font-size", "14px")
    .text(m.toFixed(1));
  cx += r + 14;
});

// --- Title --------------------------------------------------------------
const title = "Global Earthquake Epicenters · scatter-map-geographic · javascript · d3 · anyplot.ai";
const titleFontSize = Math.round(22 * Math.min(1, 67 / title.length));
svg
  .append("text")
  .attr("x", width / 2)
  .attr("y", 56)
  .attr("text-anchor", "middle")
  .attr("fill", t.ink)
  .style("font-size", `${titleFontSize}px`)
  .style("font-weight", "600")
  .text(title);
Runnable source as JSON, for any HTTP client: https://api.anyplot.ai/specs/scatter-map-geographic/d3/code. Any spec id and library id listed in llms-full.txt fit the same URL shape; every URL below is complete and callable.
{
  "spec_id": "scatter-map-geographic",
  "language": "javascript",
  "library": "d3",
  "page": "https://anyplot.ai/scatter-map-geographic/javascript/d3",
  "hub": "https://anyplot.ai/scatter-map-geographic",
  "code_json": "https://api.anyplot.ai/specs/scatter-map-geographic/d3/code",
  "spec_json": "https://api.anyplot.ai/specs/scatter-map-geographic",
  "render_light_png": "https://storage.googleapis.com/anyplot-images/plots/scatter-map-geographic/javascript/d3/plot-light.png",
  "render_dark_png": "https://storage.googleapis.com/anyplot-images/plots/scatter-map-geographic/javascript/d3/plot-dark.png",
  "interactive_light_html": "https://storage.googleapis.com/anyplot-images/plots/scatter-map-geographic/javascript/d3/plot-light.html",
  "interactive_dark_html": "https://storage.googleapis.com/anyplot-images/plots/scatter-map-geographic/javascript/d3/plot-dark.html",
  "quality_score": 89.0,
  "license": "MIT",
  "guide": "https://anyplot.ai/llms.txt"
}
Part of Scatter Map with Geographic Points on anyplot.ai.