The same plot in 14 other libraries — JavaScript: D3.js, Apache ECharts, Highcharts, MUI X Charts; Python: Altair, Bokeh, lets-plot, Matplotlib, Plotly, plotnine, Pygal, Seaborn; R: ggplot2; Julia: Makie.jl. Compare all 15 side by side: Scatter Map with Geographic Points in Python, R, Julia and JavaScript.
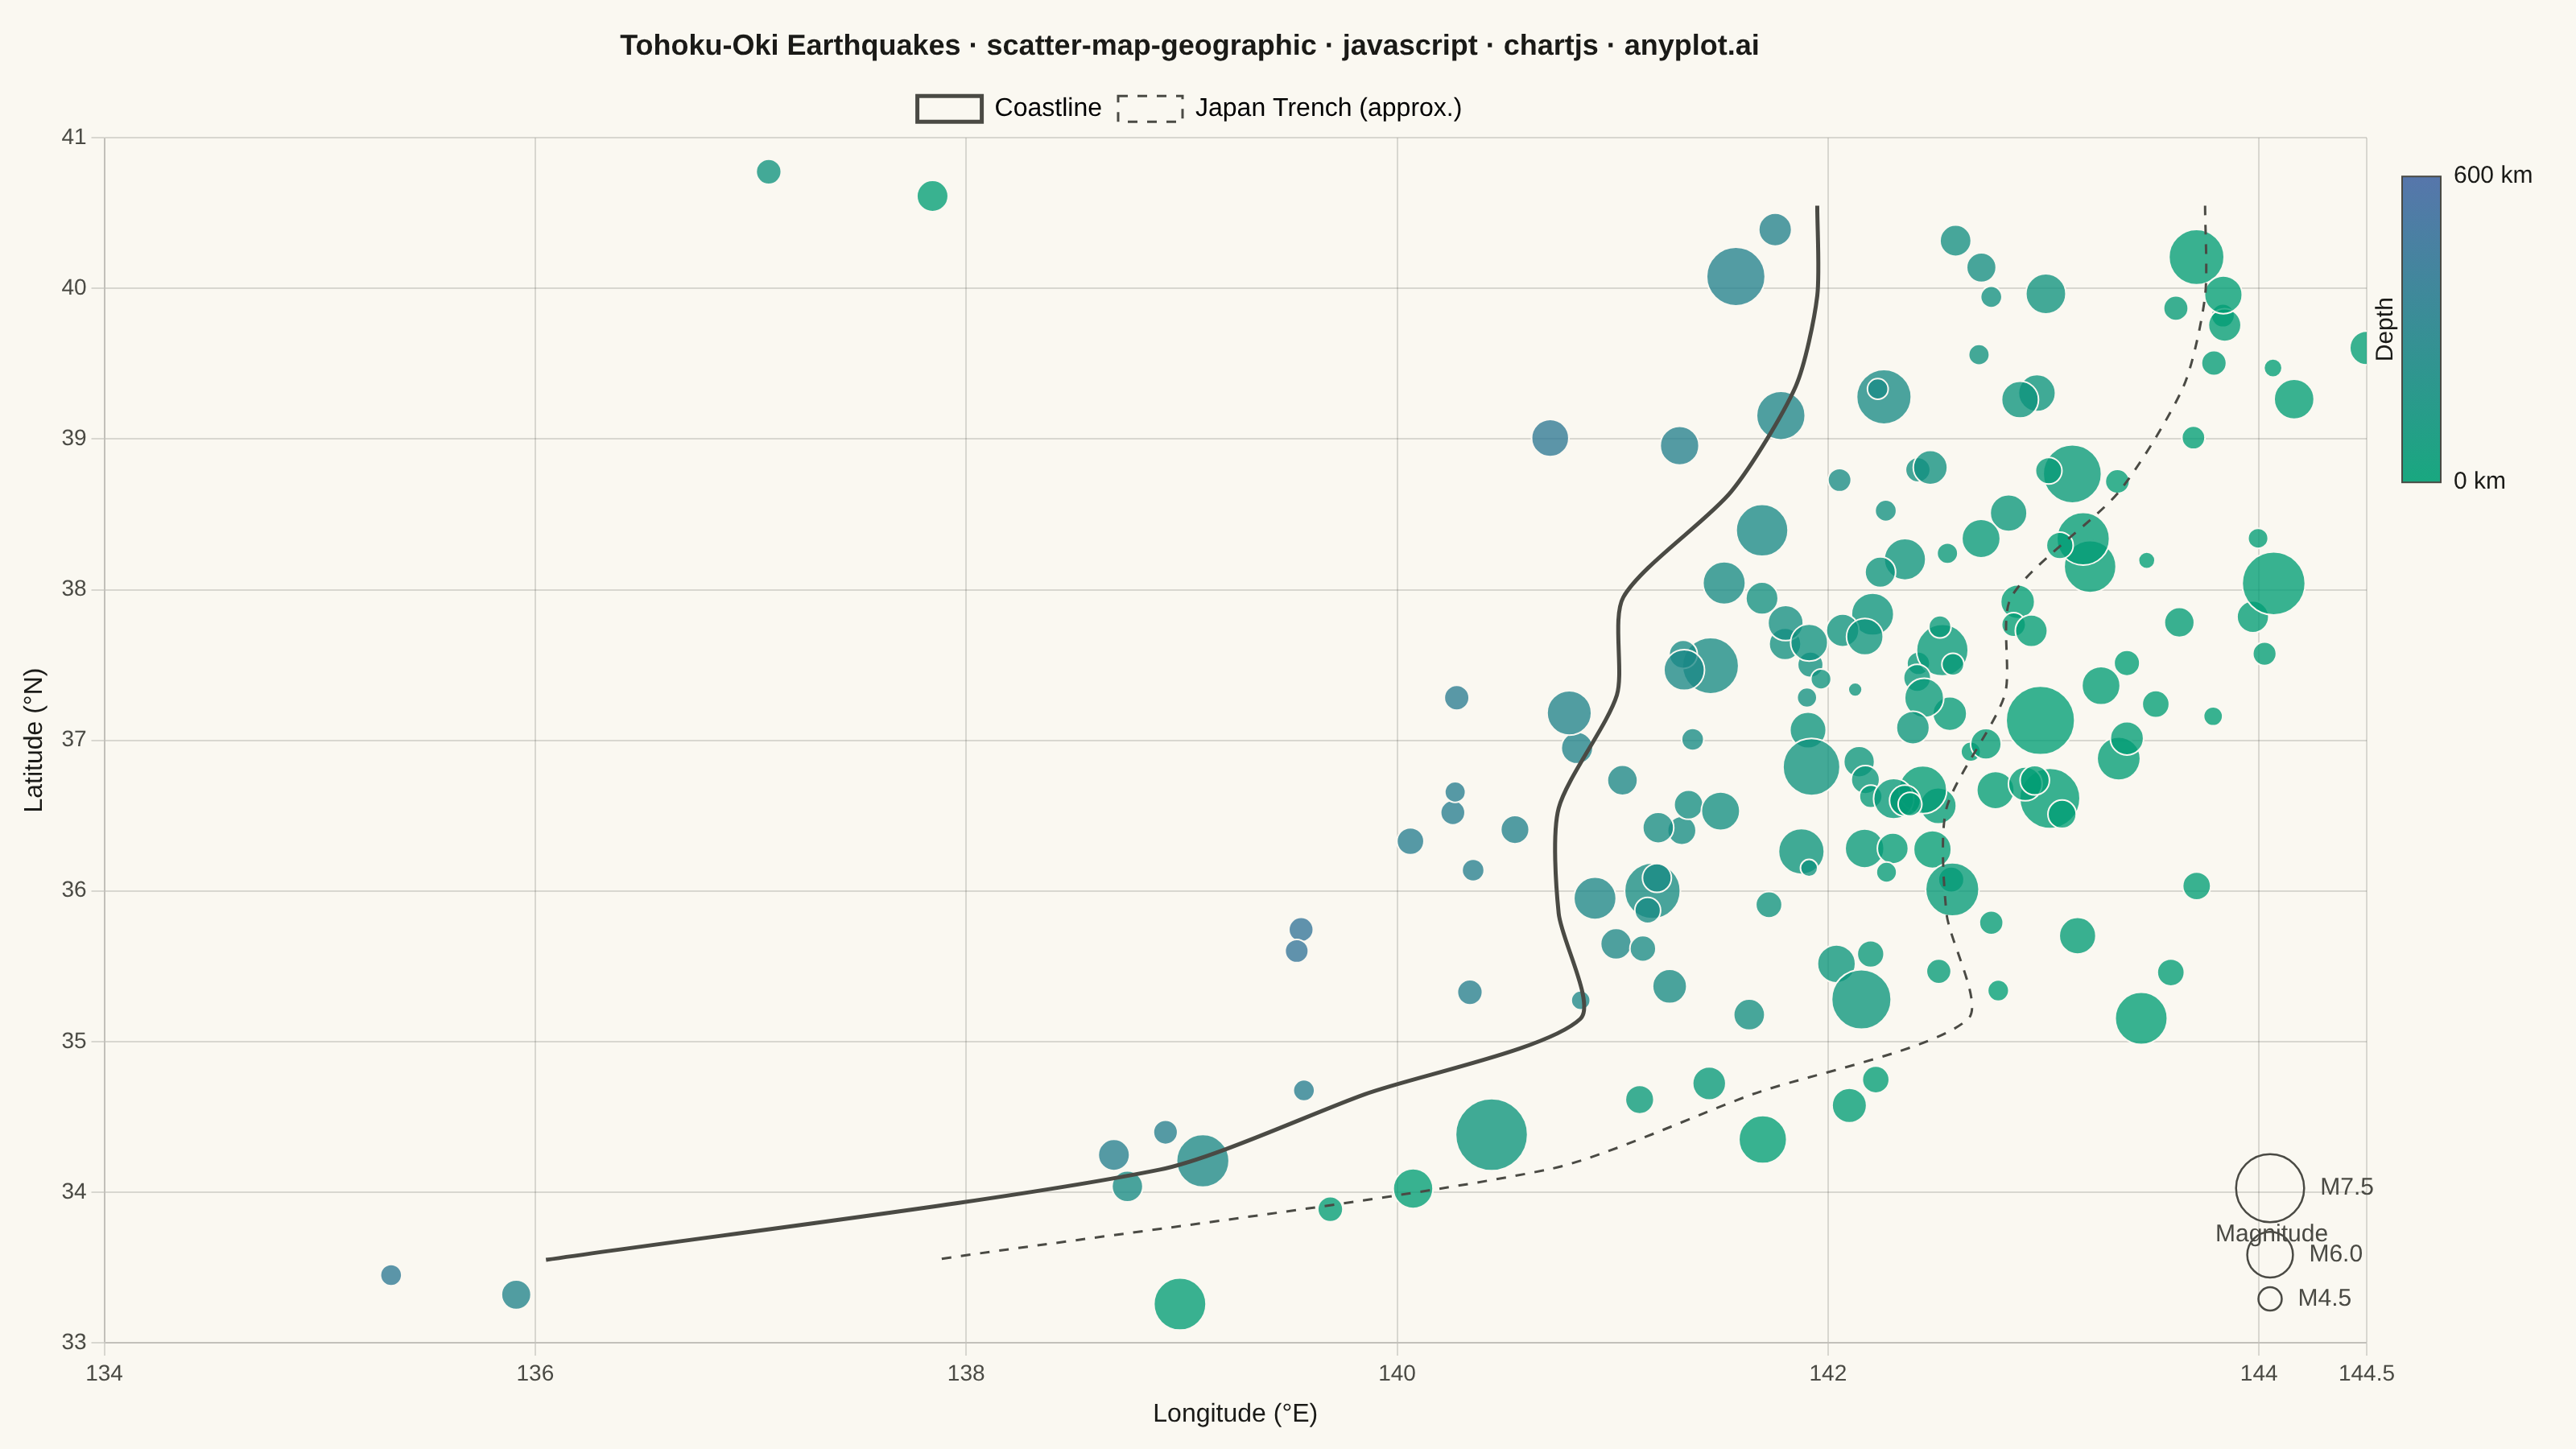
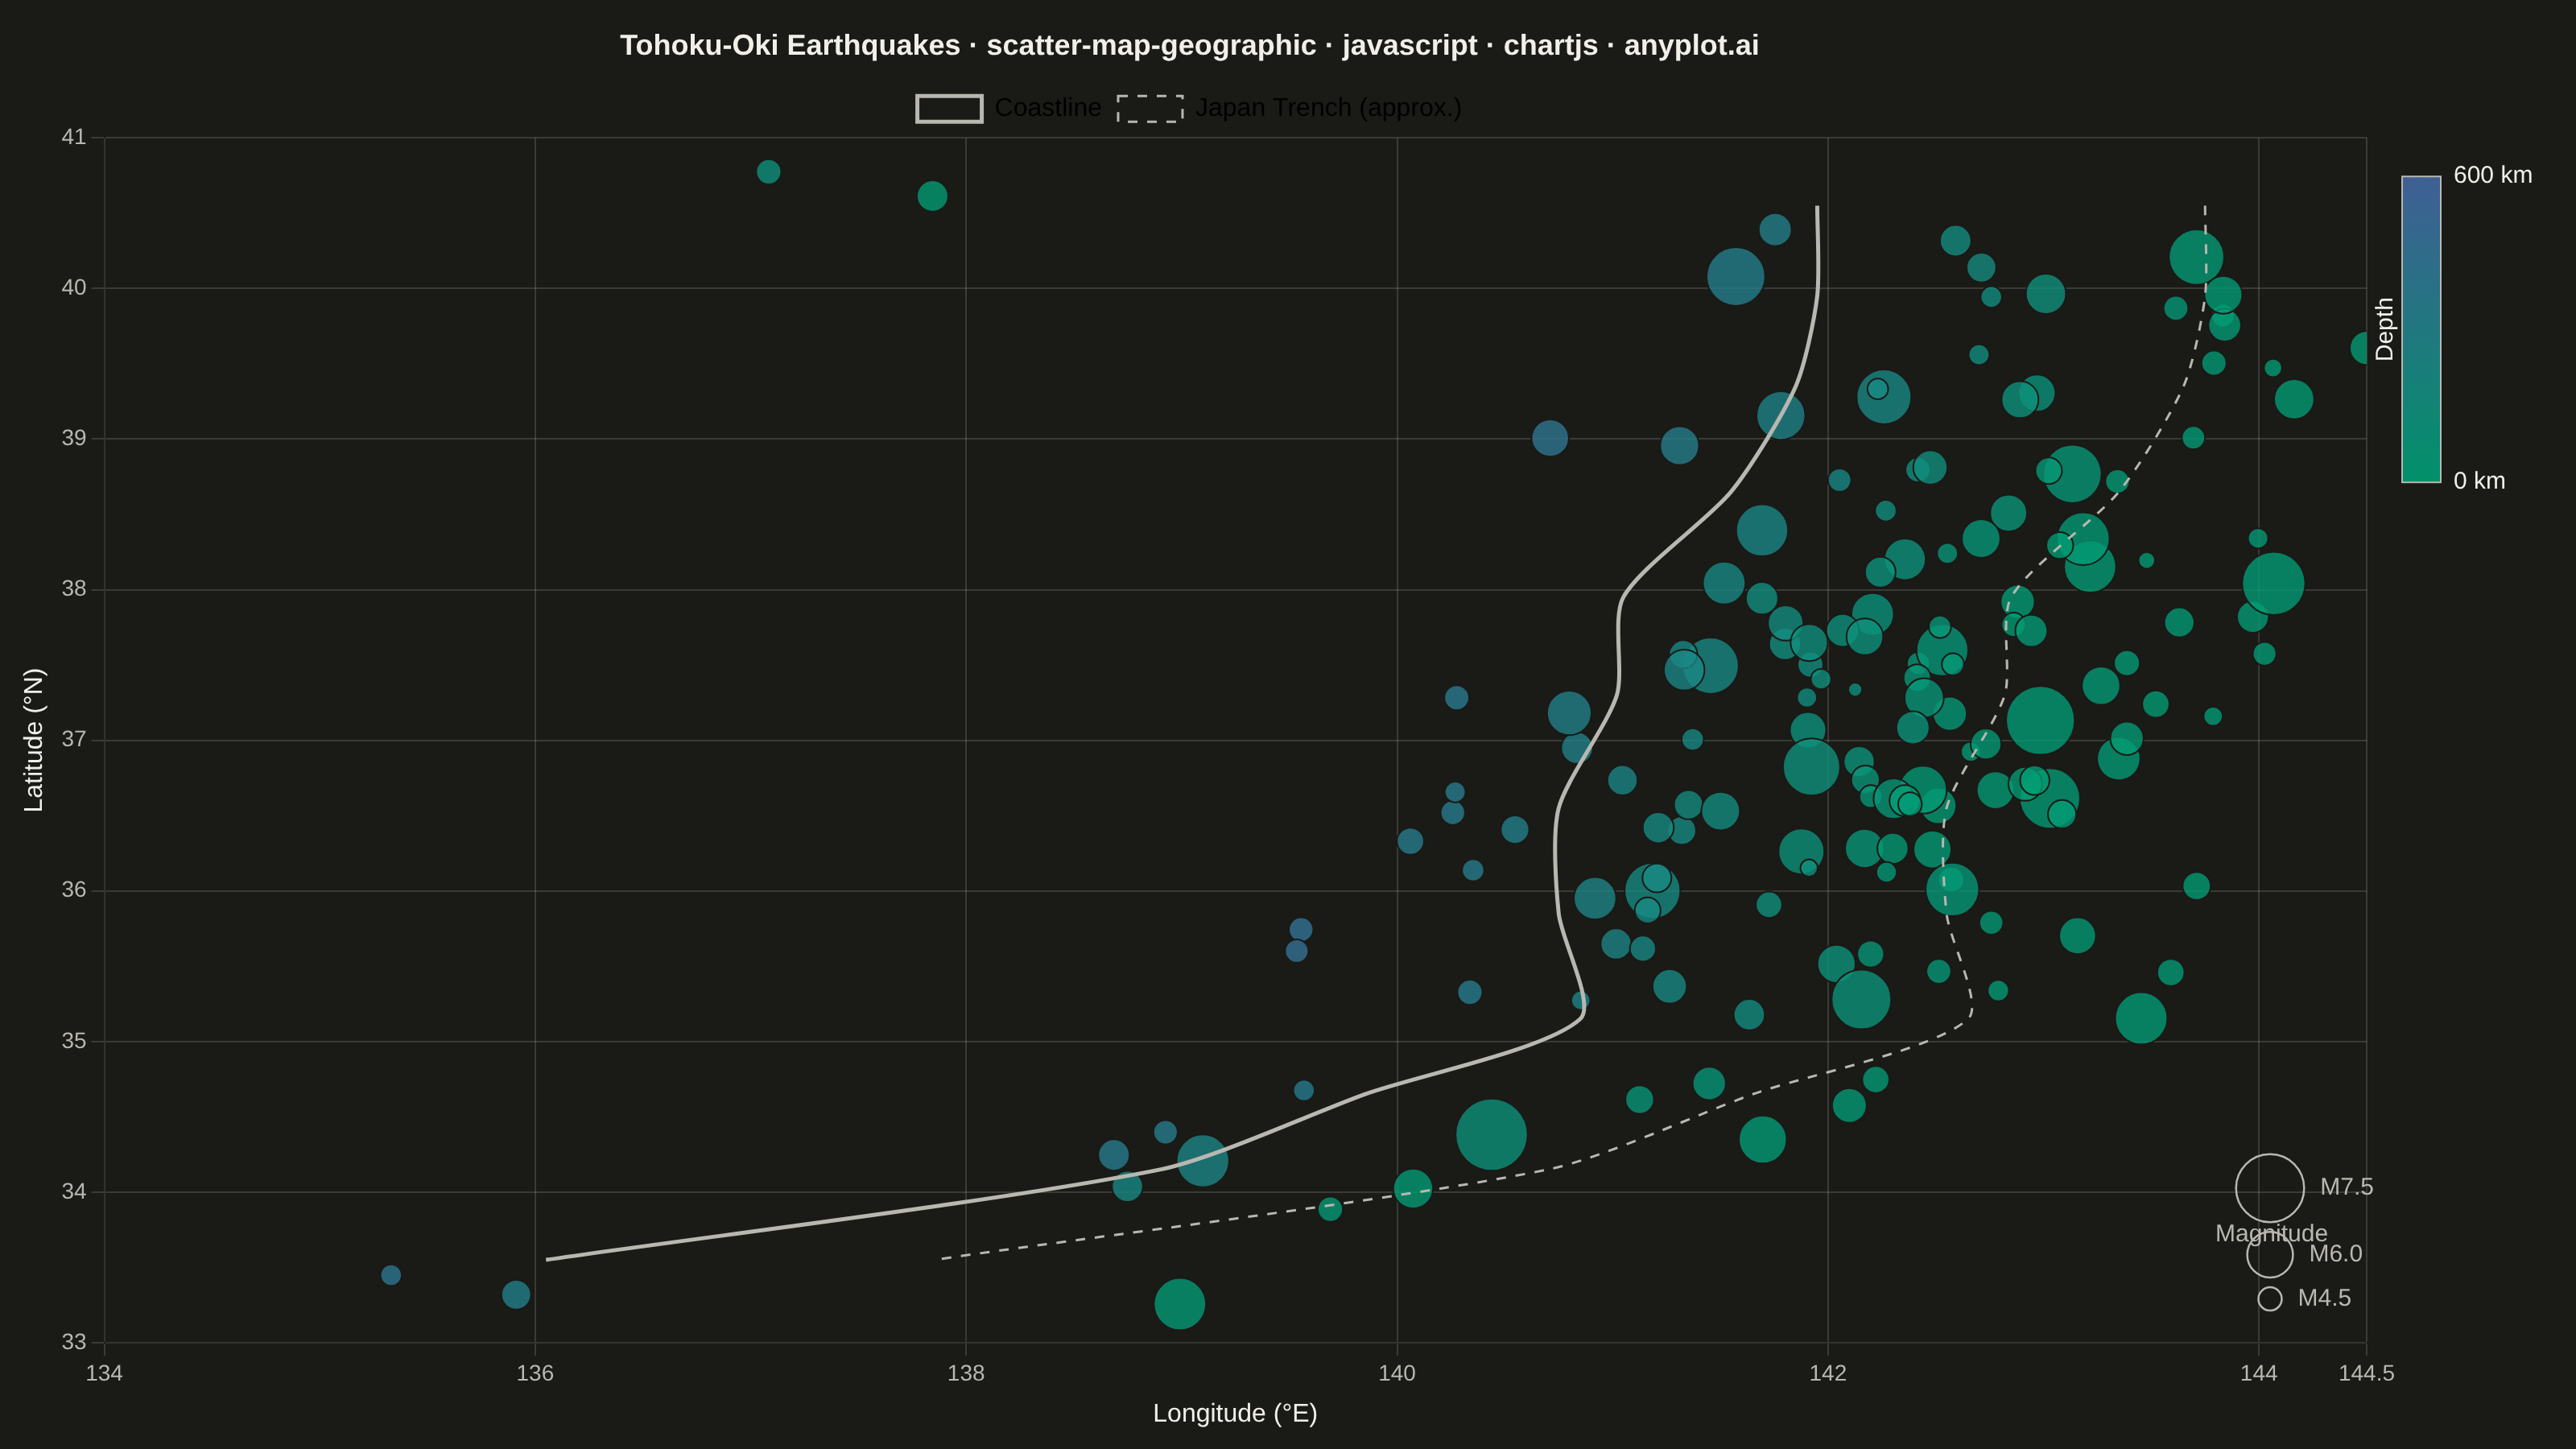
A geographic scatter plot that displays data points on a world or regional map, with each point positioned by its latitude and longitude coordinates. This visualization is ideal for showing spatial distributions of events, locations, or measurements across geographic areas. Points can optionally encode additional variables through size and color, enabling multi-dimensional geographic analysis at a glance.
// anyplot.ai
// scatter-map-geographic: Scatter Map with Geographic Points
// Library: chartjs 4.4.7 | JavaScript 22.23.2
// Quality: 88/100 | Created: 2026-09-02

const t = window.ANYPLOT_TOKENS;

// --- Deterministic PRNG (fixed-seed LCG + Box-Muller) -----------------------
function makeLcg(seed) {
  let state = seed >>> 0;
  return function lcg() {
    state = (Math.imul(state, 1664525) + 1013904223) >>> 0;
    return state / 4294967296;
  };
}
const rand = makeLcg(42);
function gaussian(mean, std) {
  const u1 = Math.max(rand(), 1e-9);
  const u2 = rand();
  const z = Math.sqrt(-2 * Math.log(u1)) * Math.cos(2 * Math.PI * u2);
  return mean + z * std;
}
function clip(v, lo, hi) {
  return Math.min(hi, Math.max(lo, v));
}
// Rejection sampling: redraw out-of-range Gaussian tails instead of clamping,
// so the boundary doesn't accumulate an artificial pile-up of points.
function gaussianInRange(mean, std, lo, hi) {
  for (let tries = 0; tries < 50; tries++) {
    const v = gaussian(mean, std);
    if (v >= lo && v <= hi) return v;
  }
  return clip(gaussian(mean, std), lo, hi);
}

// --- Geography: simplified Pacific coastline of Tohoku/Kanto, Japan --------
// [lat, lon] north -> south, deliberately simplified for map context (not
// navigational). Equirectangular (lat/lon as-is) is an adequate approximation
// of Mercator at this ~8 degree regional latitude band.
const LAT_MIN = 33.0;
const LAT_MAX = 41.0;
const LON_MIN = 134.0;
const LON_MAX = 144.5;

const COASTLINE = [
  [40.55, 141.95],
  [39.95, 141.95],
  [39.35, 141.85],
  [38.65, 141.55],
  [37.95, 141.05],
  [37.3, 141.02],
  [36.55, 140.75],
  [35.85, 140.75],
  [35.15, 140.85],
  [34.65, 139.85],
  [34.15, 138.9],
  [33.55, 136.05],
];
const TRENCH_OFFSET_DEG = 1.8; // Japan Trench sits ~150-200km offshore

function coastLonAtLat(lat) {
  for (let i = 0; i < COASTLINE.length - 1; i++) {
    const [latA, lonA] = COASTLINE[i];
    const [latB, lonB] = COASTLINE[i + 1];
    if (lat <= latA && lat >= latB) {
      const f = (latA - lat) / (latA - latB);
      return lonA + (lonB - lonA) * f;
    }
  }
  return COASTLINE[COASTLINE.length - 1][1];
}
const TRENCH = COASTLINE.map(([lat, lon]) => [lat, lon + TRENCH_OFFSET_DEG]);

// --- Earthquake epicenters: shallow thrust events near the trench, deeper
// Wadati-Benioff events further inland as the Pacific plate subducts westward
const EVENT_COUNT = 160;
const DEPTH_DOMAIN_MAX = 600; // km
const MAG_MIN = 3.8;
const MAG_MAX = 7.9;

const earthquakes = [];
for (let i = 0; i < EVENT_COUNT; i++) {
  const lat = gaussianInRange((LAT_MIN + LAT_MAX) / 2, 2.1, LAT_MIN + 0.2, LAT_MAX - 0.2);
  const trenchLon = coastLonAtLat(lat) + TRENCH_OFFSET_DEG;
  const westOfTrench = gaussianInRange(0.55, 1.05, -1.2, 3.6); // + = inland/deeper, - = outer-rise
  // Geometric safety net (compound of trenchLon lookup + westOfTrench), not a raw
  // Gaussian tail, so a hard clip here does not create a boundary pile-up.
  const lon = clip(trenchLon - westOfTrench, LON_MIN, LON_MAX);
  const depthBase = 15 + Math.max(0, westOfTrench) * 145;
  const depth = gaussianInRange(depthBase, 10, 8, DEPTH_DOMAIN_MAX);
  const isSignificant = rand() < 0.16;
  const magnitude = gaussianInRange(isSignificant ? 6.5 : 4.9, isSignificant ? 0.55 : 0.5, MAG_MIN, MAG_MAX);
  earthquakes.push({ x: lon, y: lat, depth, magnitude });
}

// --- Color: imprint_seq (sequential, single-polarity depth) ----------------
function hexToRgb(hex) {
  const n = parseInt(hex.slice(1), 16);
  return [(n >> 16) & 255, (n >> 8) & 255, n & 255];
}
function seqColor(ratio, alpha) {
  const [r0, g0, b0] = hexToRgb(t.seq[0]);
  const [r1, g1, b1] = hexToRgb(t.seq[1]);
  const r = Math.round(r0 + (r1 - r0) * ratio);
  const g = Math.round(g0 + (g1 - g0) * ratio);
  const b = Math.round(b0 + (b1 - b0) * ratio);
  return `rgba(${r}, ${g}, ${b}, ${alpha})`;
}
function magToRadius(mag) {
  return 4 + ((mag - MAG_MIN) / (MAG_MAX - MAG_MIN)) * 19;
}

const pointColors = earthquakes.map((e) => seqColor(e.depth / DEPTH_DOMAIN_MAX, 0.78));
const pointRadii = earthquakes.map((e) => magToRadius(e.magnitude));

// --- Mount -------------------------------------------------------------------
const canvas = document.createElement("canvas");
document.getElementById("container").appendChild(canvas);

// --- Custom plugin: sequential depth colorbar --------------------------------
// Drawn in the reserved right-side layout.padding band (outside chartArea), so
// it can never overlap a data marker regardless of where events happen to fall.
const COLORBAR_MARGIN = 22;
const depthColorbarPlugin = {
  id: "depthColorbar",
  afterDraw(chart) {
    const { ctx, chartArea } = chart;
    const barW = 24;
    const barH = 190;
    const x = chartArea.right + COLORBAR_MARGIN;
    const y = chartArea.top + 24;

    ctx.save();
    const gradient = ctx.createLinearGradient(0, y, 0, y + barH);
    gradient.addColorStop(0, seqColor(1, 0.9));
    gradient.addColorStop(1, seqColor(0, 0.9));
    ctx.fillStyle = gradient;
    ctx.fillRect(x, y, barW, barH);
    ctx.strokeStyle = t.inkSoft;
    ctx.lineWidth = 1;
    ctx.strokeRect(x, y, barW, barH);

    ctx.fillStyle = t.ink;
    ctx.font = "15px sans-serif";
    ctx.textAlign = "left";
    ctx.textBaseline = "middle";
    ctx.fillText(`${DEPTH_DOMAIN_MAX} km`, x + barW + 8, y);
    ctx.fillText("0 km", x + barW + 8, y + barH);

    ctx.save();
    ctx.translate(x - 10, y + barH / 2);
    ctx.rotate(-Math.PI / 2);
    ctx.textAlign = "center";
    ctx.fillText("Depth", 0, 0);
    ctx.restore();
    ctx.restore();
  },
};

// --- Custom plugin: magnitude size legend ------------------------------------
const magnitudeLegendPlugin = {
  id: "magnitudeLegend",
  afterDraw(chart) {
    const { ctx, chartArea } = chart;
    const refs = [4.5, 6.0, 7.5];
    const x = chartArea.right - 60;
    let y = chartArea.bottom - 20;

    ctx.save();
    ctx.fillStyle = t.inkSoft;
    ctx.font = "15px sans-serif";
    ctx.textAlign = "left";
    ctx.textBaseline = "middle";
    ctx.fillText("Magnitude", x - 34, y - (magToRadius(refs[2]) + 26));
    for (const m of refs) {
      const r = magToRadius(m);
      const cy = y - r;
      ctx.beginPath();
      ctx.arc(x, cy, r, 0, Math.PI * 2);
      ctx.strokeStyle = t.inkSoft;
      ctx.lineWidth = 1.25;
      ctx.stroke();
      ctx.fillText(`M${m.toFixed(1)}`, x + r + 10, cy);
      y = cy - r - 6;
    }
    ctx.restore();
  },
};

// --- Chart -------------------------------------------------------------------
new Chart(canvas, {
  type: "scatter",
  data: {
    datasets: [
      {
        label: "Coastline",
        type: "line",
        data: COASTLINE.map(([lat, lon]) => ({ x: lon, y: lat })),
        showLine: true,
        borderColor: t.inkSoft,
        borderWidth: 2.5,
        pointRadius: 0,
        tension: 0.25,
        order: 1,
      },
      {
        label: "Japan Trench (approx.)",
        type: "line",
        data: TRENCH.map(([lat, lon]) => ({ x: lon, y: lat })),
        showLine: true,
        borderColor: t.inkSoft,
        borderDash: [6, 6],
        borderWidth: 1.5,
        pointRadius: 0,
        tension: 0.25,
        order: 1,
      },
      {
        label: "Epicenters",
        data: earthquakes,
        pointBackgroundColor: pointColors,
        pointBorderColor: t.pageBg,
        pointBorderWidth: 1,
        pointRadius: pointRadii,
        pointHoverRadius: pointRadii.map((r) => r + 3),
        order: 2,
      },
    ],
  },
  options: {
    responsive: true,
    maintainAspectRatio: false,
    animation: false,
    // right padding reserves space for the depthColorbarPlugin so it never
    // overlaps a data marker: COLORBAR_MARGIN + barW + label-text width + margin
    layout: { padding: { top: 8, right: 130, bottom: 8, left: 8 } },
    plugins: {
      title: {
        display: true,
        text: "Tohoku-Oki Earthquakes · scatter-map-geographic · javascript · chartjs · anyplot.ai",
        color: t.ink,
        // 83-char title vs. the 67-char baseline: 22 × 67/83 ≈ 18px (see plot-generator.md "Title fontsize")
        font: { size: 18 },
      },
      legend: {
        labels: {
          color: t.ink,
          font: { size: 16 },
          generateLabels: (chart) => {
            const [coastline, trench] = chart.data.datasets;
            return [
              {
                text: coastline.label,
                strokeStyle: coastline.borderColor,
                lineWidth: coastline.borderWidth,
                fillStyle: "transparent",
                pointStyle: "line",
                datasetIndex: 0,
              },
              {
                text: trench.label,
                strokeStyle: trench.borderColor,
                lineDash: trench.borderDash,
                lineWidth: trench.borderWidth,
                fillStyle: "transparent",
                pointStyle: "line",
                datasetIndex: 1,
              },
            ];
          },
        },
      },
      tooltip: {
        callbacks: {
          title: () => "Epicenter",
          label: (ctx) => {
            const d = ctx.raw;
            if (d.magnitude === undefined) {
              return `${d.y.toFixed(2)}°N, ${d.x.toFixed(2)}°E`;
            }
            return [
              `Magnitude: M${d.magnitude.toFixed(1)}`,
              `Depth: ${Math.round(d.depth)} km`,
              `Location: ${d.y.toFixed(2)}°N, ${d.x.toFixed(2)}°E`,
            ];
          },
        },
      },
    },
    scales: {
      x: {
        min: LON_MIN,
        max: LON_MAX,
        title: { display: true, text: "Longitude (°E)", color: t.ink, font: { size: 16 } },
        ticks: { color: t.inkSoft, font: { size: 14 } },
        grid: { color: t.grid },
      },
      y: {
        min: LAT_MIN,
        max: LAT_MAX,
        title: { display: true, text: "Latitude (°N)", color: t.ink, font: { size: 16 } },
        ticks: { color: t.inkSoft, font: { size: 14 } },
        grid: { color: t.grid },
      },
    },
  },
  plugins: [depthColorbarPlugin, magnitudeLegendPlugin],
});
Runnable source as JSON, for any HTTP client: https://api.anyplot.ai/specs/scatter-map-geographic/chartjs/code. Any spec id and library id listed in llms-full.txt fit the same URL shape; every URL below is complete and callable.
{
  "spec_id": "scatter-map-geographic",
  "language": "javascript",
  "library": "chartjs",
  "page": "https://anyplot.ai/scatter-map-geographic/javascript/chartjs",
  "hub": "https://anyplot.ai/scatter-map-geographic",
  "code_json": "https://api.anyplot.ai/specs/scatter-map-geographic/chartjs/code",
  "spec_json": "https://api.anyplot.ai/specs/scatter-map-geographic",
  "render_light_png": "https://storage.googleapis.com/anyplot-images/plots/scatter-map-geographic/javascript/chartjs/plot-light.png",
  "render_dark_png": "https://storage.googleapis.com/anyplot-images/plots/scatter-map-geographic/javascript/chartjs/plot-dark.png",
  "interactive_light_html": "https://storage.googleapis.com/anyplot-images/plots/scatter-map-geographic/javascript/chartjs/plot-light.html",
  "interactive_dark_html": "https://storage.googleapis.com/anyplot-images/plots/scatter-map-geographic/javascript/chartjs/plot-dark.html",
  "quality_score": 88.0,
  "license": "MIT",
  "guide": "https://anyplot.ai/llms.txt"
}
Part of Scatter Map with Geographic Points on anyplot.ai.