The same plot in 14 other libraries — Python: Altair, Bokeh, lets-plot, Matplotlib, Plotly, plotnine, Seaborn; R: ggplot2; Julia: Makie.jl; JavaScript: Chart.js, D3.js, Apache ECharts, Highcharts, MUI X Charts. Compare all 15 side by side: SHAP Summary Plot in Python, R, Julia and JavaScript.
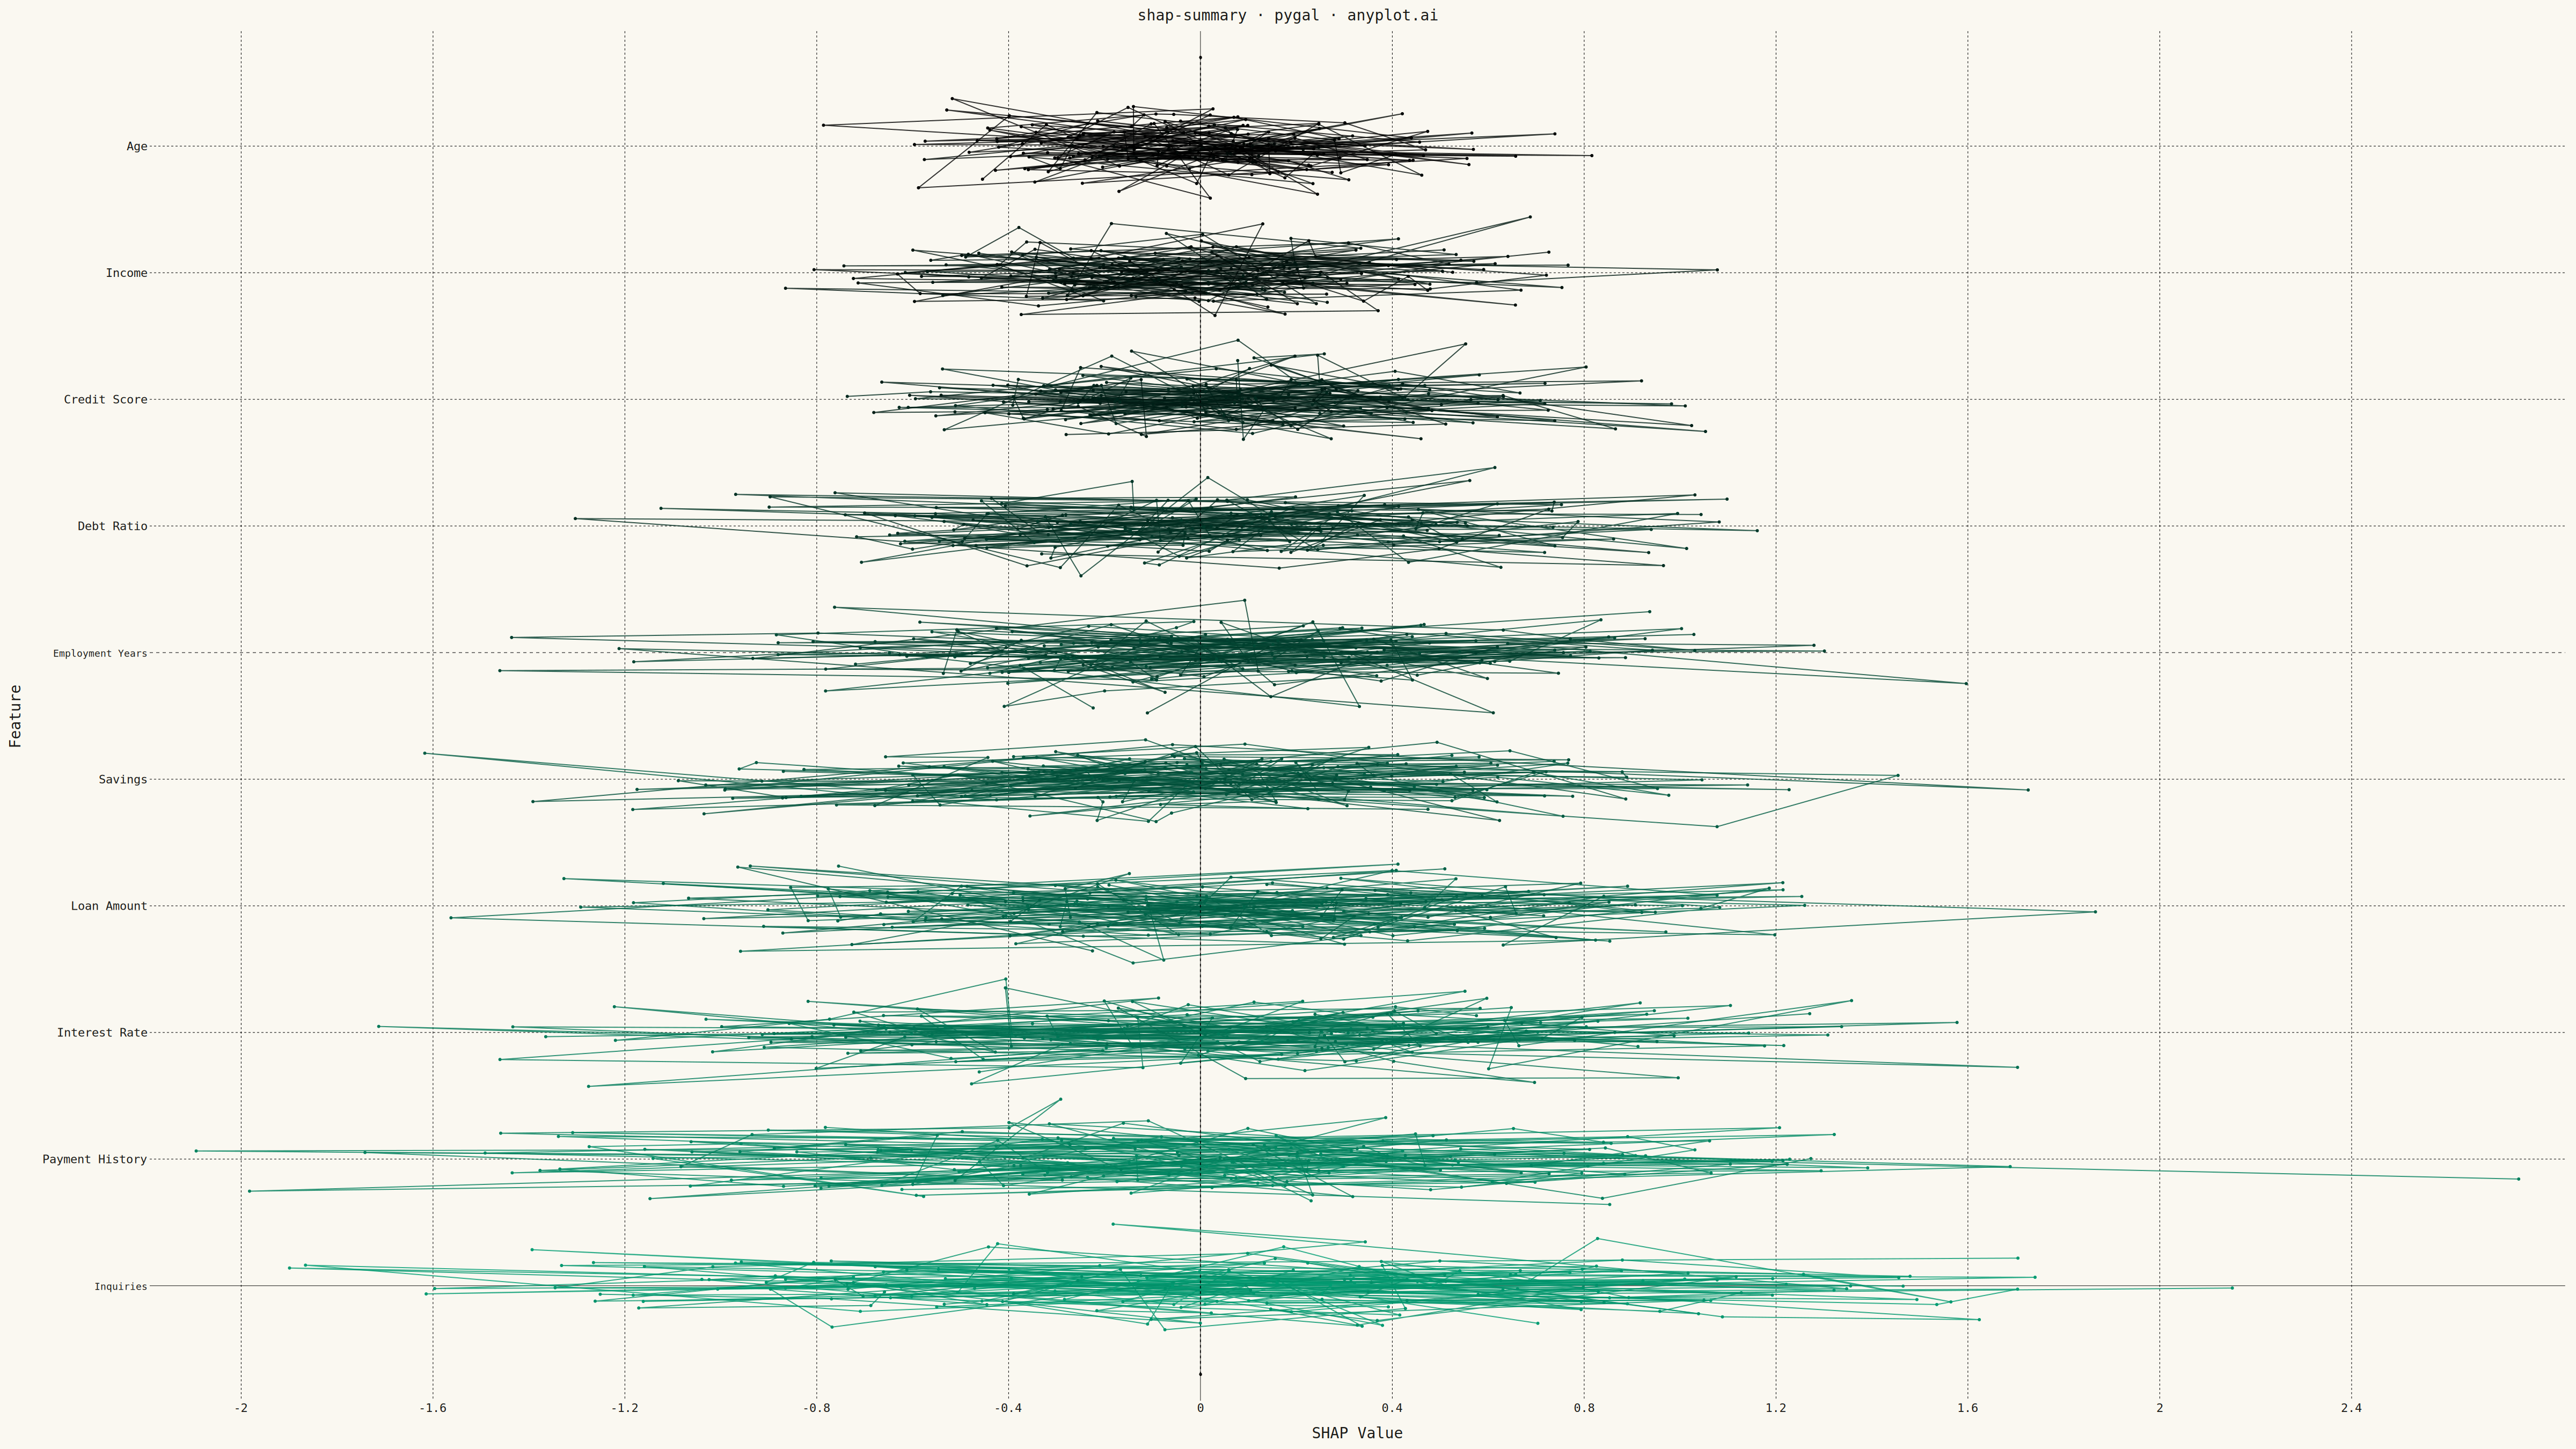
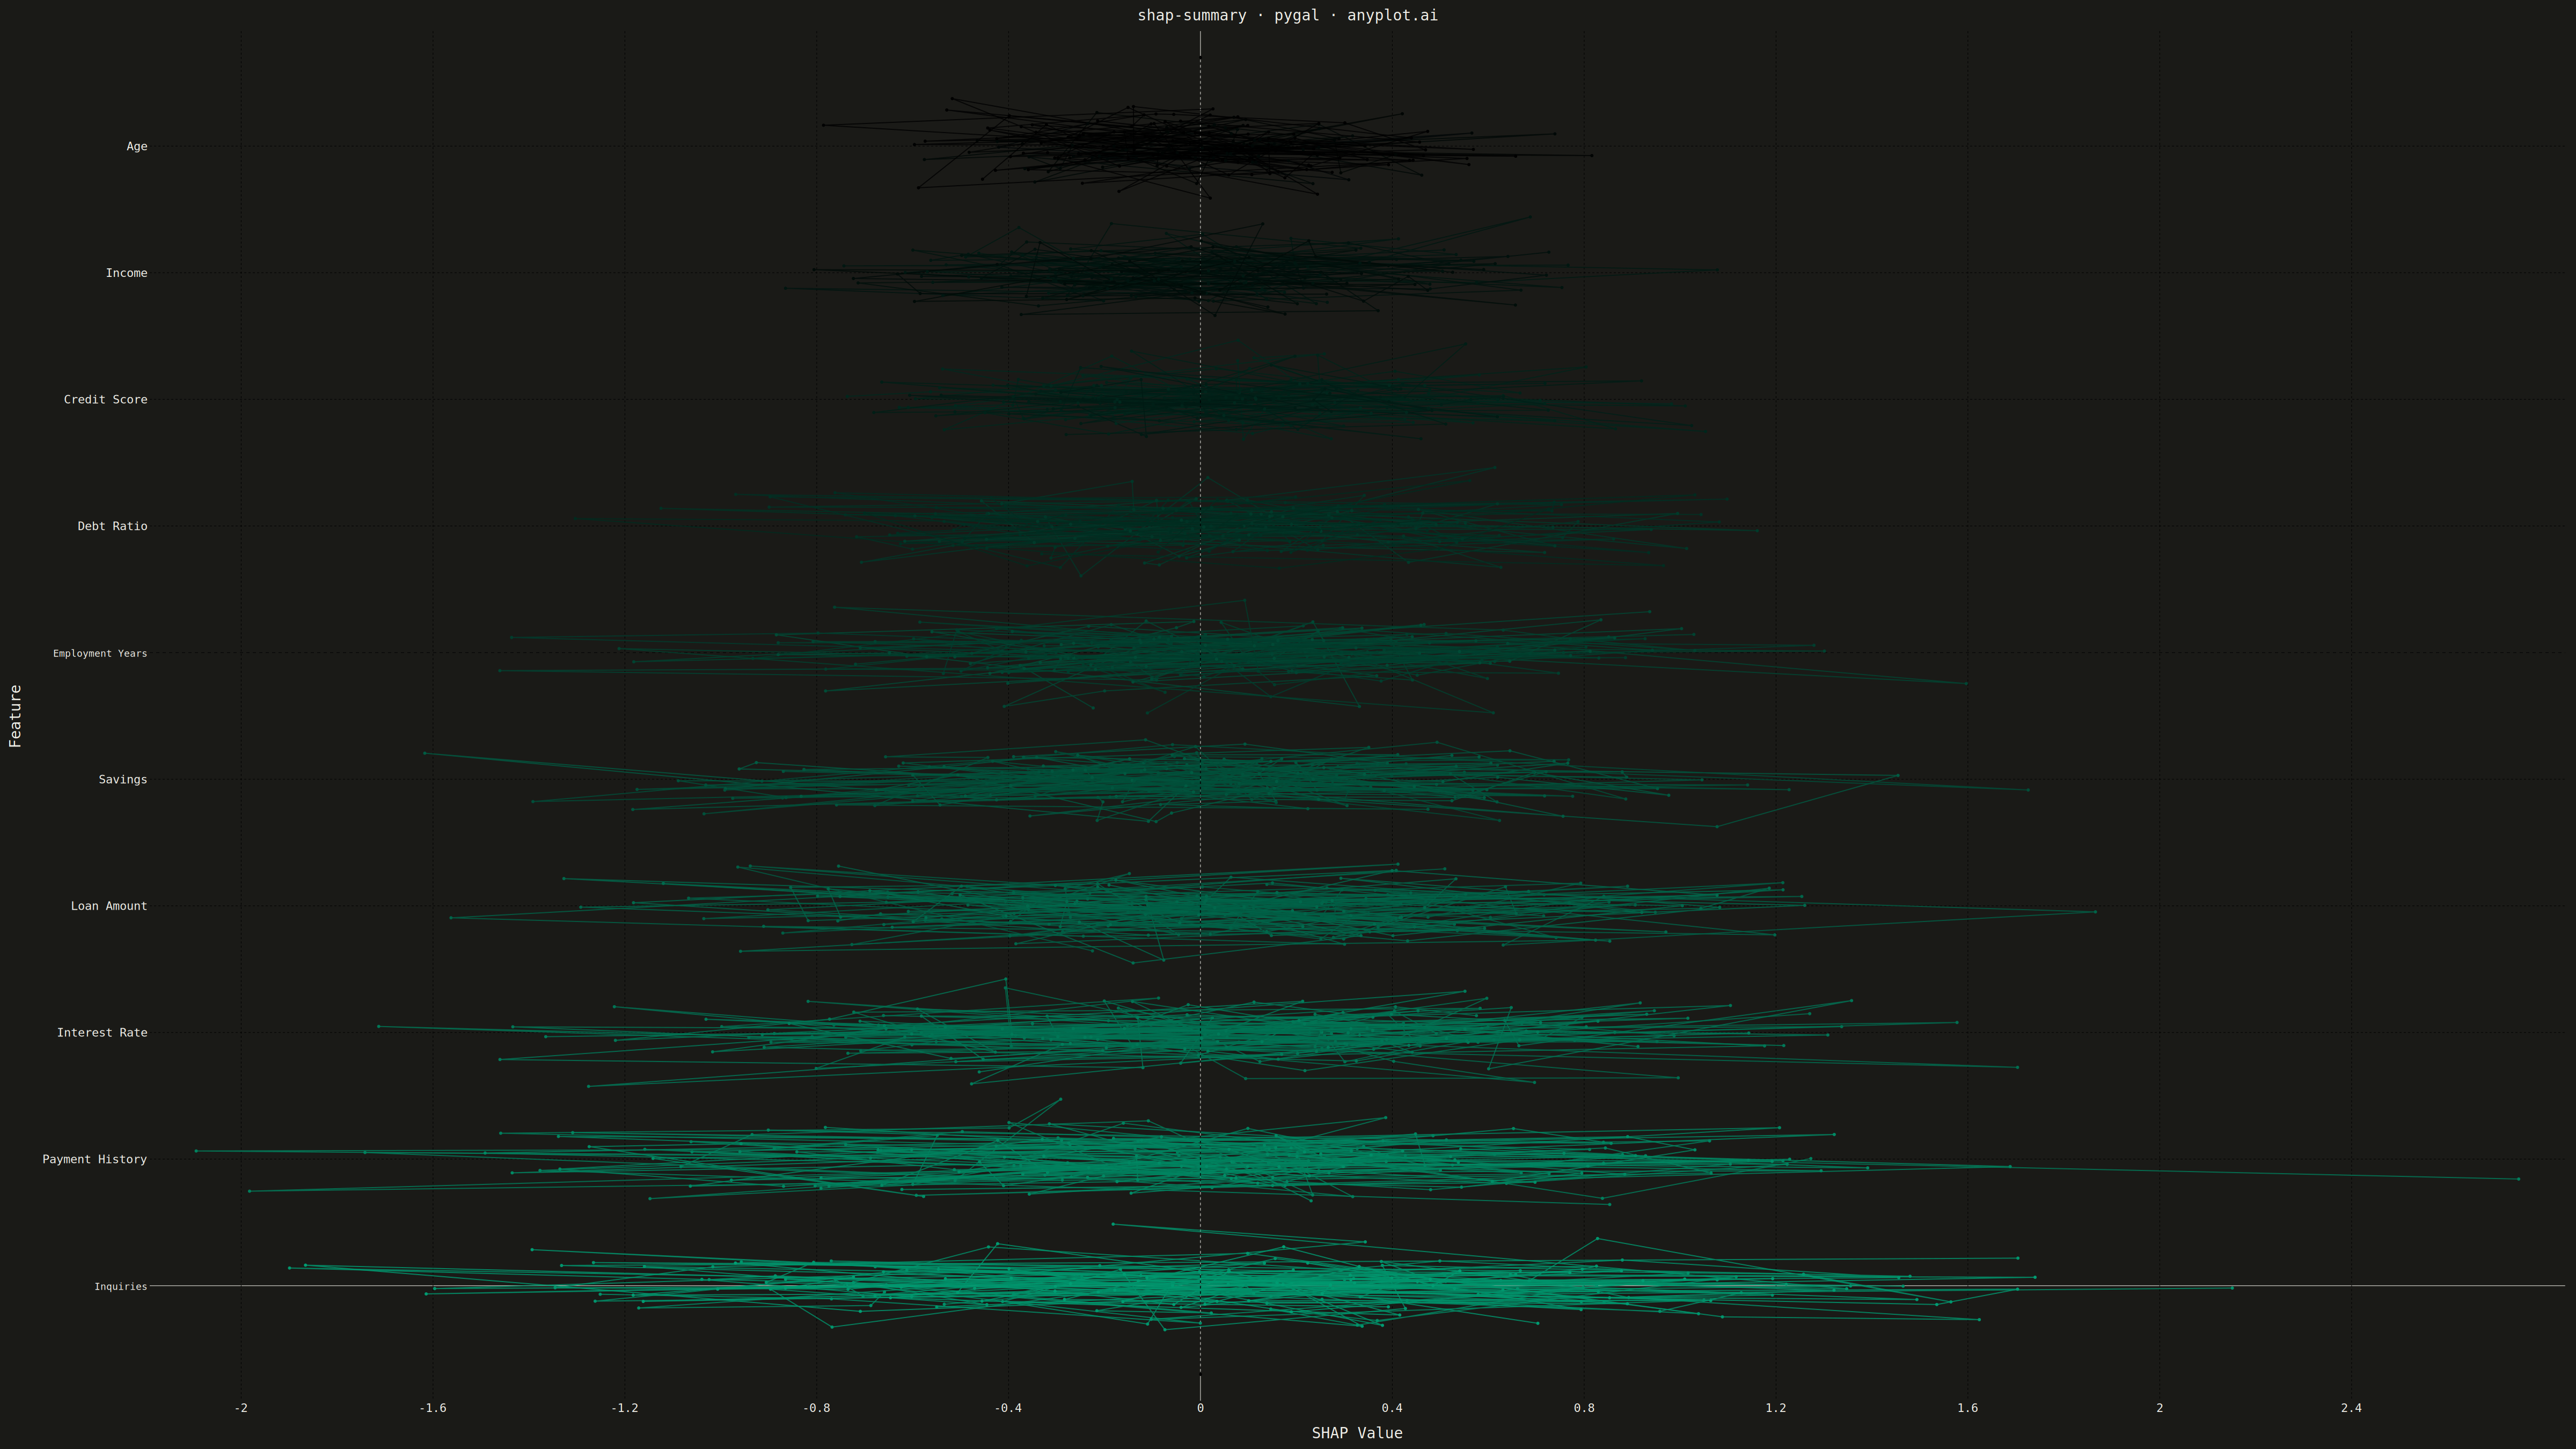
A SHAP (SHapley Additive exPlanations) summary plot displaying the distribution of SHAP values for each feature, ordered by mean absolute SHAP value (importance). Each dot represents a sample, positioned horizontally by its SHAP value and colored by the feature's value (typically low=blue to high=red). This visualization is essential for machine learning interpretability, showing both feature importance and the direction and magnitude of feature effects on model predictions.
""" anyplot.ai
shap-summary: SHAP Summary Plot
Library: pygal 3.1.0 | Python 3.13.13
Quality: 81/100 | Created: 2026-05-14
"""

import os
import re
import sys


sys.path = [p for p in sys.path if not p.endswith("implementations/python")]

import matplotlib as mpl
import numpy as np
import pygal
from matplotlib.colors import Normalize
from pygal.style import Style


script_dir = os.path.dirname(os.path.abspath(__file__))
os.chdir(script_dir)

THEME = os.getenv("ANYPLOT_THEME", "light")
PAGE_BG = "#FAF8F1" if THEME == "light" else "#1A1A17"
INK = "#1A1A17" if THEME == "light" else "#F0EFE8"
INK_SOFT = "#4A4A44" if THEME == "light" else "#B8B7B0"
INK_MUTED = "#6B6A63" if THEME == "light" else "#A8A79F"
RULE = "rgba(26,26,23,0.10)" if THEME == "light" else "rgba(240,239,232,0.10)"

np.random.seed(42)
n_samples = 200
n_features = 10

feature_names = [
    "Age",
    "Income",
    "Credit Score",
    "Debt Ratio",
    "Employment Years",
    "Savings",
    "Loan Amount",
    "Interest Rate",
    "Payment History",
    "Inquiries",
]

shap_values = np.zeros((n_samples, n_features))
feature_values = np.zeros((n_samples, n_features))

for i in range(n_features):
    shap_values[:, i] = np.random.normal(0, 0.3 + i * 0.05, n_samples)
    feature_values[:, i] = np.random.uniform(0, 1, n_samples)

importance = np.abs(shap_values).mean(axis=0)
sorted_idx = np.argsort(-importance)

shap_values = shap_values[:, sorted_idx]
feature_values = feature_values[:, sorted_idx]
feature_names = [feature_names[i] for i in sorted_idx]

custom_style = Style(
    background=PAGE_BG,
    plot_background=PAGE_BG,
    foreground=INK,
    foreground_strong=INK,
    foreground_subtle=INK_MUTED,
    colors=("#009E73",),
    title_font_size=28,
    label_font_size=22,
    major_label_font_size=18,
    legend_font_size=16,
    stroke_width=2,
)

chart = pygal.XY(
    style=custom_style,
    title="shap-summary · pygal · anyplot.ai",
    x_title="SHAP Value",
    y_title="Feature",
    width=4800,
    height=2700,
    show_legend=False,
    y_labels=feature_names,
    show_x_guides=True,
)

cmap = mpl.colormaps.get_cmap("BrBG")
norm = Normalize(vmin=0, vmax=1)

for j in range(n_features):
    n_bands = 10
    for band in range(n_bands):
        band_color_value = (band + 0.5) / n_bands
        color_rgba = cmap(norm(band_color_value))
        hex_color = "#{:02x}{:02x}{:02x}".format(
            int(color_rgba[0] * 255), int(color_rgba[1] * 255), int(color_rgba[2] * 255)
        )

        points = []
        for i in range(n_samples):
            feature_val = feature_values[i, j]
            if band / n_bands <= feature_val < (band + 1) / n_bands:
                jitter = np.random.normal(0, 0.15)
                points.append((shap_values[i, j], j + jitter))

        if points:
            chart.add(f"{feature_names[j]}_band_{band}", points, show_legend=False, color=hex_color)

# Add reference line at x=0 (neutral SHAP value)
x_min, x_max = shap_values.min(), shap_values.max()
margin = (x_max - x_min) * 0.05
chart.add(
    "Zero Reference",
    [(0, -0.7), (0, n_features - 0.3)],
    show_legend=False,
    stroke_style={"width": 2, "dasharray": "5,5"},
    color=INK_SOFT,
)

# Render to SVG string and save HTML
svg_content = chart.render()

# Post-process SVG for dark theme to fix text colors
if THEME == "dark":
    svg_str = svg_content.decode("utf-8") if isinstance(svg_content, bytes) else svg_content

    # Replace/add fill attributes in all text elements with light color
    # First, replace any existing fill="#..." in text elements
    svg_str = re.sub(r'(<text\s+[^>]*?)fill="[^"]*"', rf'\1fill="{INK}"', svg_str)

    # For text elements without fill attribute, add one
    def add_fill_to_text(match):
        text_tag = match.group(0)
        if "fill=" not in text_tag:
            return text_tag[:-1] + f' fill="{INK}">'
        return text_tag

    svg_str = re.sub(r"<text[^>]*>", add_fill_to_text, svg_str)
    svg_content = svg_str.encode("utf-8")

# Save HTML
with open(f"plot-{THEME}.html", "wb") as f:
    f.write(svg_content)

# Render to PNG (using pygal's native renderer)
chart.render_to_png(f"plot-{THEME}.png")
Runnable source as JSON, for any HTTP client: https://api.anyplot.ai/specs/shap-summary/pygal/code. Any spec id and library id listed in llms-full.txt fit the same URL shape; every URL below is complete and callable.
{
  "spec_id": "shap-summary",
  "language": "python",
  "library": "pygal",
  "page": "https://anyplot.ai/shap-summary/python/pygal",
  "hub": "https://anyplot.ai/shap-summary",
  "code_json": "https://api.anyplot.ai/specs/shap-summary/pygal/code",
  "spec_json": "https://api.anyplot.ai/specs/shap-summary",
  "render_light_png": "https://storage.googleapis.com/anyplot-images/plots/shap-summary/python/pygal/plot-light.png",
  "render_dark_png": "https://storage.googleapis.com/anyplot-images/plots/shap-summary/python/pygal/plot-dark.png",
  "interactive_light_html": "https://storage.googleapis.com/anyplot-images/plots/shap-summary/python/pygal/plot-light.html",
  "interactive_dark_html": "https://storage.googleapis.com/anyplot-images/plots/shap-summary/python/pygal/plot-dark.html",
  "quality_score": 81.0,
  "license": "MIT",
  "guide": "https://anyplot.ai/llms.txt"
}
Part of SHAP Summary Plot on anyplot.ai.