The same plot in 14 other libraries — JavaScript: D3.js, Apache ECharts, Highcharts, MUI X Charts; Python: Altair, Bokeh, lets-plot, Matplotlib, Plotly, plotnine, Pygal, Seaborn; R: ggplot2; Julia: Makie.jl. Compare all 15 side by side: Voronoi Diagram for Spatial Partitioning in Python, R, Julia and JavaScript.
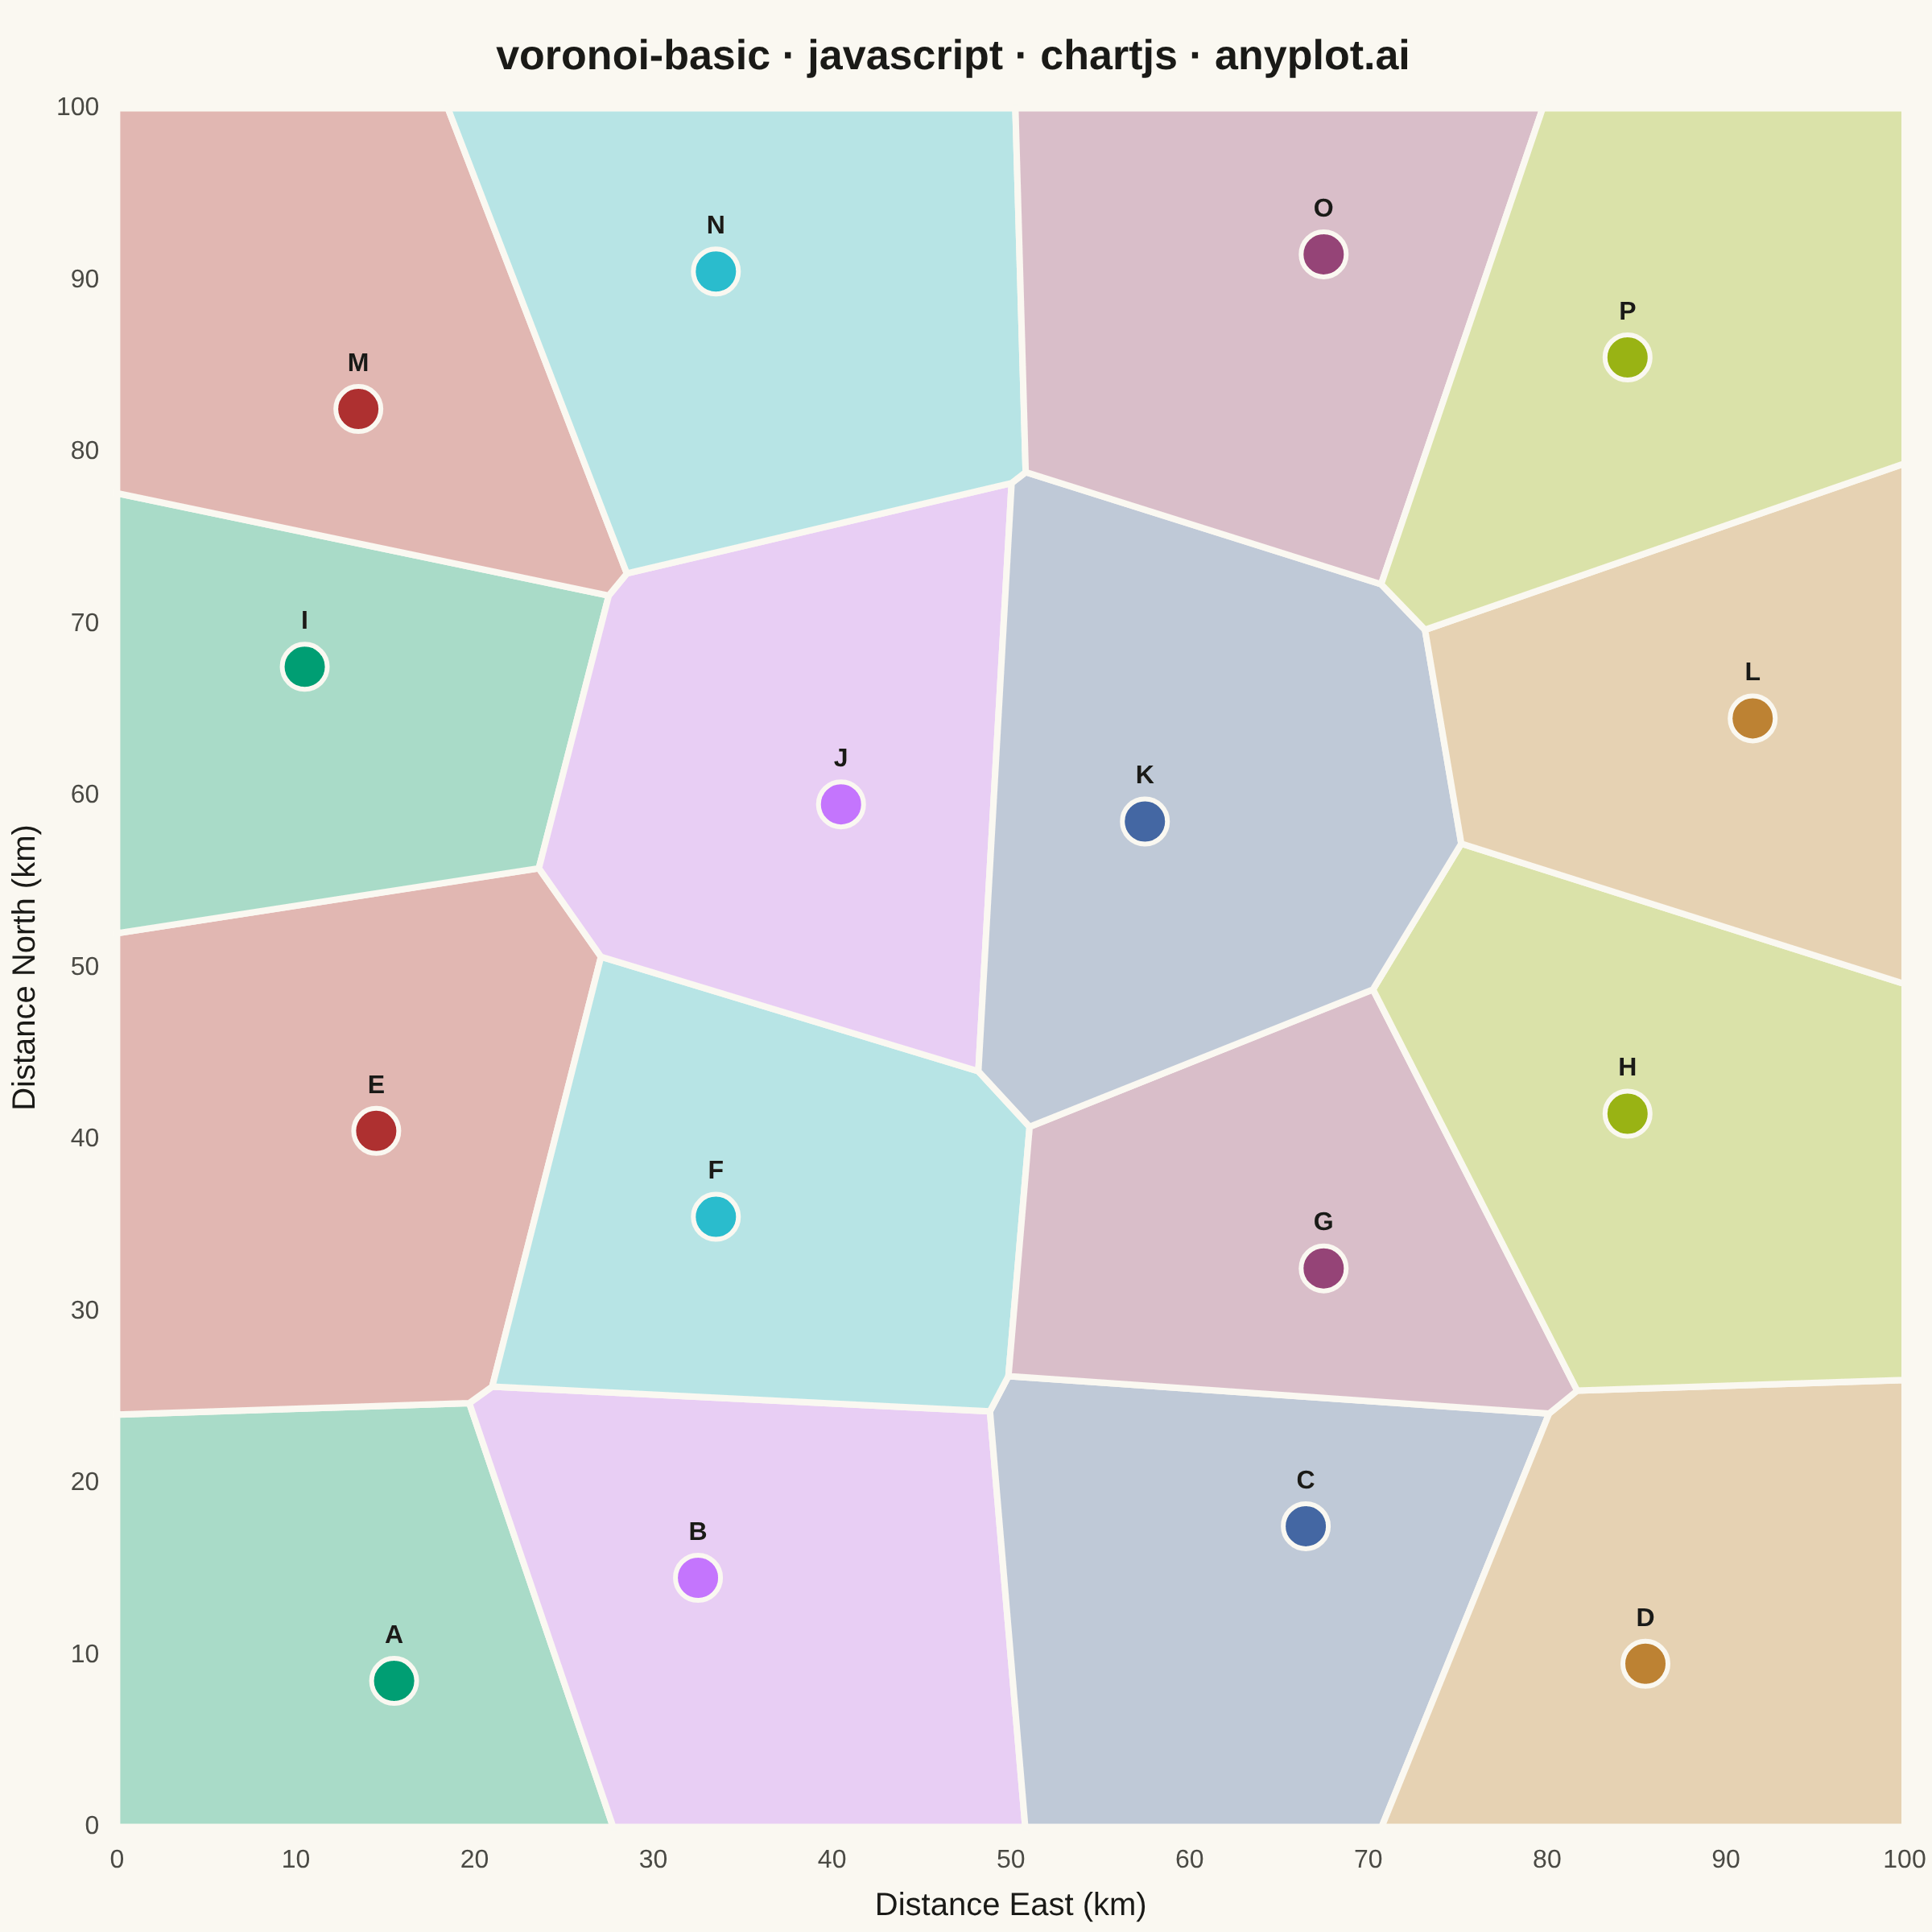
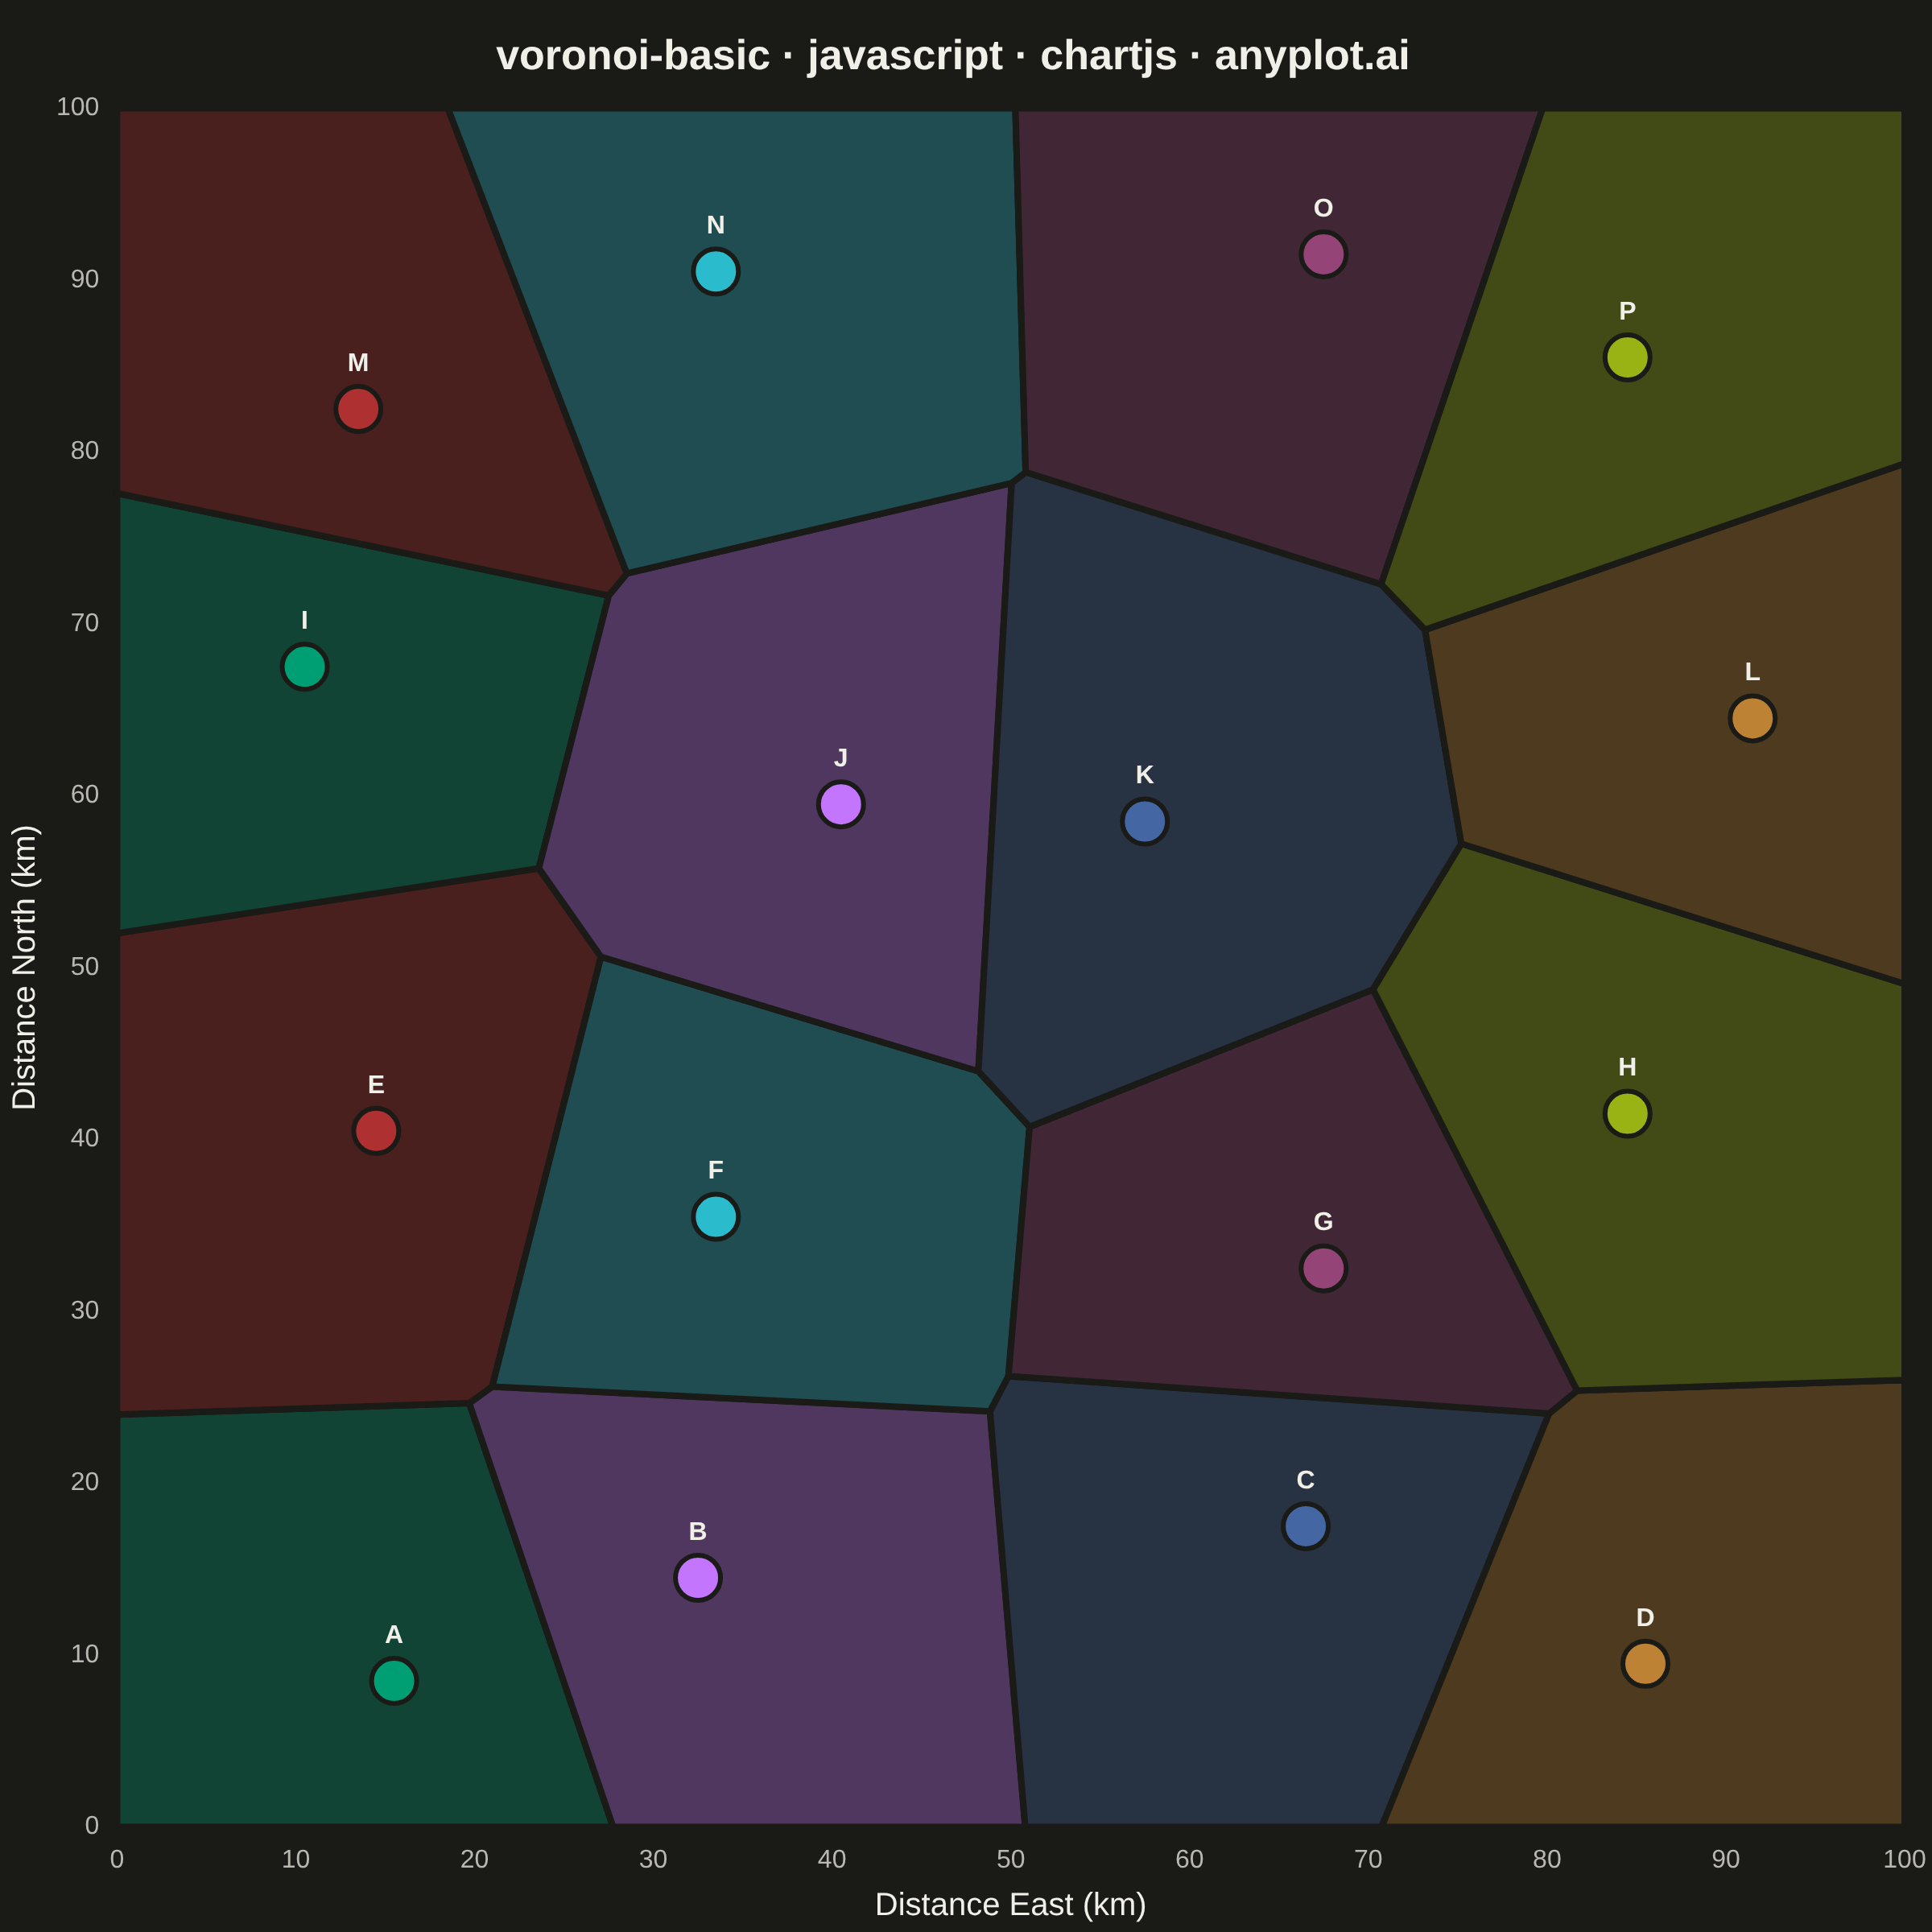
A Voronoi diagram partitions a plane into regions based on the distance to a set of seed points, where each region contains all points closer to its seed than to any other. This visualization is essential for understanding spatial relationships, proximity analysis, and territorial boundaries. It reveals natural clustering patterns and helps identify areas of influence around data points.
// anyplot.ai
// voronoi-basic: Voronoi Diagram for Spatial Partitioning
// Library: chartjs 4.4.7 | JavaScript 22.23.2
// Quality: 93/100 | Created: 2026-09-02

//# anyplot-orientation: square

const t = window.ANYPLOT_TOKENS;

function hexToRgba(hex, alpha) {
  const r = parseInt(hex.slice(1, 3), 16);
  const g = parseInt(hex.slice(3, 5), 16);
  const b = parseInt(hex.slice(5, 7), 16);
  return `rgba(${r}, ${g}, ${b}, ${alpha})`;
}

// --- Data: retail store locations across a 100 km x 100 km metro region ---
// A jittered 4x4 grid keeps the tessellation readable while still looking
// organic — real store networks rarely sit on an exact lattice.
const STORE_LABELS = ["A", "B", "C", "D", "E", "F", "G", "H", "I", "J", "K", "L", "M", "N", "O", "P"];
const stores = [
  { x: 15.5, y: 8.5 },
  { x: 32.5, y: 14.5 },
  { x: 66.5, y: 17.5 },
  { x: 85.5, y: 9.5 },
  { x: 14.5, y: 40.5 },
  { x: 33.5, y: 35.5 },
  { x: 67.5, y: 32.5 },
  { x: 84.5, y: 41.5 },
  { x: 10.5, y: 67.5 },
  { x: 40.5, y: 59.5 },
  { x: 57.5, y: 58.5 },
  { x: 91.5, y: 64.5 },
  { x: 13.5, y: 82.5 },
  { x: 33.5, y: 90.5 },
  { x: 67.5, y: 91.5 },
  { x: 84.5, y: 85.5 },
].map((p, i) => ({ ...p, label: STORE_LABELS[i], color: t.palette[i % t.palette.length] }));

// --- Mount -------------------------------------------------------------
const canvas = document.createElement("canvas");
document.getElementById("container").appendChild(canvas);

// Clip a convex polygon (in canvas pixel space) to the half-plane closer to
// `site` than `other` — Sutherland-Hodgman clipping against the perpendicular
// bisector of the two sites. Intersecting a bounding box with one bisector
// per neighbor produces the exact Voronoi cell, clipped to the visible frame.
function clipToBisector(poly, site, other) {
  const midX = (site.x + other.x) / 2;
  const midY = (site.y + other.y) / 2;
  const dx = other.x - site.x;
  const dy = other.y - site.y;
  const side = (p) => (p.x - midX) * dx + (p.y - midY) * dy;

  const out = [];
  for (let i = 0; i < poly.length; i++) {
    const curr = poly[i];
    const next = poly[(i + 1) % poly.length];
    const currSide = side(curr);
    const nextSide = side(next);
    if (currSide < 0) out.push(curr);
    if (currSide < 0 !== nextSide < 0) {
      const tRatio = currSide / (currSide - nextSide);
      out.push({ x: curr.x + tRatio * (next.x - curr.x), y: curr.y + tRatio * (next.y - curr.y) });
    }
  }
  return out;
}

// Inline plugin: computes the Voronoi tessellation directly in screen-pixel
// space (so cell shapes read correctly regardless of the x/y scale ratio),
// fills each cell behind the points, then labels the seeds on top.
const voronoiCells = {
  id: "voronoiCells",
  beforeDatasetsDraw(chart) {
    const { ctx, chartArea, scales } = chart;
    const sites = stores.map((s) => ({
      x: scales.x.getPixelForValue(s.x),
      y: scales.y.getPixelForValue(s.y),
      color: s.color,
    }));

    ctx.save();
    sites.forEach((site, i) => {
      let cell = [
        { x: chartArea.left, y: chartArea.top },
        { x: chartArea.right, y: chartArea.top },
        { x: chartArea.right, y: chartArea.bottom },
        { x: chartArea.left, y: chartArea.bottom },
      ];
      sites.forEach((other, j) => {
        if (i !== j) cell = clipToBisector(cell, site, other);
      });
      if (cell.length < 3) return;

      ctx.beginPath();
      cell.forEach((p, idx) => (idx === 0 ? ctx.moveTo(p.x, p.y) : ctx.lineTo(p.x, p.y)));
      ctx.closePath();
      ctx.fillStyle = hexToRgba(site.color, 0.32);
      ctx.fill();
      ctx.strokeStyle = t.pageBg;
      ctx.lineWidth = 4;
      ctx.stroke();
    });
    ctx.restore();
  },
  afterDatasetsDraw(chart) {
    const { ctx, scales } = chart;
    ctx.save();
    ctx.font = "600 16px sans-serif";
    ctx.fillStyle = t.ink;
    ctx.textAlign = "center";
    ctx.textBaseline = "bottom";
    stores.forEach((s) => {
      const px = scales.x.getPixelForValue(s.x);
      const py = scales.y.getPixelForValue(s.y);
      ctx.fillText(s.label, px, py - 20);
    });
    ctx.restore();
  },
};

// --- Chart -----------------------------------------------------------------
const title = "voronoi-basic · javascript · chartjs · anyplot.ai";
const titleFontSize = Math.round(26 * (title.length > 67 ? 67 / title.length : 1));

new Chart(canvas, {
  type: "scatter",
  plugins: [voronoiCells],
  data: {
    datasets: [
      {
        label: "Store locations",
        data: stores.map((s) => ({ x: s.x, y: s.y })),
        pointBackgroundColor: stores.map((s) => s.color),
        pointBorderColor: t.pageBg,
        pointBorderWidth: 3,
        pointRadius: 14,
        pointHoverRadius: 14,
      },
    ],
  },
  options: {
    responsive: true,
    maintainAspectRatio: false,
    animation: false,
    layout: { padding: { top: 8, right: 16 } },
    plugins: {
      title: {
        display: true,
        text: title,
        color: t.ink,
        font: { size: titleFontSize },
        padding: { top: 12, bottom: 16 },
      },
      legend: { display: false },
    },
    scales: {
      x: {
        min: 0,
        max: 100,
        ticks: { color: t.inkSoft, font: { size: 16 } },
        grid: { display: false },
        title: { display: true, text: "Distance East (km)", color: t.ink, font: { size: 20 } },
      },
      y: {
        min: 0,
        max: 100,
        ticks: { color: t.inkSoft, font: { size: 16 } },
        grid: { display: false },
        title: { display: true, text: "Distance North (km)", color: t.ink, font: { size: 20 } },
      },
    },
  },
});
Runnable source as JSON, for any HTTP client: https://api.anyplot.ai/specs/voronoi-basic/chartjs/code. Any spec id and library id listed in llms-full.txt fit the same URL shape; every URL below is complete and callable.
{
  "spec_id": "voronoi-basic",
  "language": "javascript",
  "library": "chartjs",
  "page": "https://anyplot.ai/voronoi-basic/javascript/chartjs",
  "hub": "https://anyplot.ai/voronoi-basic",
  "code_json": "https://api.anyplot.ai/specs/voronoi-basic/chartjs/code",
  "spec_json": "https://api.anyplot.ai/specs/voronoi-basic",
  "render_light_png": "https://storage.googleapis.com/anyplot-images/plots/voronoi-basic/javascript/chartjs/plot-light.png",
  "render_dark_png": "https://storage.googleapis.com/anyplot-images/plots/voronoi-basic/javascript/chartjs/plot-dark.png",
  "interactive_light_html": "https://storage.googleapis.com/anyplot-images/plots/voronoi-basic/javascript/chartjs/plot-light.html",
  "interactive_dark_html": "https://storage.googleapis.com/anyplot-images/plots/voronoi-basic/javascript/chartjs/plot-dark.html",
  "quality_score": 93.0,
  "license": "MIT",
  "guide": "https://anyplot.ai/llms.txt"
}
Part of Voronoi Diagram for Spatial Partitioning on anyplot.ai.