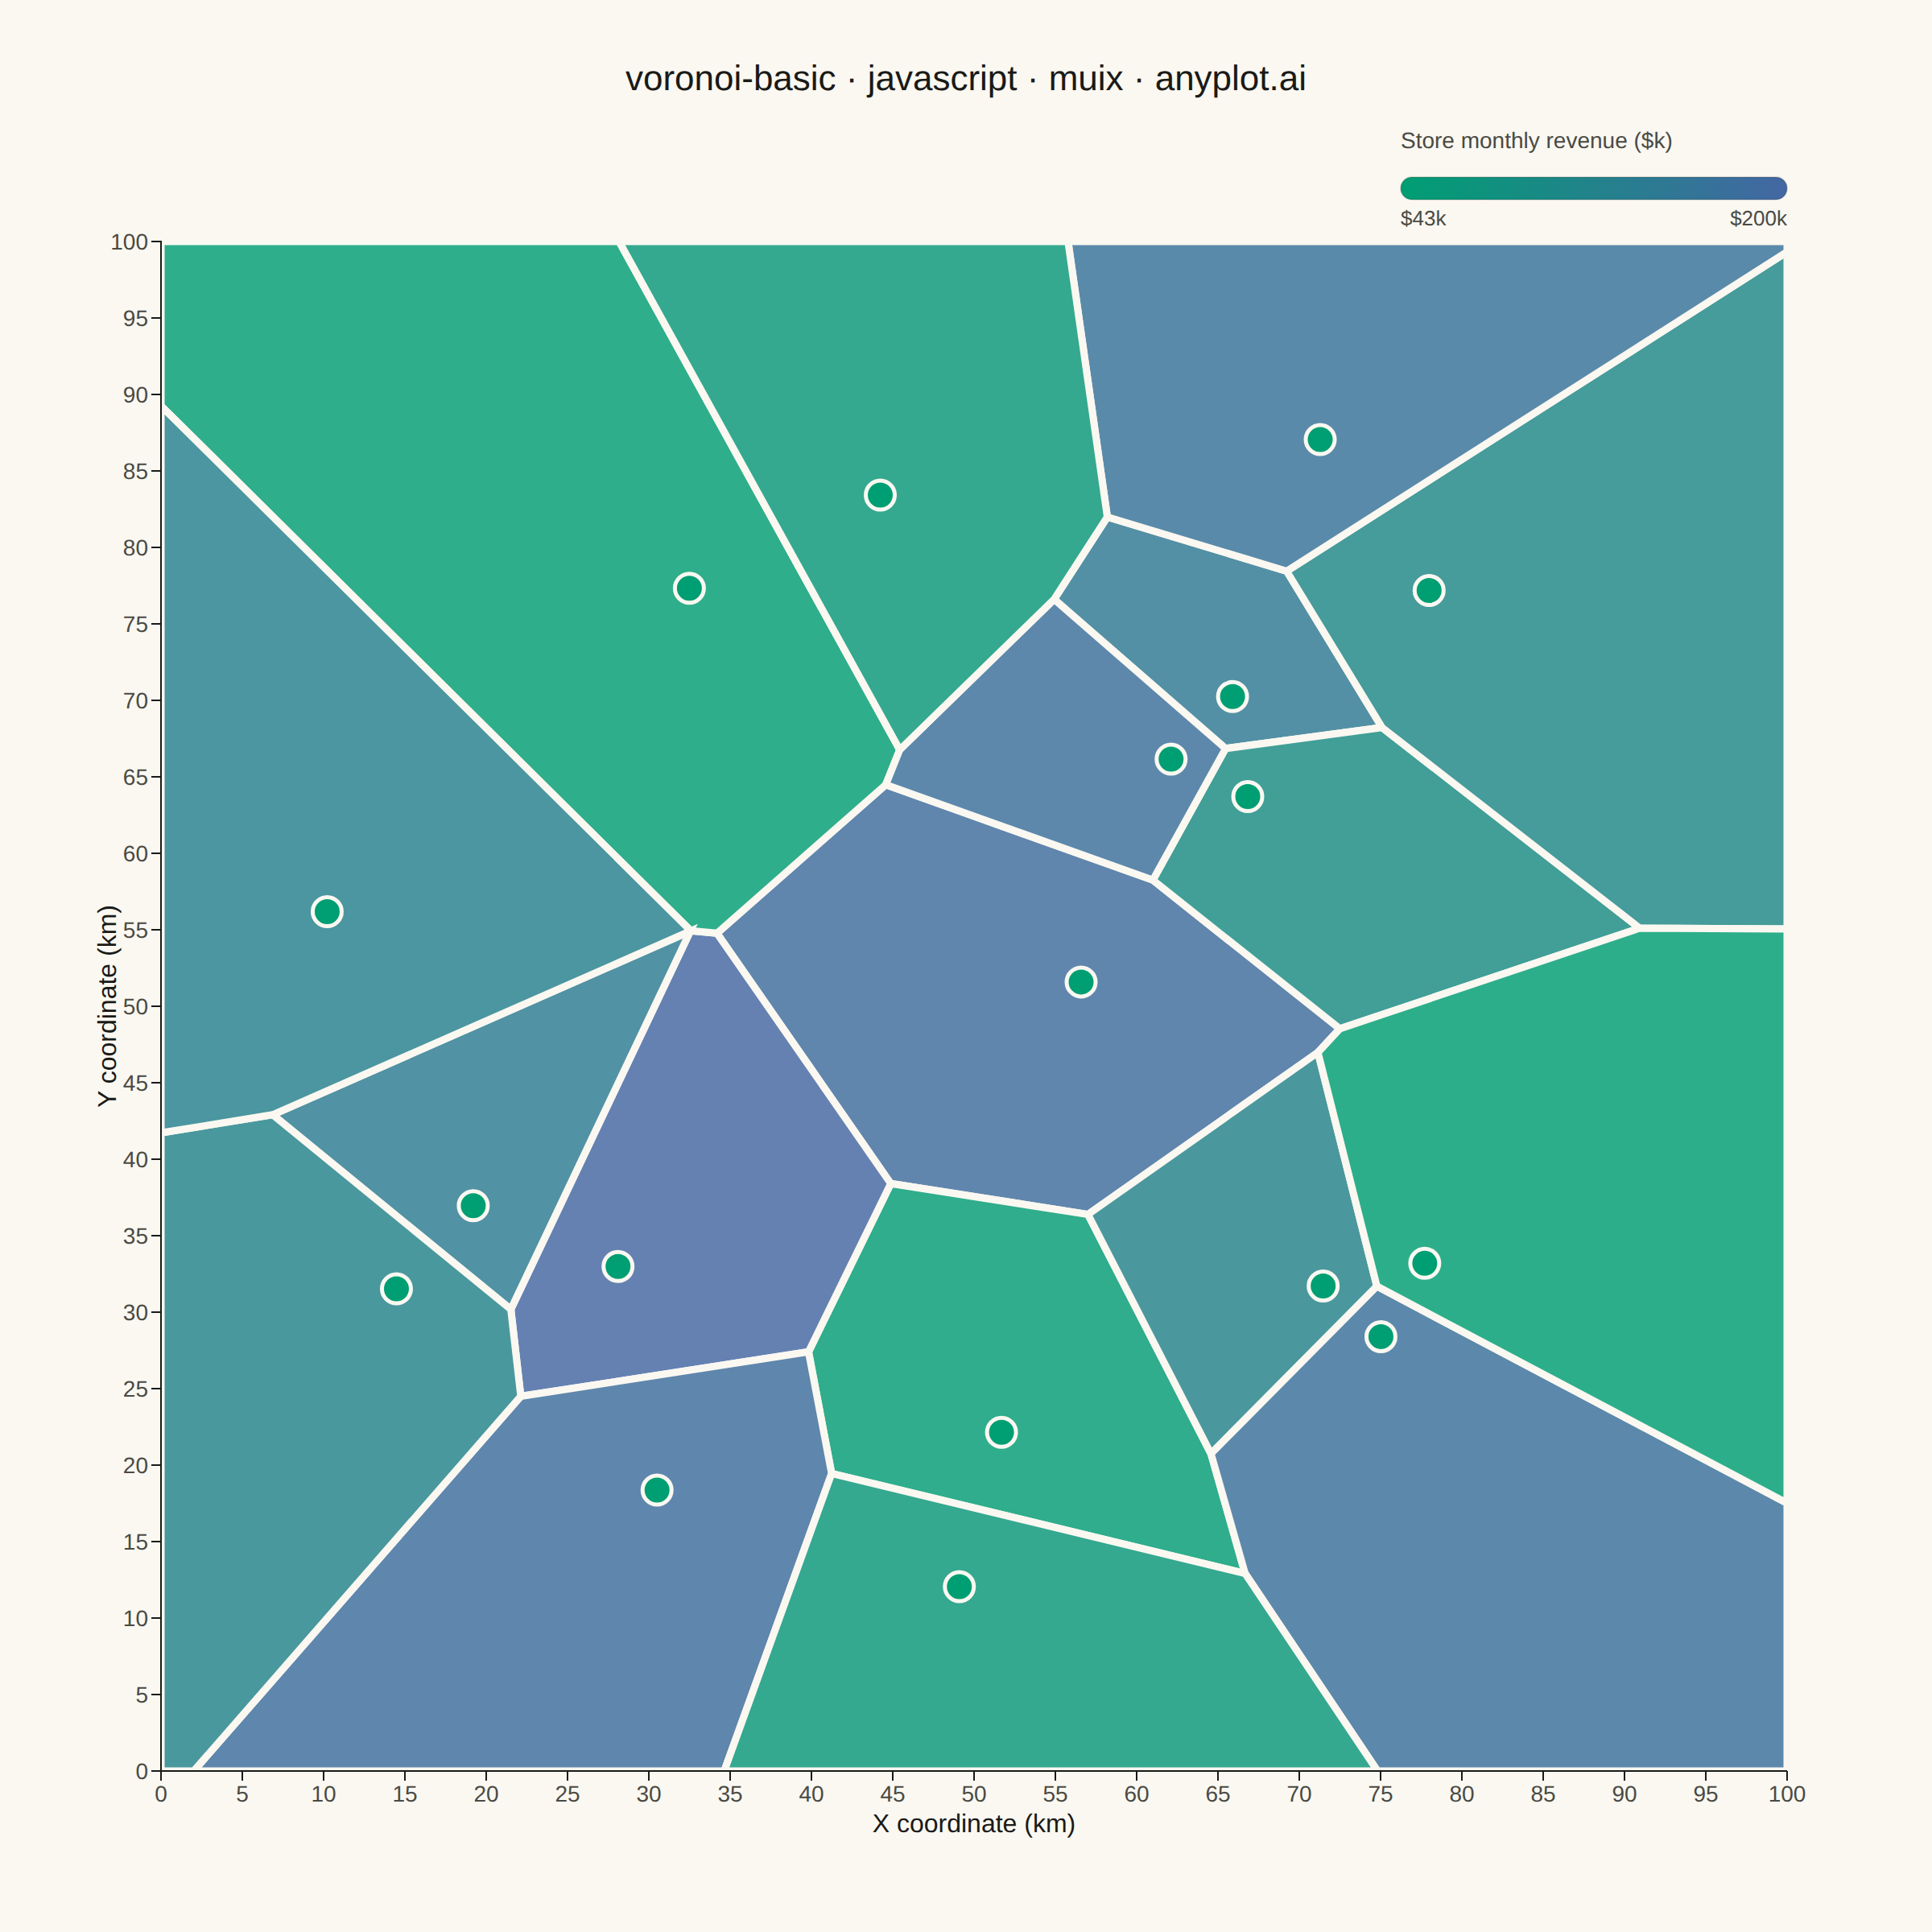
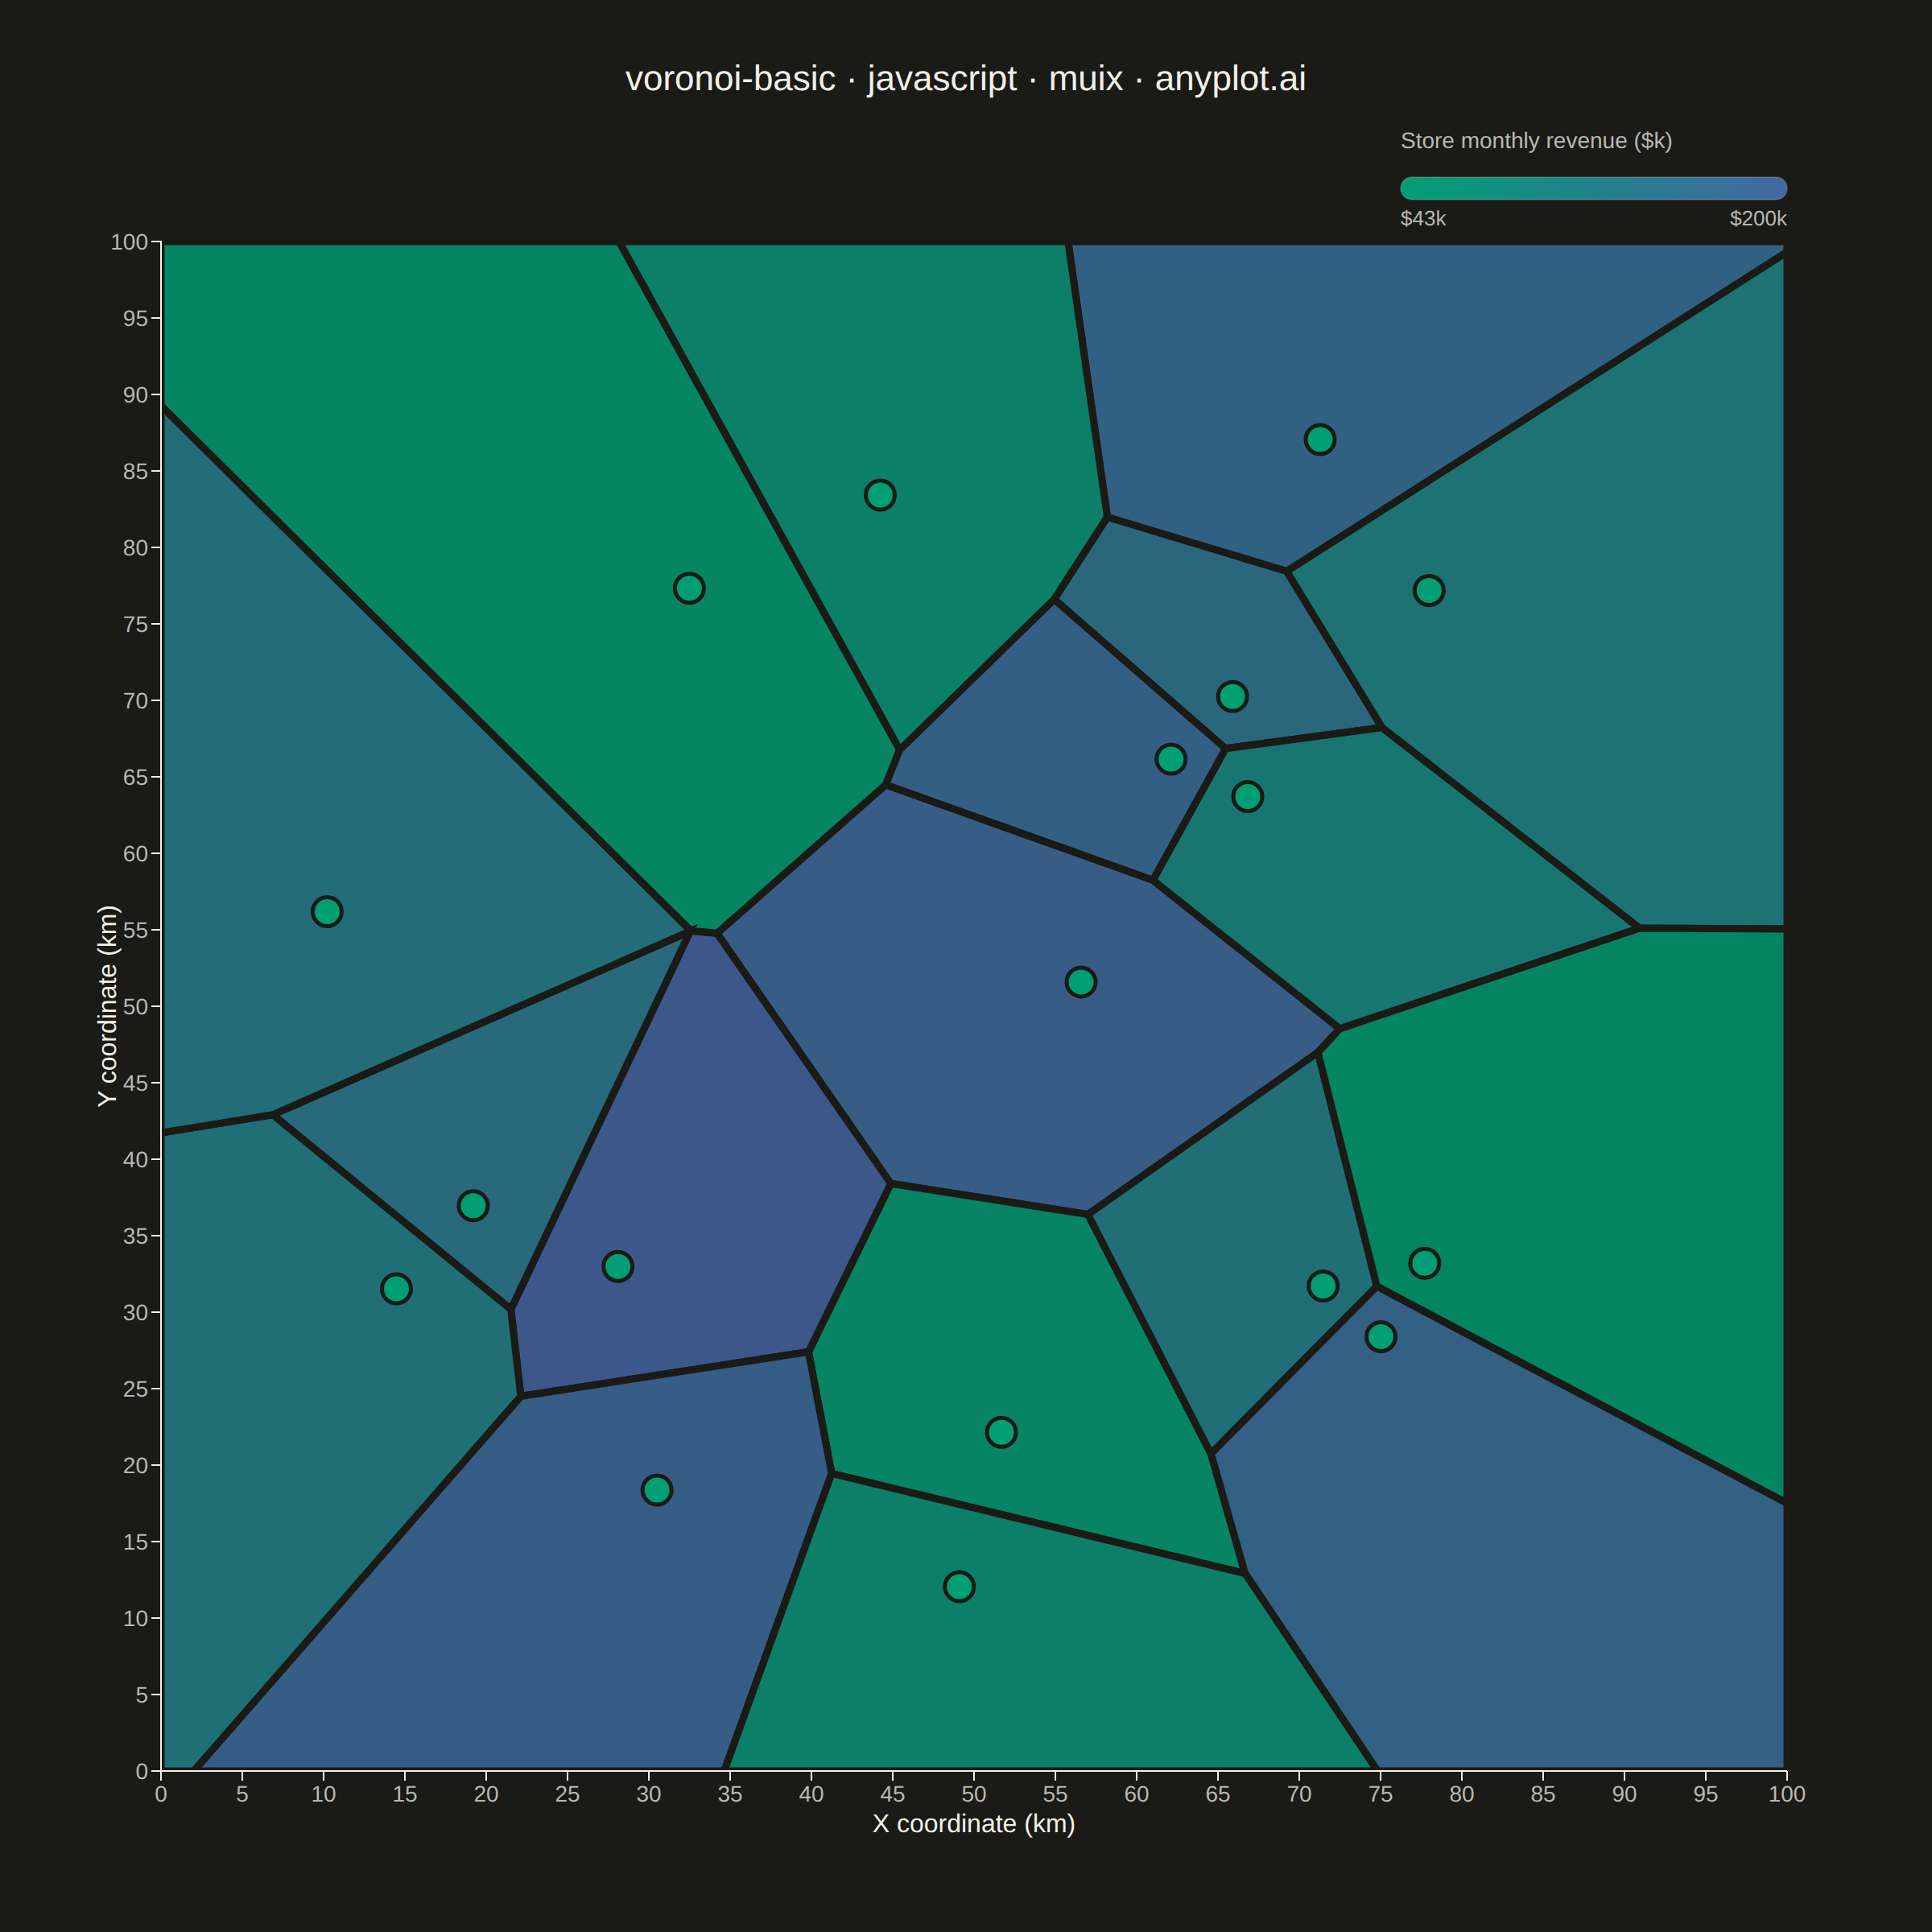
The same plot in 14 other libraries — JavaScript: Chart.js, D3.js, Apache ECharts, Highcharts; Python: Altair, Bokeh, lets-plot, Matplotlib, Plotly, plotnine, Pygal, Seaborn; R: ggplot2; Julia: Makie.jl. Compare all 15 side by side: Voronoi Diagram for Spatial Partitioning in Python, R, Julia and JavaScript.
A Voronoi diagram partitions a plane into regions based on the distance to a set of seed points, where each region contains all points closer to its seed than to any other. This visualization is essential for understanding spatial relationships, proximity analysis, and territorial boundaries. It reveals natural clustering patterns and helps identify areas of influence around data points.
// anyplot.ai
// voronoi-basic: Voronoi Diagram for Spatial Partitioning
// Library: muix 7.29.1 | JavaScript 22.23.2
// Quality: 87/100 | Created: 2026-09-02
//# anyplot-orientation: square
// anyplot.ai
// voronoi-basic: Voronoi Diagram for Spatial Partitioning
// Library: MUI X Charts | React | Node 22
// License: @mui/x-charts — MIT (community). Pro/Premium are out of scope.
// Quality: pending | Created: 2026-09-02
import { ChartContainer } from "@mui/x-charts/ChartContainer";
import { ChartsXAxis } from "@mui/x-charts/ChartsXAxis";
import { ChartsYAxis } from "@mui/x-charts/ChartsYAxis";
import { useXScale, useYScale, useDrawingArea } from "@mui/x-charts/hooks";

const t = window.ANYPLOT_TOKENS;
const TITLE = "voronoi-basic · javascript · muix · anyplot.ai";

// --- Data: retail store locations across a city grid (in-memory, deterministic) ---
// Small fixed-seed LCG — the browser has no seeded RNG.
let seed = 42;
function nextRandom() {
  seed = (seed * 1103515245 + 12345) % 2147483648;
  return seed / 2147483648;
}

const STORE_COUNT = 18;
const DOMAIN_MIN = 0;
const DOMAIN_MAX = 100;
const MARGIN_DATA = 10; // keep sites off the very edge so every cell stays visible

const stores = Array.from({ length: STORE_COUNT }, (_, i) => ({
  id: `S${i + 1}`,
  x: DOMAIN_MIN + MARGIN_DATA + nextRandom() * (DOMAIN_MAX - DOMAIN_MIN - 2 * MARGIN_DATA),
  y: DOMAIN_MIN + MARGIN_DATA + nextRandom() * (DOMAIN_MAX - DOMAIN_MIN - 2 * MARGIN_DATA),
  monthlyRevenueK: Math.round(40 + nextRandom() * 160), // $k / month
}));

const revenues = stores.map((s) => s.monthlyRevenueK);
const minRevenue = Math.min(...revenues);
const maxRevenue = Math.max(...revenues);

function hexToRgb(hex) {
  const clean = hex.replace("#", "");
  return {
    r: parseInt(clean.substring(0, 2), 16),
    g: parseInt(clean.substring(2, 4), 16),
    b: parseInt(clean.substring(4, 6), 16),
  };
}

function revenueColor(value) {
  const ratio = (value - minRevenue) / (maxRevenue - minRevenue || 1);
  const a = hexToRgb(t.seq[0]);
  const b = hexToRgb(t.seq[1]);
  const r = Math.round(a.r + (b.r - a.r) * ratio);
  const g = Math.round(a.g + (b.g - a.g) * ratio);
  const bl = Math.round(a.b + (b.b - a.b) * ratio);
  return `rgb(${r}, ${g}, ${bl})`;
}

// --- Voronoi geometry: half-plane intersection via Sutherland-Hodgman clip --
// Each cell starts as the bounding box, then gets clipped by the perpendicular
// bisector half-plane against every other seed (the region strictly closer to
// this site than to that one). No external geometry library — this is plain
// polygon math, not a charting engine.
const BBOX = [
  [DOMAIN_MIN, DOMAIN_MIN],
  [DOMAIN_MAX, DOMAIN_MIN],
  [DOMAIN_MAX, DOMAIN_MAX],
  [DOMAIN_MIN, DOMAIN_MAX],
];

function clipHalfPlane(polygon, site, other) {
  const midX = (site.x + other.x) / 2;
  const midY = (site.y + other.y) / 2;
  const dirX = other.x - site.x;
  const dirY = other.y - site.y;
  const side = ([px, py]) => (px - midX) * dirX + (py - midY) * dirY;

  const output = [];
  for (let i = 0; i < polygon.length; i++) {
    const curr = polygon[i];
    const prev = polygon[(i - 1 + polygon.length) % polygon.length];
    const sCurr = side(curr);
    const sPrev = side(prev);
    const currInside = sCurr <= 0;
    const prevInside = sPrev <= 0;

    if (currInside !== prevInside) {
      const ratio = sPrev / (sPrev - sCurr);
      output.push([prev[0] + ratio * (curr[0] - prev[0]), prev[1] + ratio * (curr[1] - prev[1])]);
    }
    if (currInside) output.push(curr);
  }
  return output;
}

function voronoiCell(site, sites) {
  let polygon = BBOX;
  for (const other of sites) {
    if (other.id === site.id || polygon.length === 0) continue;
    polygon = clipHalfPlane(polygon, site, other);
  }
  return polygon;
}

const cells = stores.map((site) => ({ site, polygon: voronoiCell(site, stores) }));

// --- Overlay: Voronoi cells, fill encodes store revenue -----------------------
function VoronoiCells() {
  const xScale = useXScale();
  const yScale = useYScale();

  return (
    <g>
      {cells.map(({ site, polygon }) => {
        if (polygon.length < 3) return null;
        const points = polygon.map(([px, py]) => `${xScale(px)},${yScale(py)}`).join(" ");
        return (
          <polygon
            key={site.id}
            points={points}
            fill={revenueColor(site.monthlyRevenueK)}
            fillOpacity={0.82}
            stroke={t.pageBg}
            strokeWidth={4.5}
          />
        );
      })}
    </g>
  );
}

// --- Overlay: seed markers (store locations, brand green) --------------------
function SeedMarkers() {
  const xScale = useXScale();
  const yScale = useYScale();

  return (
    <g>
      {stores.map((s) => (
        <circle key={s.id} cx={xScale(s.x)} cy={yScale(s.y)} r={9} fill={t.palette[0]} stroke={t.pageBg} strokeWidth={2.5} />
      ))}
    </g>
  );
}

// --- Overlay: title drawn in the reserved top margin --------------------------
function DiagramTitle() {
  const { width } = window.ANYPLOT_SIZE;
  return (
    <text x={width / 2} y={40} textAnchor="middle" dominantBaseline="hanging" fontSize={22} fontWeight={500} fill={t.ink}>
      {TITLE}
    </text>
  );
}

// --- Overlay: sequential color-scale legend for the cell fill -----------------
function RevenueLegend() {
  const drawingArea = useDrawingArea();
  const legendWidth = 240;
  const legendX = drawingArea.left + drawingArea.width - legendWidth;
  const legendY = drawingArea.top - 40;
  return (
    <g>
      <defs>
        <linearGradient id="revenueGradient" x1="0" y1="0" x2="1" y2="0">
          <stop offset="0%" stopColor={t.seq[0]} />
          <stop offset="100%" stopColor={t.seq[1]} />
        </linearGradient>
      </defs>
      <text x={legendX} y={legendY - 18} fontSize={14} fill={t.inkSoft}>
        Store monthly revenue ($k)
      </text>
      <rect
        x={legendX}
        y={legendY}
        width={legendWidth}
        height={14}
        fill="url(#revenueGradient)"
        rx={7}
        stroke={t.grid}
        strokeWidth={1}
      />
      <text x={legendX} y={legendY + 30} fontSize={13} fill={t.inkSoft}>
        {`$${minRevenue}k`}
      </text>
      <text x={legendX + legendWidth} y={legendY + 30} textAnchor="end" fontSize={13} fill={t.inkSoft}>
        {`$${maxRevenue}k`}
      </text>
    </g>
  );
}

// --- Chart (default-exported component — the harness mounts it) --------------
export default function Chart() {
  return (
    <ChartContainer
      width={window.ANYPLOT_SIZE.width}
      height={window.ANYPLOT_SIZE.height}
      margin={{ top: 150, right: 90, bottom: 100, left: 100 }}
      series={[]}
      skipAnimation
      disableAxisListener
      xAxis={[
        {
          scaleType: "linear",
          min: DOMAIN_MIN,
          max: DOMAIN_MAX,
          label: "X coordinate (km)",
          labelStyle: { fontSize: 16, fill: t.ink },
          tickLabelStyle: { fontSize: 14, fill: t.inkSoft },
        },
      ]}
      yAxis={[
        {
          scaleType: "linear",
          min: DOMAIN_MIN,
          max: DOMAIN_MAX,
          label: "Y coordinate (km)",
          labelStyle: { fontSize: 16, fill: t.ink },
          tickLabelStyle: { fontSize: 14, fill: t.inkSoft },
        },
      ]}
    >
      <VoronoiCells />
      <SeedMarkers />
      <ChartsXAxis />
      <ChartsYAxis />
      <DiagramTitle />
      <RevenueLegend />
    </ChartContainer>
  );
}
Runnable source as JSON, for any HTTP client: https://api.anyplot.ai/specs/voronoi-basic/muix/code. Any spec id and library id listed in llms-full.txt fit the same URL shape; every URL below is complete and callable.
{
  "spec_id": "voronoi-basic",
  "language": "javascript",
  "library": "muix",
  "page": "https://anyplot.ai/voronoi-basic/javascript/muix",
  "hub": "https://anyplot.ai/voronoi-basic",
  "code_json": "https://api.anyplot.ai/specs/voronoi-basic/muix/code",
  "spec_json": "https://api.anyplot.ai/specs/voronoi-basic",
  "render_light_png": "https://storage.googleapis.com/anyplot-images/plots/voronoi-basic/javascript/muix/plot-light.png",
  "render_dark_png": "https://storage.googleapis.com/anyplot-images/plots/voronoi-basic/javascript/muix/plot-dark.png",
  "interactive_light_html": "https://storage.googleapis.com/anyplot-images/plots/voronoi-basic/javascript/muix/plot-light.html",
  "interactive_dark_html": "https://storage.googleapis.com/anyplot-images/plots/voronoi-basic/javascript/muix/plot-dark.html",
  "quality_score": 87.0,
  "license": "MIT",
  "guide": "https://anyplot.ai/llms.txt"
}
Part of Voronoi Diagram for Spatial Partitioning on anyplot.ai.