The same plot in 14 other libraries — JavaScript: Chart.js, D3.js, Apache ECharts, MUI X Charts; Python: Altair, Bokeh, lets-plot, Matplotlib, Plotly, plotnine, Pygal, Seaborn; R: ggplot2; Julia: Makie.jl. Compare all 15 side by side: Voronoi Diagram for Spatial Partitioning in Python, R, Julia and JavaScript.
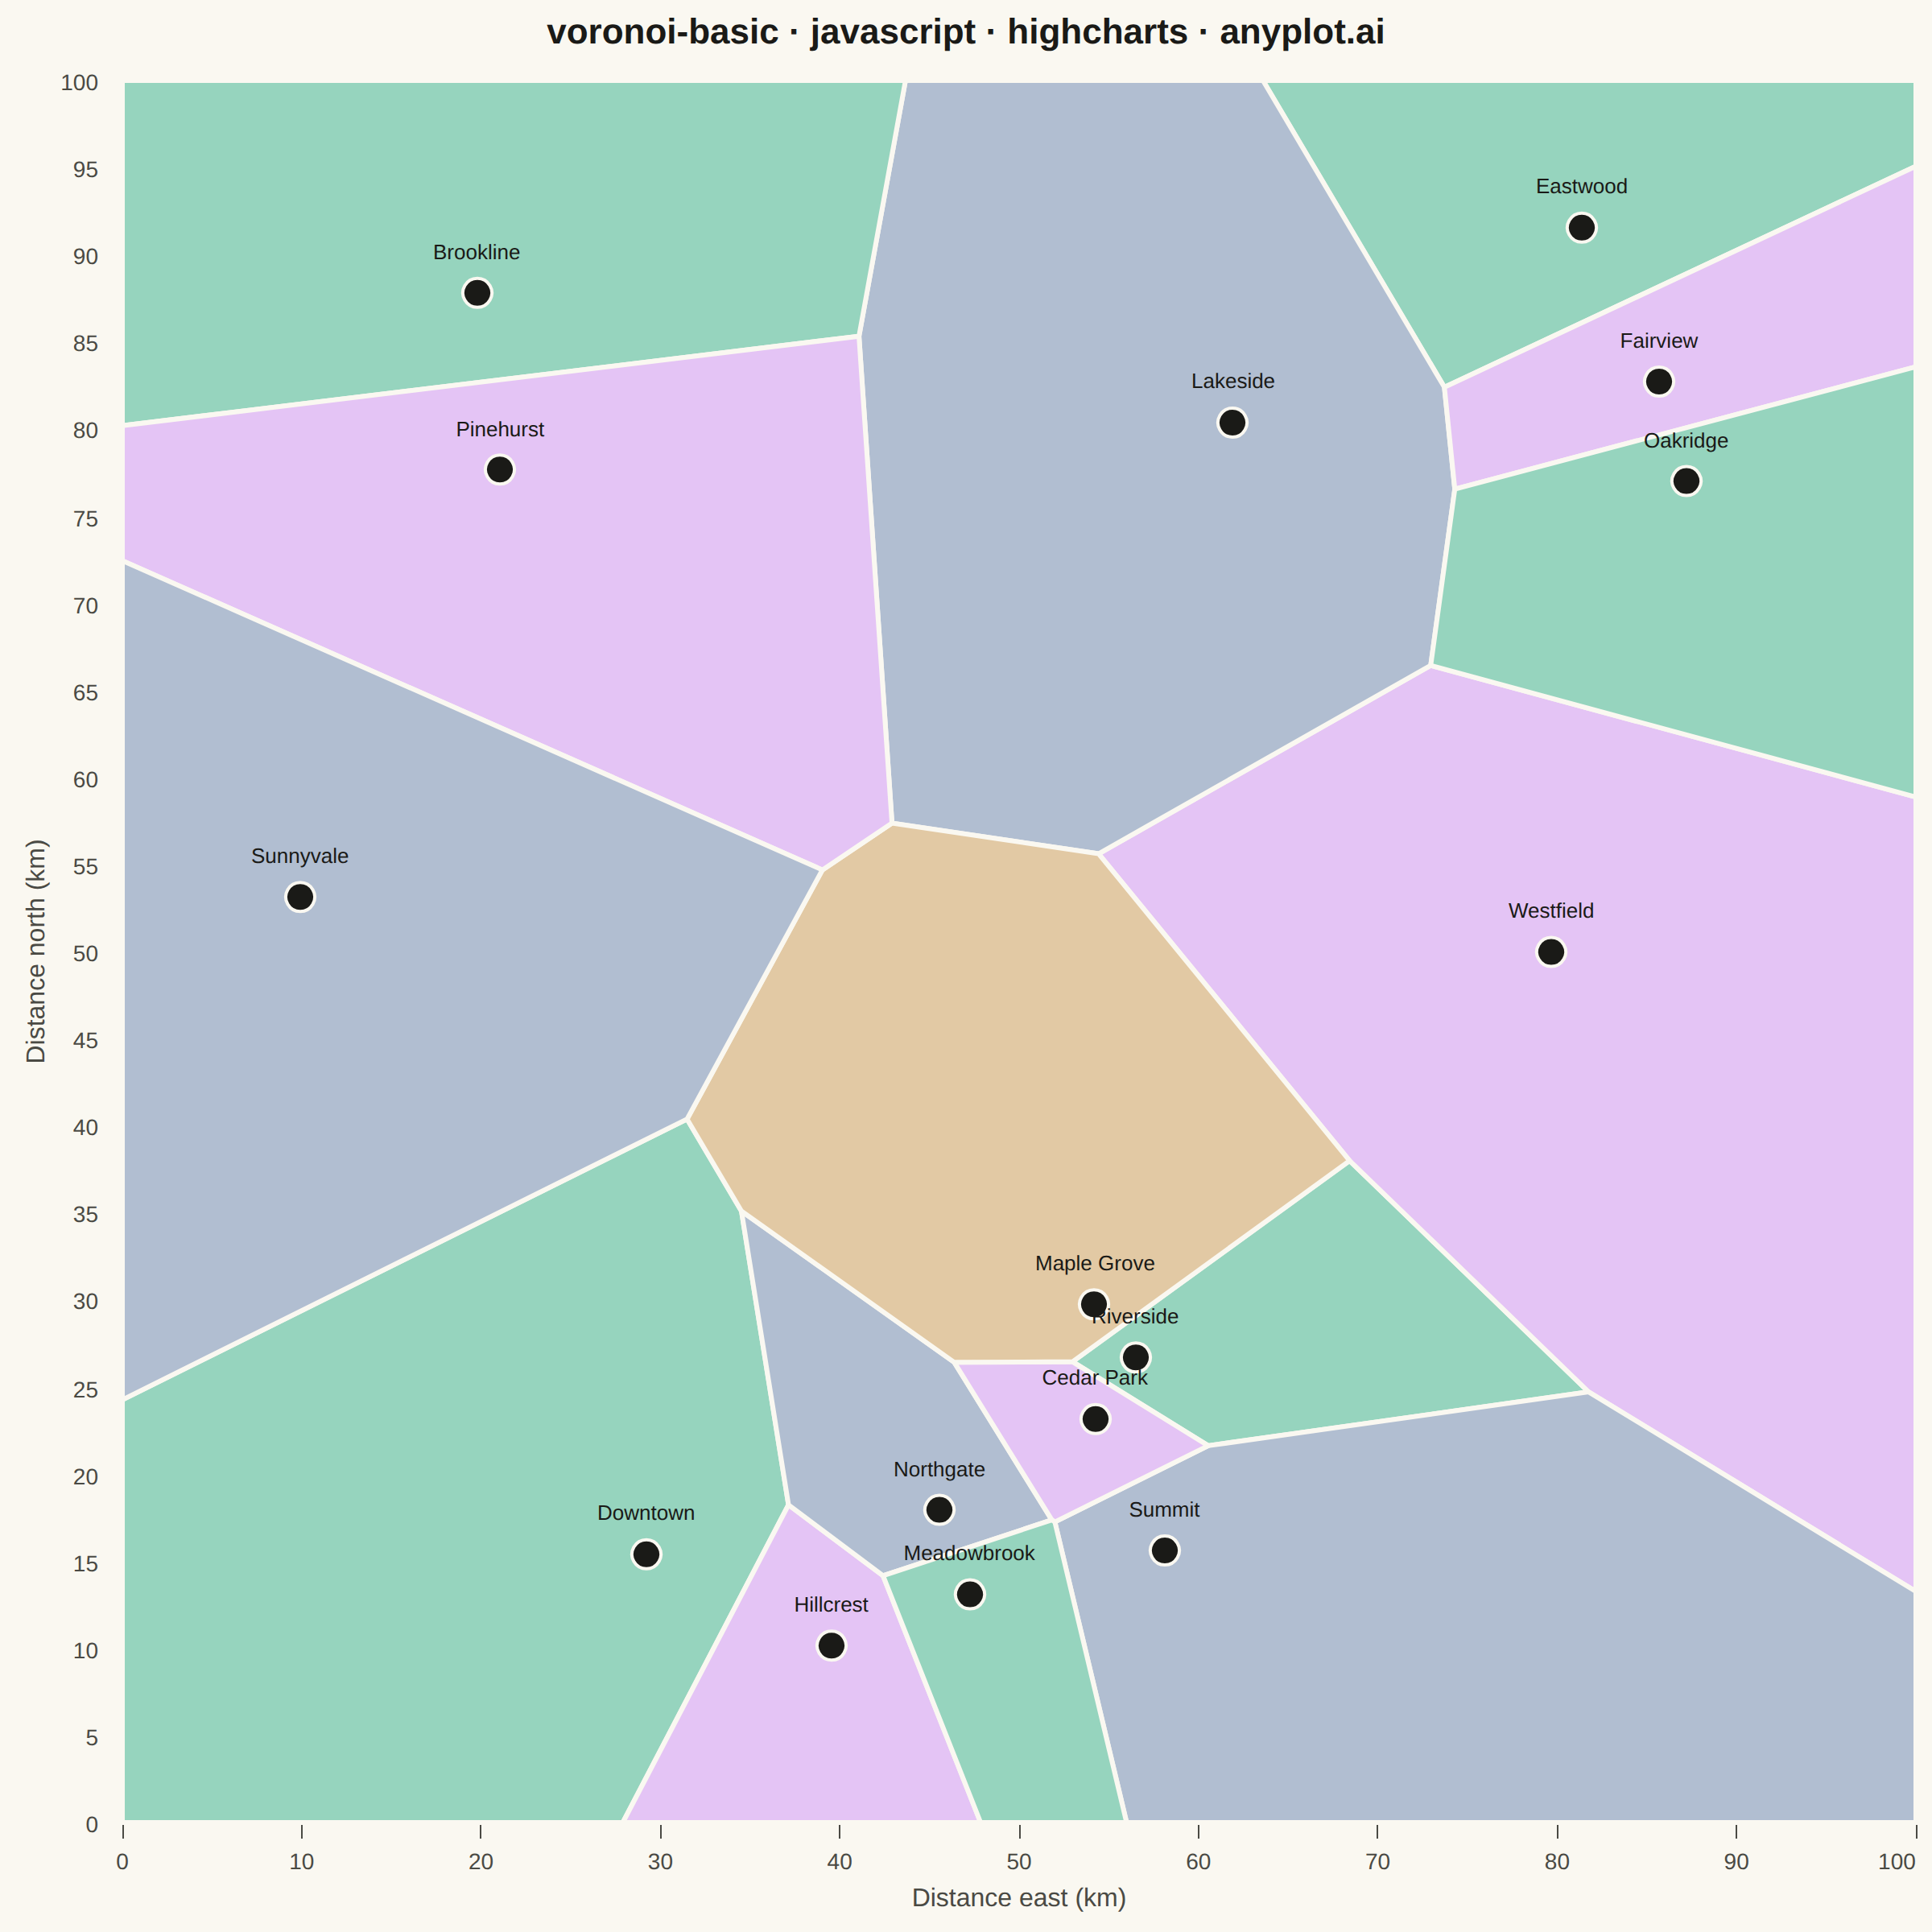
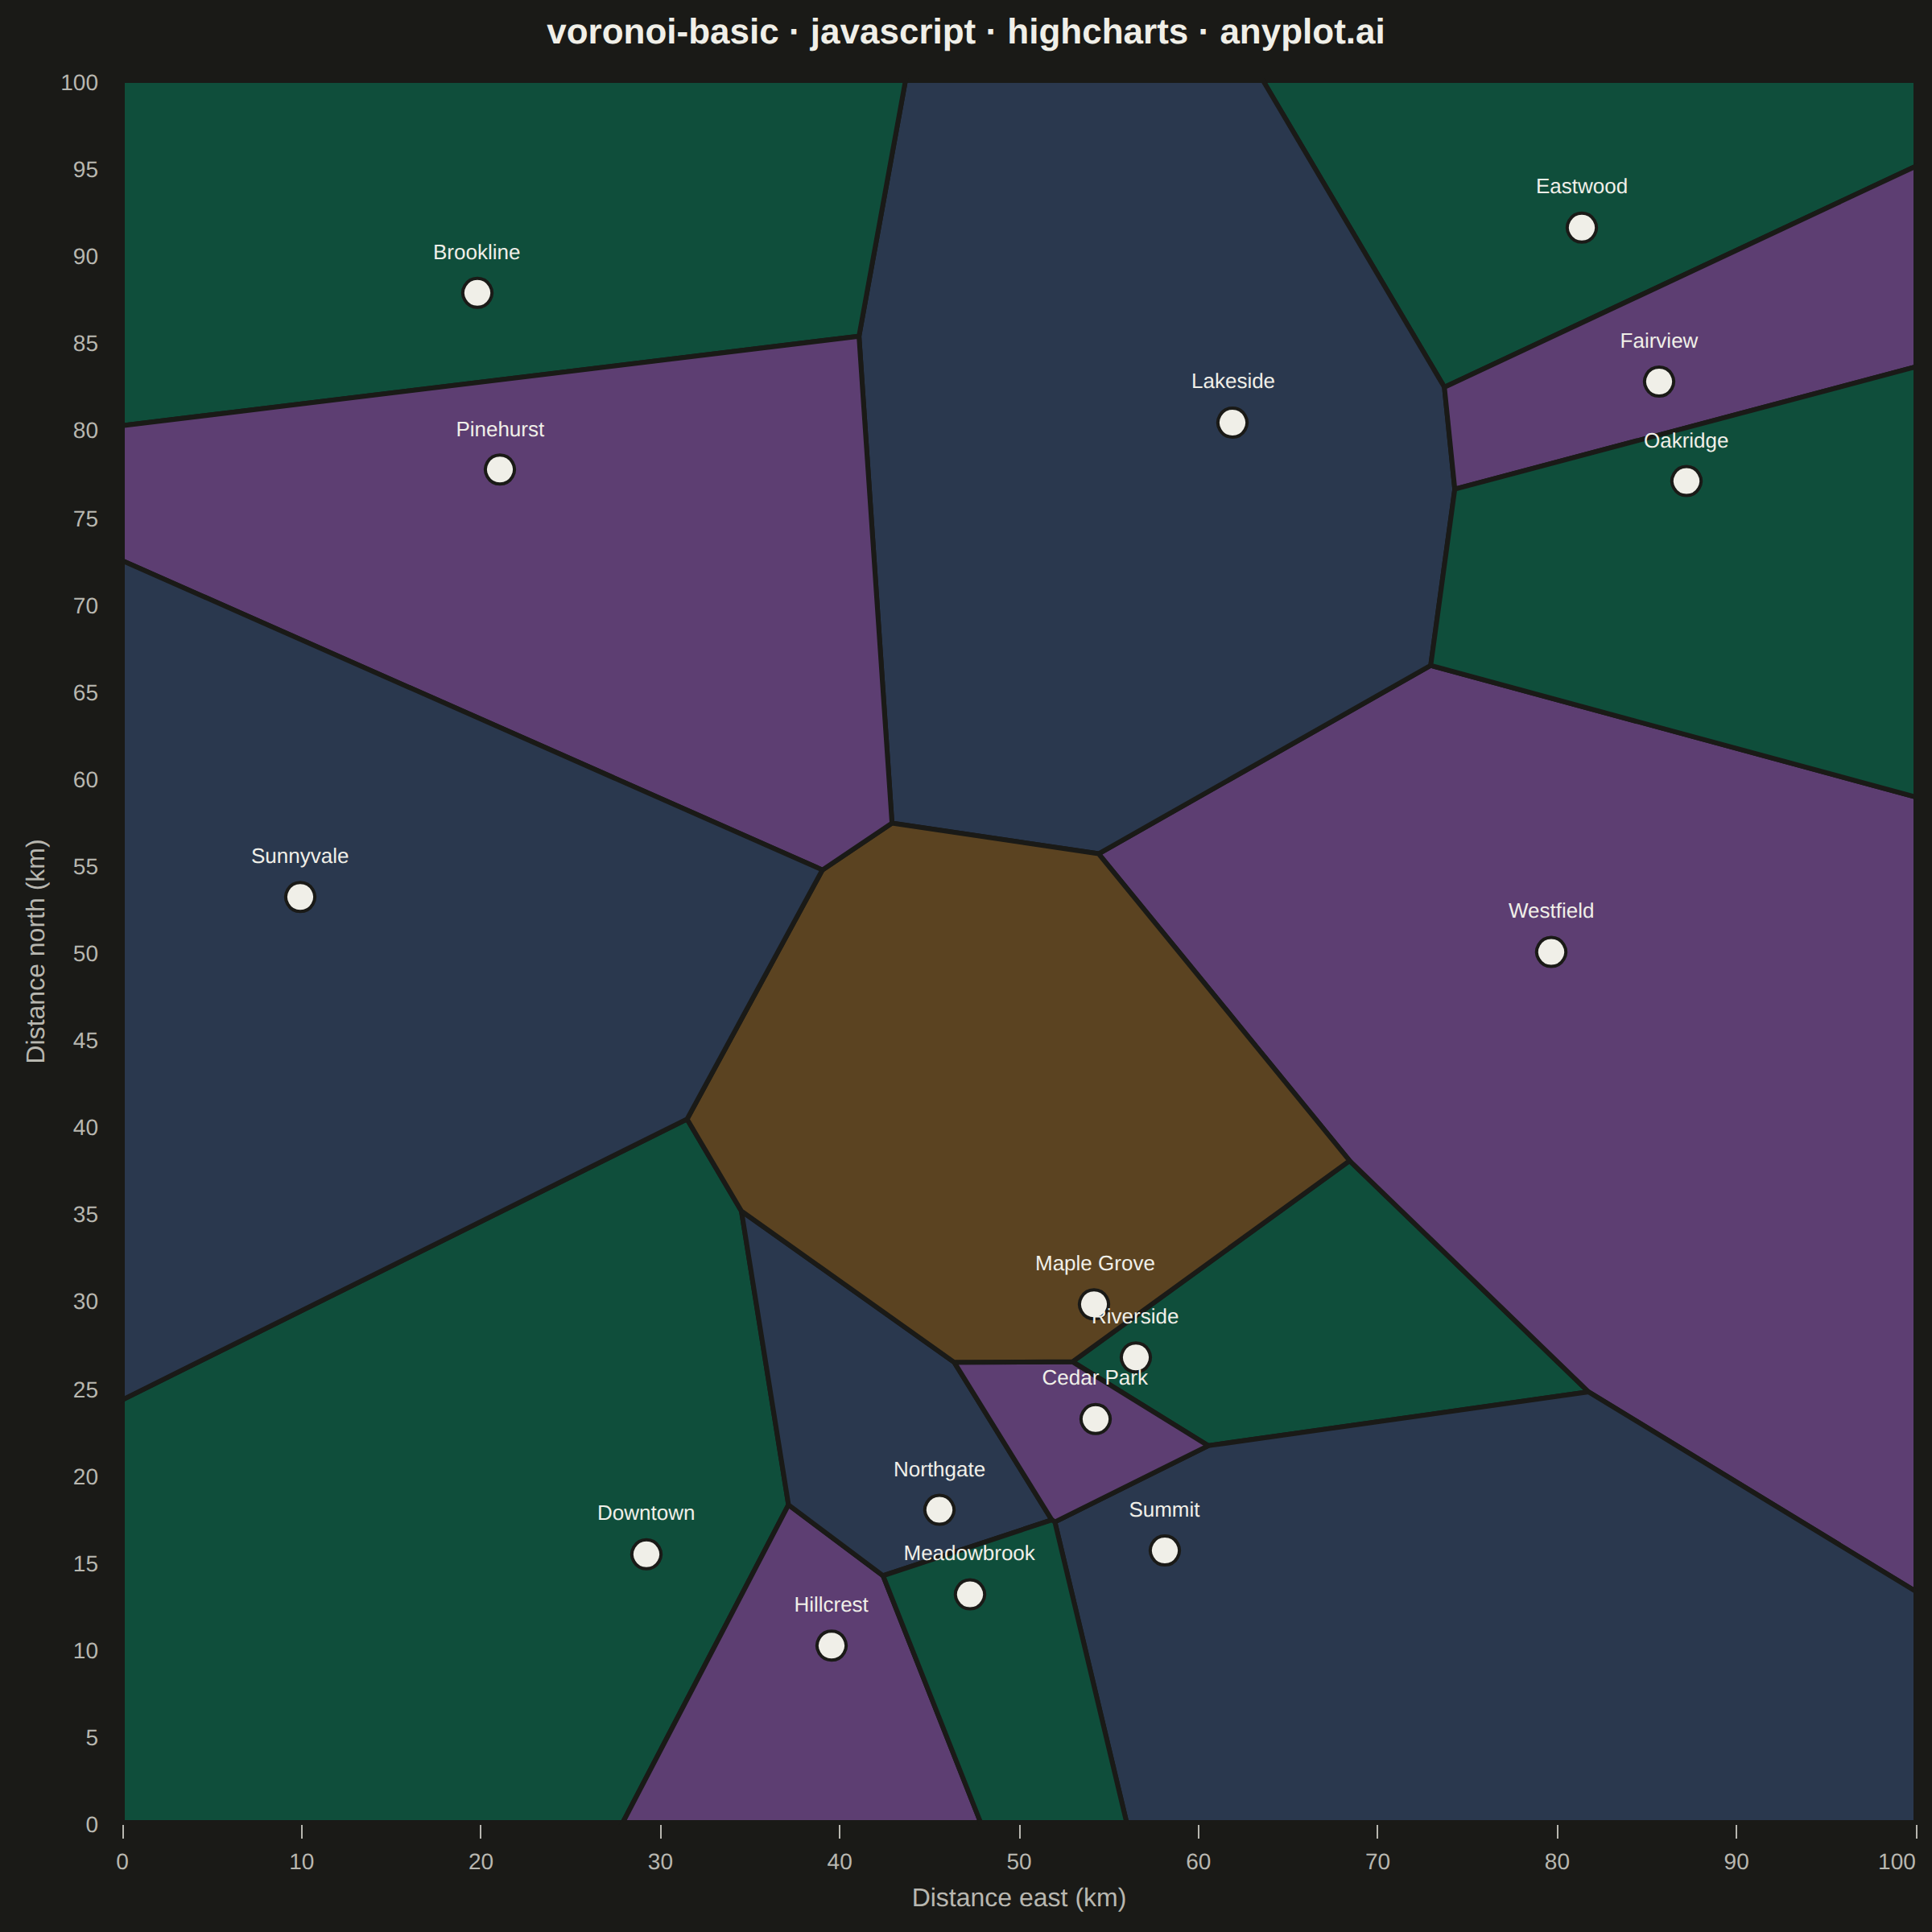
A Voronoi diagram partitions a plane into regions based on the distance to a set of seed points, where each region contains all points closer to its seed than to any other. This visualization is essential for understanding spatial relationships, proximity analysis, and territorial boundaries. It reveals natural clustering patterns and helps identify areas of influence around data points.
// anyplot.ai
// voronoi-basic: Voronoi Diagram for Spatial Partitioning
// Library: highcharts 12.6.0 | JavaScript 22.23.2
// Quality: 89/100 | Created: 2026-09-02

//# anyplot-orientation: square
const t = window.ANYPLOT_TOKENS;

// --- Data: retail store locations across a service area (km) ---------------
// Fixed-seed LCG (Numerical Recipes constants, Math.imul keeps it 32-bit safe)
// since the browser has no seeded RNG.
function lcg(seed) {
  let state = seed >>> 0;
  return function () {
    state = (Math.imul(state, 1664525) + 1013904223) >>> 0;
    return state / 4294967296;
  };
}
const rand = lcg(42);

const BOUNDS = { minX: 0, maxX: 100, minY: 0, maxY: 100 };
const storeNames = [
  "Downtown", "Riverside", "Hillcrest", "Northgate", "Eastwood",
  "Westfield", "Lakeside", "Summit", "Brookline", "Fairview",
  "Cedar Park", "Maple Grove", "Oakridge", "Pinehurst", "Meadowbrook",
  "Sunnyvale",
];
// Sites stay inset from the bbox edges so their data labels never collide
// with the top/bottom plot boundary — the Voronoi cells still reach the
// full BOUNDS since the clip polygon starts at the bbox corners.
const SITE_MARGIN = 8;
const stores = storeNames.map((label) => ({
  x: BOUNDS.minX + SITE_MARGIN + rand() * (BOUNDS.maxX - BOUNDS.minX - 2 * SITE_MARGIN),
  y: BOUNDS.minY + SITE_MARGIN + rand() * (BOUNDS.maxY - BOUNDS.minY - 2 * SITE_MARGIN),
  label,
}));

// --- Voronoi cells: half-plane intersection per site, clipped to BOUNDS ----
// Highcharts core has no polygon/voronoi series (only highcharts-more/modules
// ship those, and they are not vendored here) — so each cell is a convex
// polygon built by intersecting, for every other site, the half-plane closer
// to this site than to that one (Sutherland-Hodgman clip against the bbox).
function clipHalfPlane(poly, p, q) {
  const mid = { x: (p.x + q.x) / 2, y: (p.y + q.y) / 2 };
  const dir = { x: q.x - p.x, y: q.y - p.y };
  const side = (v) => (v.x - mid.x) * dir.x + (v.y - mid.y) * dir.y;
  const intersect = (a, b) => {
    const sa = side(a);
    const sb = side(b);
    const f = sa / (sa - sb);
    return { x: a.x + f * (b.x - a.x), y: a.y + f * (b.y - a.y) };
  };
  const out = [];
  for (let i = 0; i < poly.length; i++) {
    const curr = poly[i];
    const prev = poly[(i - 1 + poly.length) % poly.length];
    const currIn = side(curr) <= 1e-9;
    const prevIn = side(prev) <= 1e-9;
    if (currIn) {
      if (!prevIn) out.push(intersect(prev, curr));
      out.push(curr);
    } else if (prevIn) {
      out.push(intersect(prev, curr));
    }
  }
  return out;
}

function voronoiCell(site, others) {
  let poly = [
    { x: BOUNDS.minX, y: BOUNDS.minY },
    { x: BOUNDS.maxX, y: BOUNDS.minY },
    { x: BOUNDS.maxX, y: BOUNDS.maxY },
    { x: BOUNDS.minX, y: BOUNDS.maxY },
  ];
  for (const other of others) {
    if (poly.length === 0) break;
    poly = clipHalfPlane(poly, site, other);
  }
  return poly;
}

const cells = stores.map((site, i) => {
  const others = stores.filter((_, j) => j !== i);
  return { site, polygon: voronoiCell(site, others) };
});

// --- Adjacency-aware cell coloring -------------------------------------------
// Two cells are adjacent when they share a clipped bisector edge (the two
// polygons list that edge as exact reverses of one another). A flat
// index-mod-palette cycle can land neighboring cells on the same hue; instead
// run a small greedy graph coloring so every cell differs from its neighbors.
function pointsClose(a, b, eps = 1e-6) {
  return Math.abs(a.x - b.x) < eps && Math.abs(a.y - b.y) < eps;
}
function edgesOf(poly) {
  return poly.map((v, idx) => [v, poly[(idx + 1) % poly.length]]);
}
function cellsAdjacent(polyA, polyB) {
  for (const [a1, a2] of edgesOf(polyA)) {
    for (const [b1, b2] of edgesOf(polyB)) {
      if (pointsClose(a1, b2) && pointsClose(a2, b1)) return true;
    }
  }
  return false;
}
const adjacency = cells.map(() => new Set());
for (let i = 0; i < cells.length; i++) {
  for (let j = i + 1; j < cells.length; j++) {
    if (cellsAdjacent(cells[i].polygon, cells[j].polygon)) {
      adjacency[i].add(j);
      adjacency[j].add(i);
    }
  }
}
const cellColors = cells.map(() => -1);
cells.forEach((_, i) => {
  const used = new Set();
  adjacency[i].forEach((neighbor) => {
    if (cellColors[neighbor] !== -1) used.add(cellColors[neighbor]);
  });
  let colorIdx = 0;
  while (used.has(colorIdx % t.palette.length)) colorIdx++;
  cellColors[i] = colorIdx % t.palette.length;
});

// --- Chart -------------------------------------------------------------------
Highcharts.chart("container", {
  chart: {
    type: "scatter",
    backgroundColor: "transparent",
    animation: false,
    style: { fontFamily: "inherit" },
    events: {
      load() {
        const xAxis = this.xAxis[0];
        const yAxis = this.yAxis[0];
        const group = this.renderer.g("voronoi-cells").add();
        group.attr({ zIndex: 2 });
        cells.forEach(({ polygon }, i) => {
          if (polygon.length < 3) return;
          const path = polygon.map((v, idx) => [
            idx === 0 ? "M" : "L",
            xAxis.toPixels(v.x),
            yAxis.toPixels(v.y),
          ]);
          path.push(["Z"]);
          this.renderer
            .path(path)
            .attr({
              fill: Highcharts.color(t.palette[cellColors[i]])
                .setOpacity(0.4)
                .get(),
              stroke: t.pageBg,
              "stroke-width": 3,
            })
            .add(group);
        });
      },
    },
  },
  credits: { enabled: false },
  colors: t.palette,
  title: {
    text: "voronoi-basic · javascript · highcharts · anyplot.ai",
    style: { color: t.ink, fontSize: "22px", fontWeight: "600" },
  },
  xAxis: {
    min: BOUNDS.minX,
    max: BOUNDS.maxX,
    title: { text: "Distance east (km)", style: { color: t.inkSoft, fontSize: "16px" } },
    lineColor: t.inkSoft,
    tickColor: t.inkSoft,
    gridLineWidth: 0,
    labels: { style: { color: t.inkSoft, fontSize: "14px" } },
  },
  yAxis: {
    min: BOUNDS.minY,
    max: BOUNDS.maxY,
    title: { text: "Distance north (km)", style: { color: t.inkSoft, fontSize: "16px" } },
    gridLineWidth: 0,
    labels: { style: { color: t.inkSoft, fontSize: "14px" } },
  },
  legend: { enabled: false },
  tooltip: {
    pointFormat: "<b>{point.name}</b><br/>({point.x:.1f}, {point.y:.1f}) km",
  },
  plotOptions: {
    series: { animation: false },
  },
  series: [
    {
      name: "Store location",
      data: stores.map((s) => ({ x: s.x, y: s.y, name: s.label })),
      color: t.ink,
      marker: { radius: 9, fillColor: t.ink, lineColor: t.pageBg, lineWidth: 2 },
      zIndex: 3,
      dataLabels: {
        enabled: true,
        format: "{point.name}",
        style: {
          color: t.ink,
          fontSize: "13px",
          fontWeight: "500",
          textOutline: "none",
        },
        y: -14,
      },
    },
  ],
});
Runnable source as JSON, for any HTTP client: https://api.anyplot.ai/specs/voronoi-basic/highcharts/code. Any spec id and library id listed in llms-full.txt fit the same URL shape; every URL below is complete and callable.
{
  "spec_id": "voronoi-basic",
  "language": "javascript",
  "library": "highcharts",
  "page": "https://anyplot.ai/voronoi-basic/javascript/highcharts",
  "hub": "https://anyplot.ai/voronoi-basic",
  "code_json": "https://api.anyplot.ai/specs/voronoi-basic/highcharts/code",
  "spec_json": "https://api.anyplot.ai/specs/voronoi-basic",
  "render_light_png": "https://storage.googleapis.com/anyplot-images/plots/voronoi-basic/javascript/highcharts/plot-light.png",
  "render_dark_png": "https://storage.googleapis.com/anyplot-images/plots/voronoi-basic/javascript/highcharts/plot-dark.png",
  "interactive_light_html": "https://storage.googleapis.com/anyplot-images/plots/voronoi-basic/javascript/highcharts/plot-light.html",
  "interactive_dark_html": "https://storage.googleapis.com/anyplot-images/plots/voronoi-basic/javascript/highcharts/plot-dark.html",
  "quality_score": 89.0,
  "license": "MIT",
  "guide": "https://anyplot.ai/llms.txt"
}
Part of Voronoi Diagram for Spatial Partitioning on anyplot.ai.