The same plot in 14 other libraries — Python: Altair, Bokeh, lets-plot, Matplotlib, Plotly, plotnine, Seaborn; R: ggplot2; Julia: Makie.jl; JavaScript: Chart.js, D3.js, Apache ECharts, Highcharts, MUI X Charts. Compare all 15 side by side: Wind Barb Plot for Meteorological Data in Python, R, Julia and JavaScript.
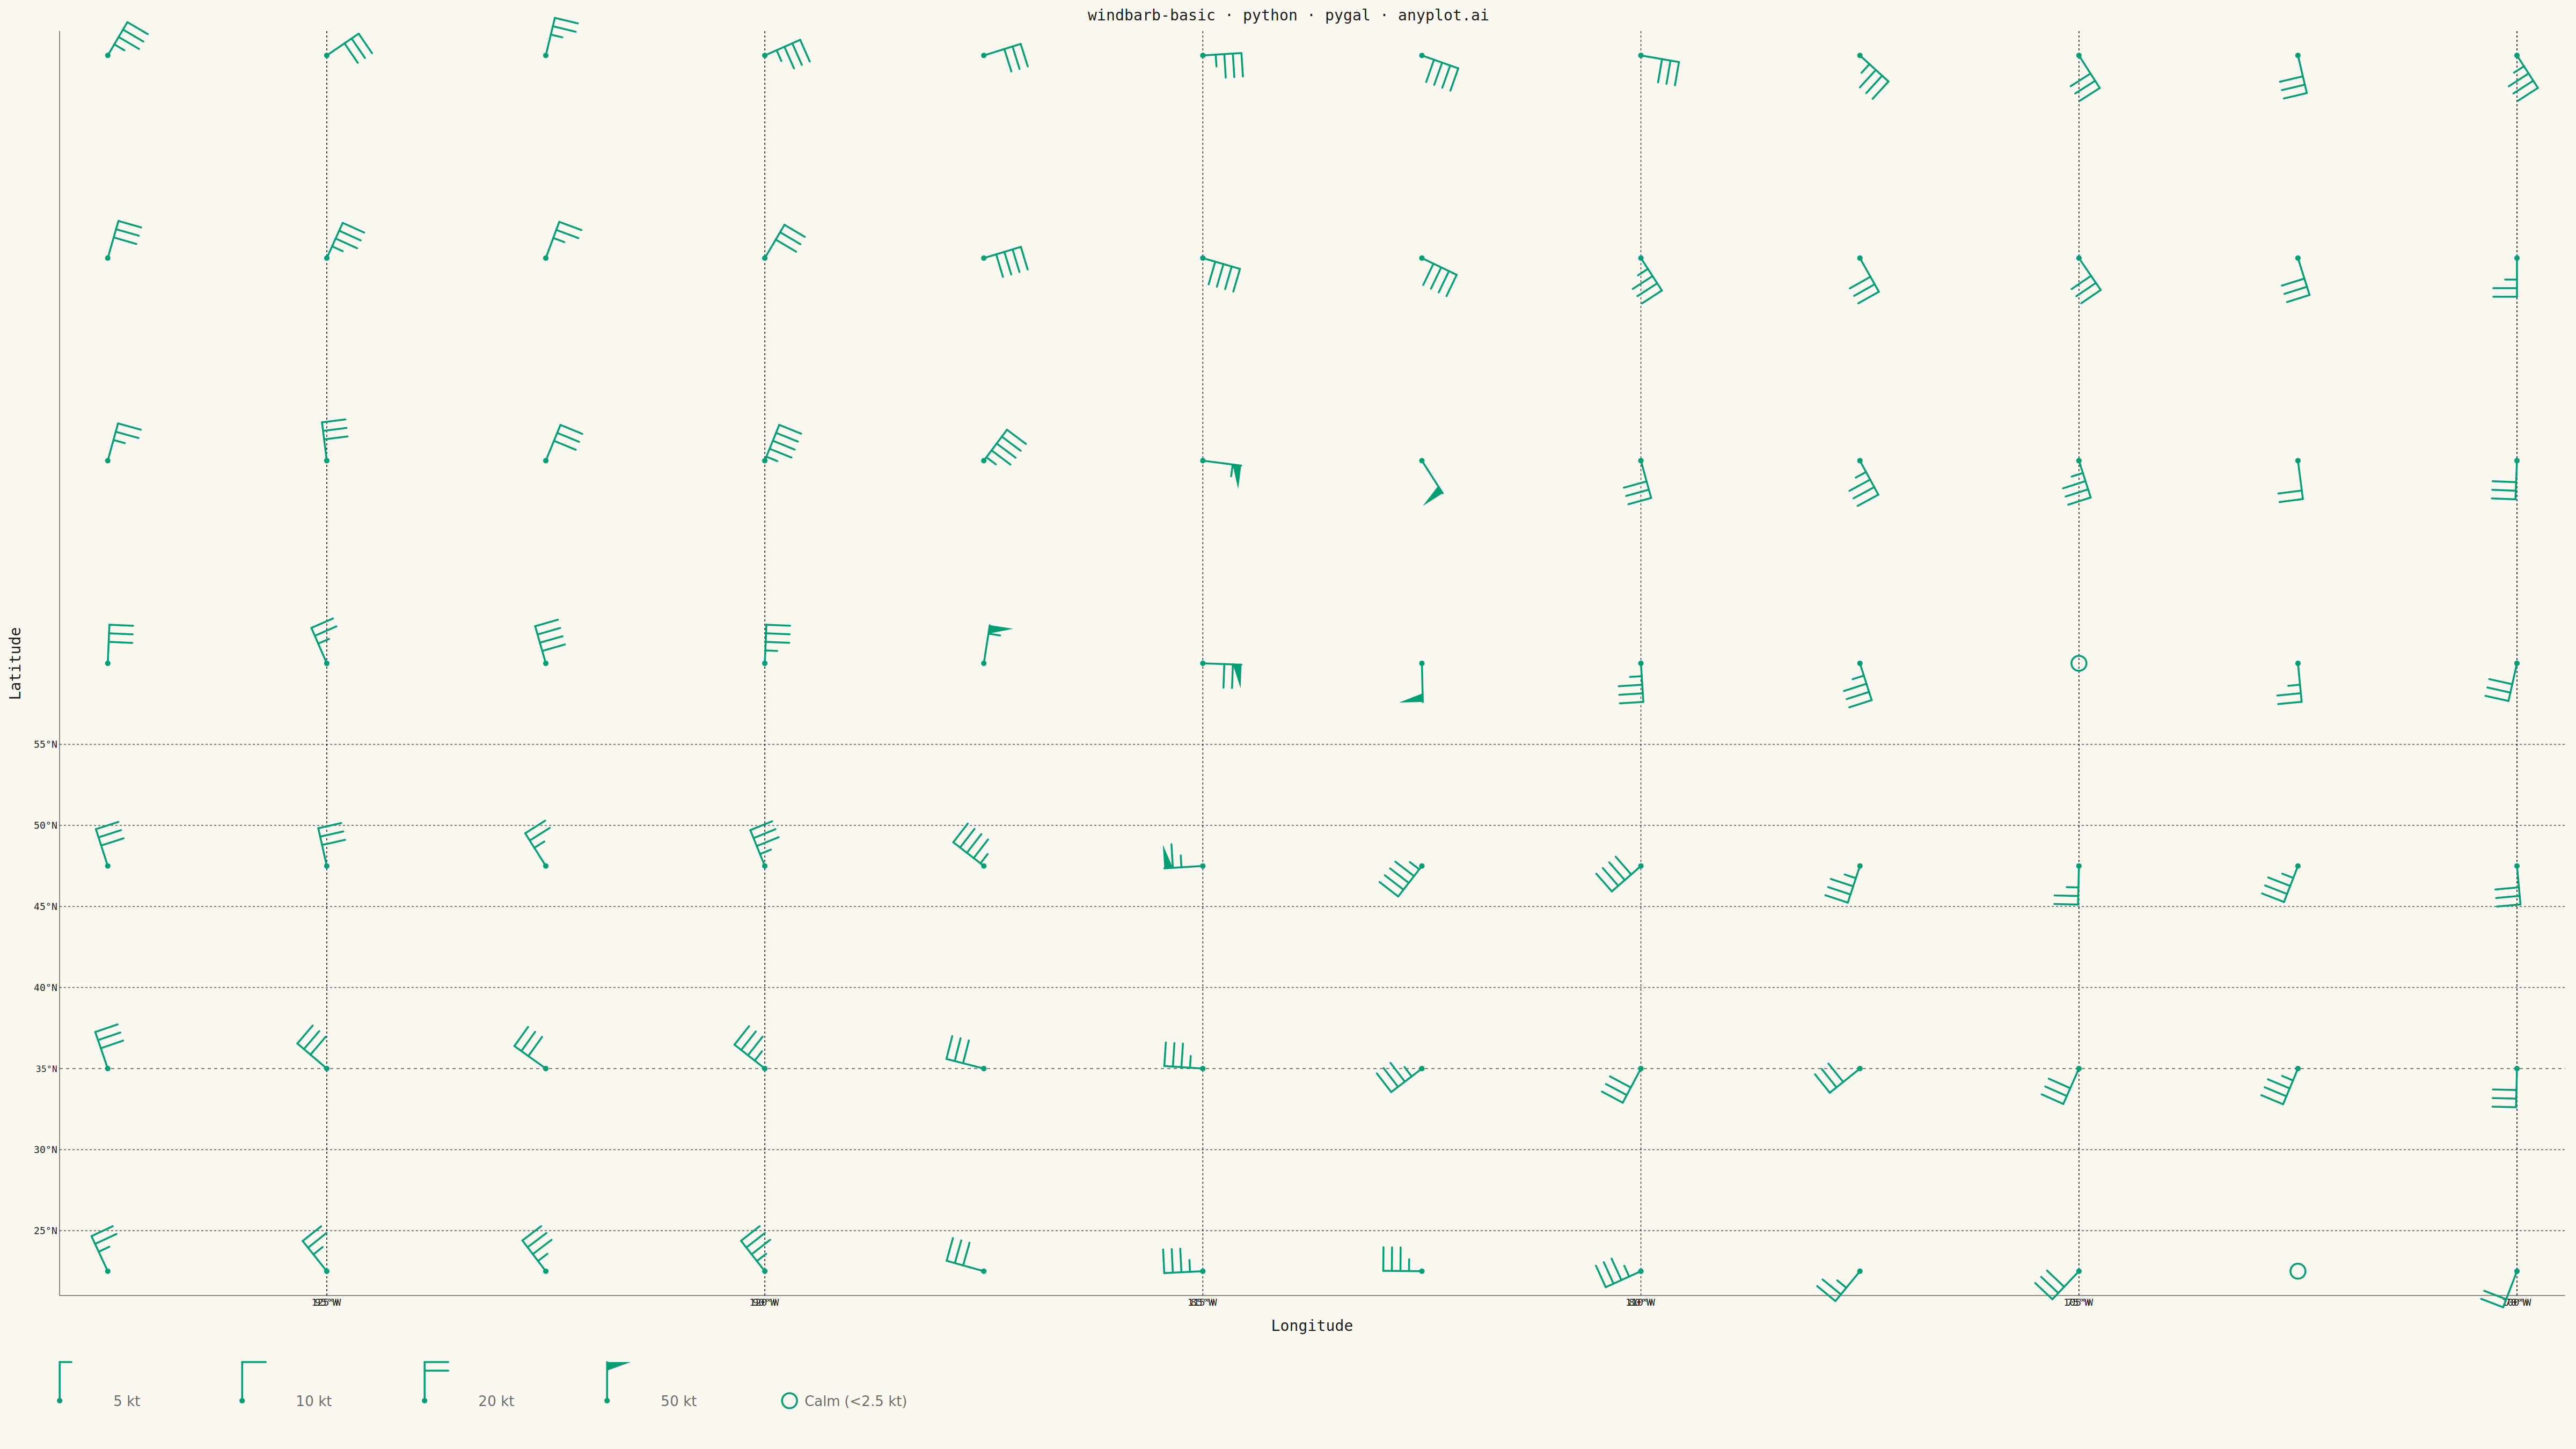
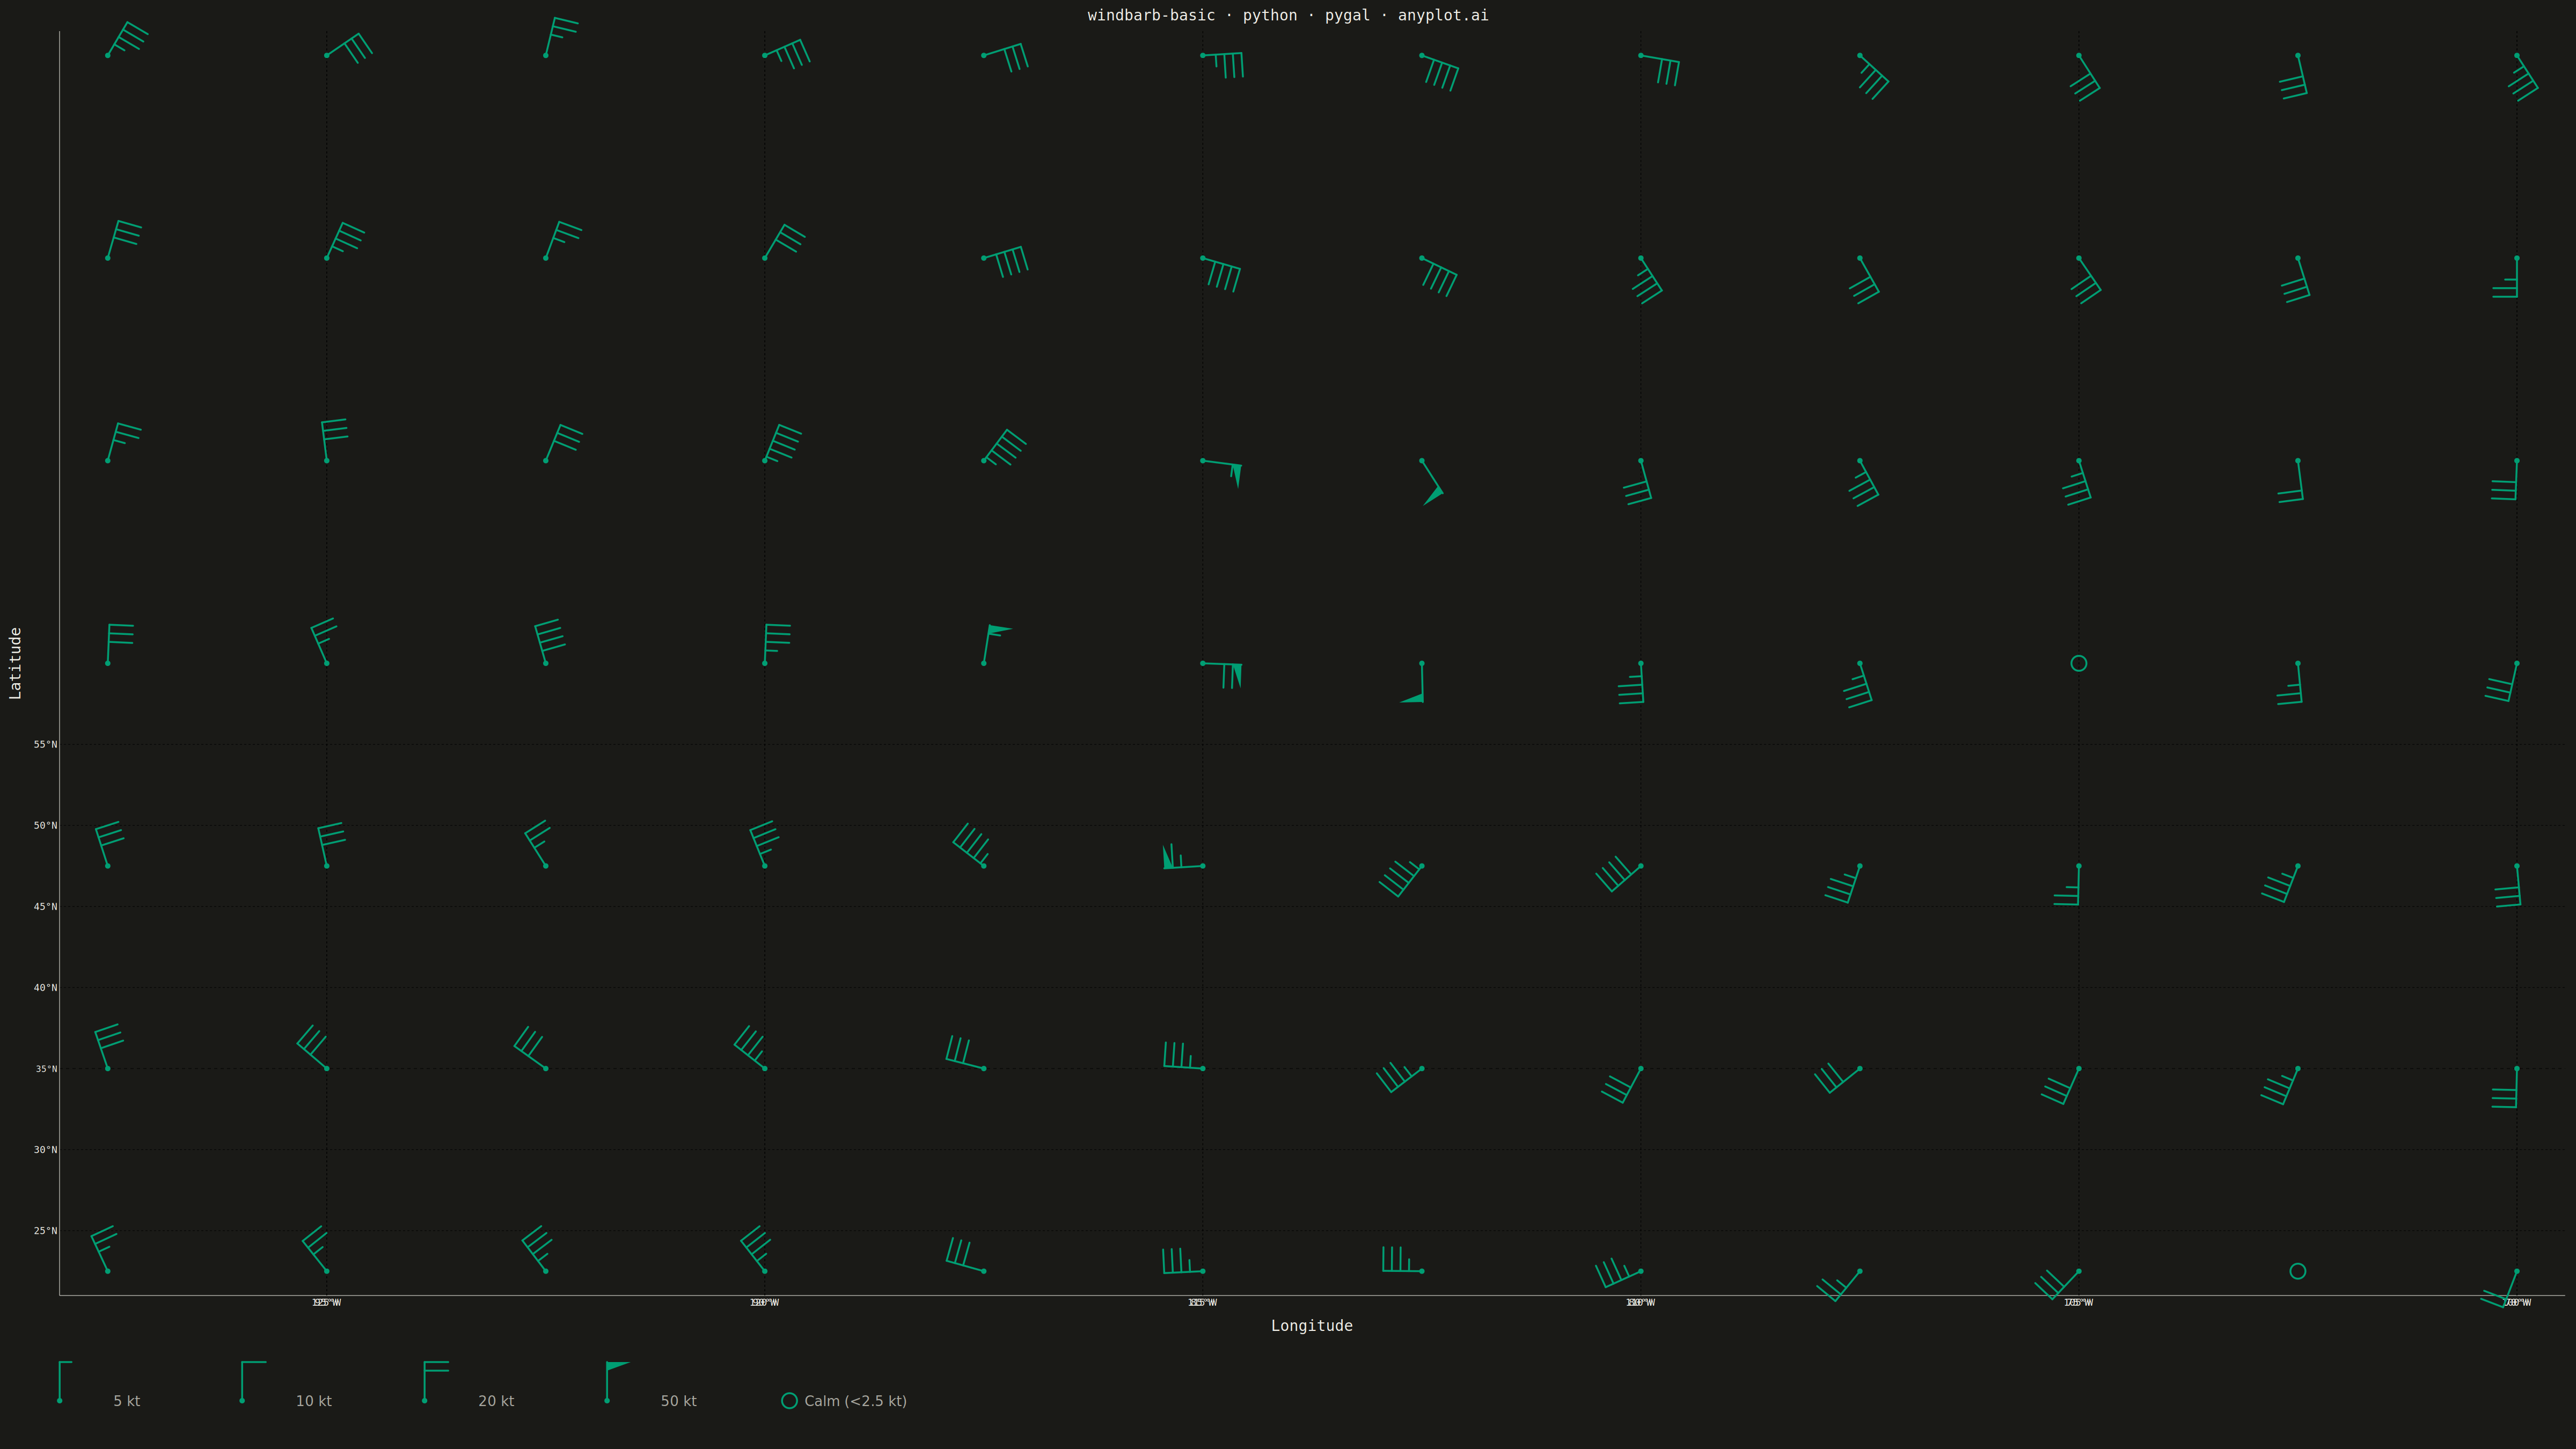
A wind barb plot displays wind speed and direction at specific locations using standard meteorological barb notation. Each barb consists of a staff pointing in the direction from which the wind blows, with short barbs (5 knots), long barbs (10 knots), and triangular pennants (50 knots) attached to indicate speed. This internationally recognized symbology enables rapid interpretation of wind patterns across weather maps and atmospheric data visualizations.
""" anyplot.ai
windbarb-basic: Wind Barb Plot for Meteorological Data
Library: pygal 3.1.0 | Python 3.13.13
Quality: 81/100 | Created: 2026-05-19
"""

import math
import os
import sys
import xml.etree.ElementTree as ET


# Drop script dir from sys.path so `import pygal` resolves to the library, not this file
sys.path[:] = [p for p in sys.path if p not in ("", ".", os.path.dirname(os.path.abspath(__file__)))]

import numpy as np
import pygal
from pygal.style import Style


THEME = os.getenv("ANYPLOT_THEME", "light")
PAGE_BG = "#FAF8F1" if THEME == "light" else "#1A1A17"
INK = "#1A1A17" if THEME == "light" else "#F0EFE8"
INK_SOFT = "#4A4A44" if THEME == "light" else "#B8B7B0"
INK_MUTED = "#6B6A63" if THEME == "light" else "#A8A79F"
BRAND = "#009E73"

custom_style = Style(
    background=PAGE_BG,
    plot_background=PAGE_BG,
    foreground=INK,
    foreground_strong=INK,
    foreground_subtle=INK_MUTED,
    colors=(BRAND,),
    title_font_size=28,
    label_font_size=18,
    major_label_font_size=16,
    legend_font_size=16,
    value_font_size=14,
    stroke_width=2,
)

# Data: synthetic surface wind observations on a 12×7 station grid
# Domain: western North America, simulating a mid-latitude cyclone
np.random.seed(42)
NX, NY = 12, 7
lons = np.linspace(-125, -70, NX)
lats = np.linspace(25, 55, NY)
lon_g, lat_g = np.meshgrid(lons, lats)
slons = lon_g.ravel()
slats = lat_g.ravel()
N = len(slons)

LOW_LON, LOW_LAT = -100.0, 40.0
rel_lon = slons - LOW_LON
rel_lat = slats - LOW_LAT
dist = np.sqrt(rel_lon**2 + rel_lat**2) + 0.5
angle_to_low = np.arctan2(rel_lon, rel_lat)
dirs = (np.degrees(angle_to_low + math.pi / 2) + np.random.normal(0, 12, N)) % 360
speeds = np.clip(22 + 180 / dist + np.random.normal(0, 4, N), 3, 70)
# Two calm stations (speed < 2.5 kt)
speeds[10] = 1.5
speeds[45] = 1.5

STAFF, BSPC, BFULL, BHALF = 72, 16, 44, 22


def barb_elems(cx, cy, spd, dirn):
    """Return list of SVG element strings for one meteorological wind barb."""
    if spd < 2.5:
        return [f'<circle cx="{cx:.1f}" cy="{cy:.1f}" r="14" fill="none" stroke="{BRAND}" stroke-width="3.5"/>']
    out = [f'<circle cx="{cx:.1f}" cy="{cy:.1f}" r="5" fill="{BRAND}"/>']
    dr = math.radians(dirn)
    sdx, sdy = math.sin(dr), -math.cos(dr)
    xt, yt = cx + sdx * STAFF, cy + sdy * STAFF
    out.append(
        f'<line x1="{cx:.1f}" y1="{cy:.1f}" x2="{xt:.1f}" y2="{yt:.1f}" '
        f'stroke="{BRAND}" stroke-width="3.5" stroke-linecap="round"/>'
    )
    bpx, bpy = -sdy, sdx
    sp5 = round(spd / 5) * 5
    n50, sp5 = divmod(sp5, 50)
    n10, sp5 = divmod(sp5, 10)
    n5 = sp5 // 5
    pos = 0.0
    for _ in range(n50):
        bx, by = xt - sdx * pos, yt - sdy * pos
        tx, ty = bx + bpx * BFULL, by + bpy * BFULL
        nx2, ny2 = bx - sdx * BSPC, by - sdy * BSPC
        out.append(
            f'<polygon points="{bx:.1f},{by:.1f} {tx:.1f},{ty:.1f} {nx2:.1f},{ny2:.1f}" fill="{BRAND}" stroke="none"/>'
        )
        pos += BSPC
    for _ in range(n10):
        bx, by = xt - sdx * pos, yt - sdy * pos
        tx, ty = bx + bpx * BFULL, by + bpy * BFULL
        out.append(
            f'<line x1="{bx:.1f}" y1="{by:.1f}" x2="{tx:.1f}" y2="{ty:.1f}" '
            f'stroke="{BRAND}" stroke-width="3.5" stroke-linecap="round"/>'
        )
        pos += BSPC
    for _ in range(n5):
        bx, by = xt - sdx * pos, yt - sdy * pos
        tx, ty = bx + bpx * BHALF, by + bpy * BHALF
        out.append(
            f'<line x1="{bx:.1f}" y1="{by:.1f}" x2="{tx:.1f}" y2="{ty:.1f}" '
            f'stroke="{BRAND}" stroke-width="3.5" stroke-linecap="round"/>'
        )
        pos += BSPC
    return out


class WindBarbXY(pygal.XY):
    """pygal.XY subclass overlaying meteorological wind barb symbols.

    Data points are hidden (show_dots=False); wind barbs are injected via
    barb_elems() into the plot node using pygal's internal coordinate view.
    """

    def __init__(self, station_winds, **kw):
        self._station_winds = station_winds  # set before super().__init__
        super().__init__(**kw)

    def _draw(self):
        super()._draw()
        # After super()._draw(), self.view maps data coords to plot-area pixels
        # and self.nodes['plot'] is the SVG group with translate(ml, mt)
        barb_node = self.svg.node(self.nodes["plot"], tag="g", id="wind-barbs")
        for lon, lat, spd, dirn in self._station_winds:
            px, py = self.view.x(lon), self.view.y(lat)
            for s in barb_elems(px, py, spd, dirn):
                barb_node.append(ET.fromstring(s.encode()))
        self._draw_wind_legend()

    def _draw_wind_legend(self):
        """Draw wind speed legend in the bottom margin below the plot area."""
        # Place legend near the bottom of the SVG (absolute coordinates)
        lx = self.margin_box.left
        ly = self.height - 90
        leg = self.svg.node(self.nodes["graph"], tag="g", id="wind-legend")
        for j, (spd, lbl) in enumerate([(5, "5 kt"), (10, "10 kt"), (20, "20 kt"), (50, "50 kt")]):
            ix = lx + j * 340
            for s in barb_elems(ix, ly, spd, 0):  # northerly sample barbs
                leg.append(ET.fromstring(s.encode()))
            txt = ET.SubElement(leg, "text")
            txt.set("x", str(ix + 100))
            txt.set("y", str(ly + 10))
            txt.set("fill", INK_MUTED)
            txt.set("font-size", "26")
            txt.set("font-family", "sans-serif")
            txt.set("text-anchor", "start")
            txt.text = lbl
        cx_calm = lx + 4 * 340
        leg.append(
            ET.fromstring(
                f'<circle cx="{cx_calm}" cy="{ly}" r="14" fill="none" stroke="{BRAND}" stroke-width="3.5"/>'.encode()
            )
        )
        calm_txt = ET.SubElement(leg, "text")
        calm_txt.set("x", str(cx_calm + 28))
        calm_txt.set("y", str(ly + 10))
        calm_txt.set("fill", INK_MUTED)
        calm_txt.set("font-size", "26")
        calm_txt.set("font-family", "sans-serif")
        calm_txt.text = "Calm (<2.5 kt)"


station_winds = [(float(slons[i]), float(slats[i]), float(speeds[i]), float(dirs[i])) for i in range(N)]

chart = WindBarbXY(
    station_winds=station_winds,
    style=custom_style,
    width=4800,
    height=2700,
    title="windbarb-basic · python · pygal · anyplot.ai",
    x_title="Longitude",
    y_title="Latitude",
    show_dots=False,
    stroke=False,
    show_legend=False,
    show_x_guides=True,
    show_y_guides=True,
    margin_bottom=220,
)
# Two corner points establish the axis data range (dots hidden via show_dots=False)
chart.add("wind", [(float(lons[0]), float(lats[0])), (float(lons[-1]), float(lats[-1]))])
chart.x_labels = [f"{abs(int(lon))}°W" for lon in lons]
chart.y_labels = [f"{lat:.0f}°N" for lat in lats]

chart.render_to_png(f"plot-{THEME}.png")
with open(f"plot-{THEME}.html", "wb") as f:
    f.write(chart.render())
Runnable source as JSON, for any HTTP client: https://api.anyplot.ai/specs/windbarb-basic/pygal/code. Any spec id and library id listed in llms-full.txt fit the same URL shape; every URL below is complete and callable.
{
  "spec_id": "windbarb-basic",
  "language": "python",
  "library": "pygal",
  "page": "https://anyplot.ai/windbarb-basic/python/pygal",
  "hub": "https://anyplot.ai/windbarb-basic",
  "code_json": "https://api.anyplot.ai/specs/windbarb-basic/pygal/code",
  "spec_json": "https://api.anyplot.ai/specs/windbarb-basic",
  "render_light_png": "https://storage.googleapis.com/anyplot-images/plots/windbarb-basic/python/pygal/plot-light.png",
  "render_dark_png": "https://storage.googleapis.com/anyplot-images/plots/windbarb-basic/python/pygal/plot-dark.png",
  "interactive_light_html": "https://storage.googleapis.com/anyplot-images/plots/windbarb-basic/python/pygal/plot-light.html",
  "interactive_dark_html": "https://storage.googleapis.com/anyplot-images/plots/windbarb-basic/python/pygal/plot-dark.html",
  "quality_score": 81.0,
  "license": "MIT",
  "guide": "https://anyplot.ai/llms.txt"
}
Part of Wind Barb Plot for Meteorological Data on anyplot.ai.