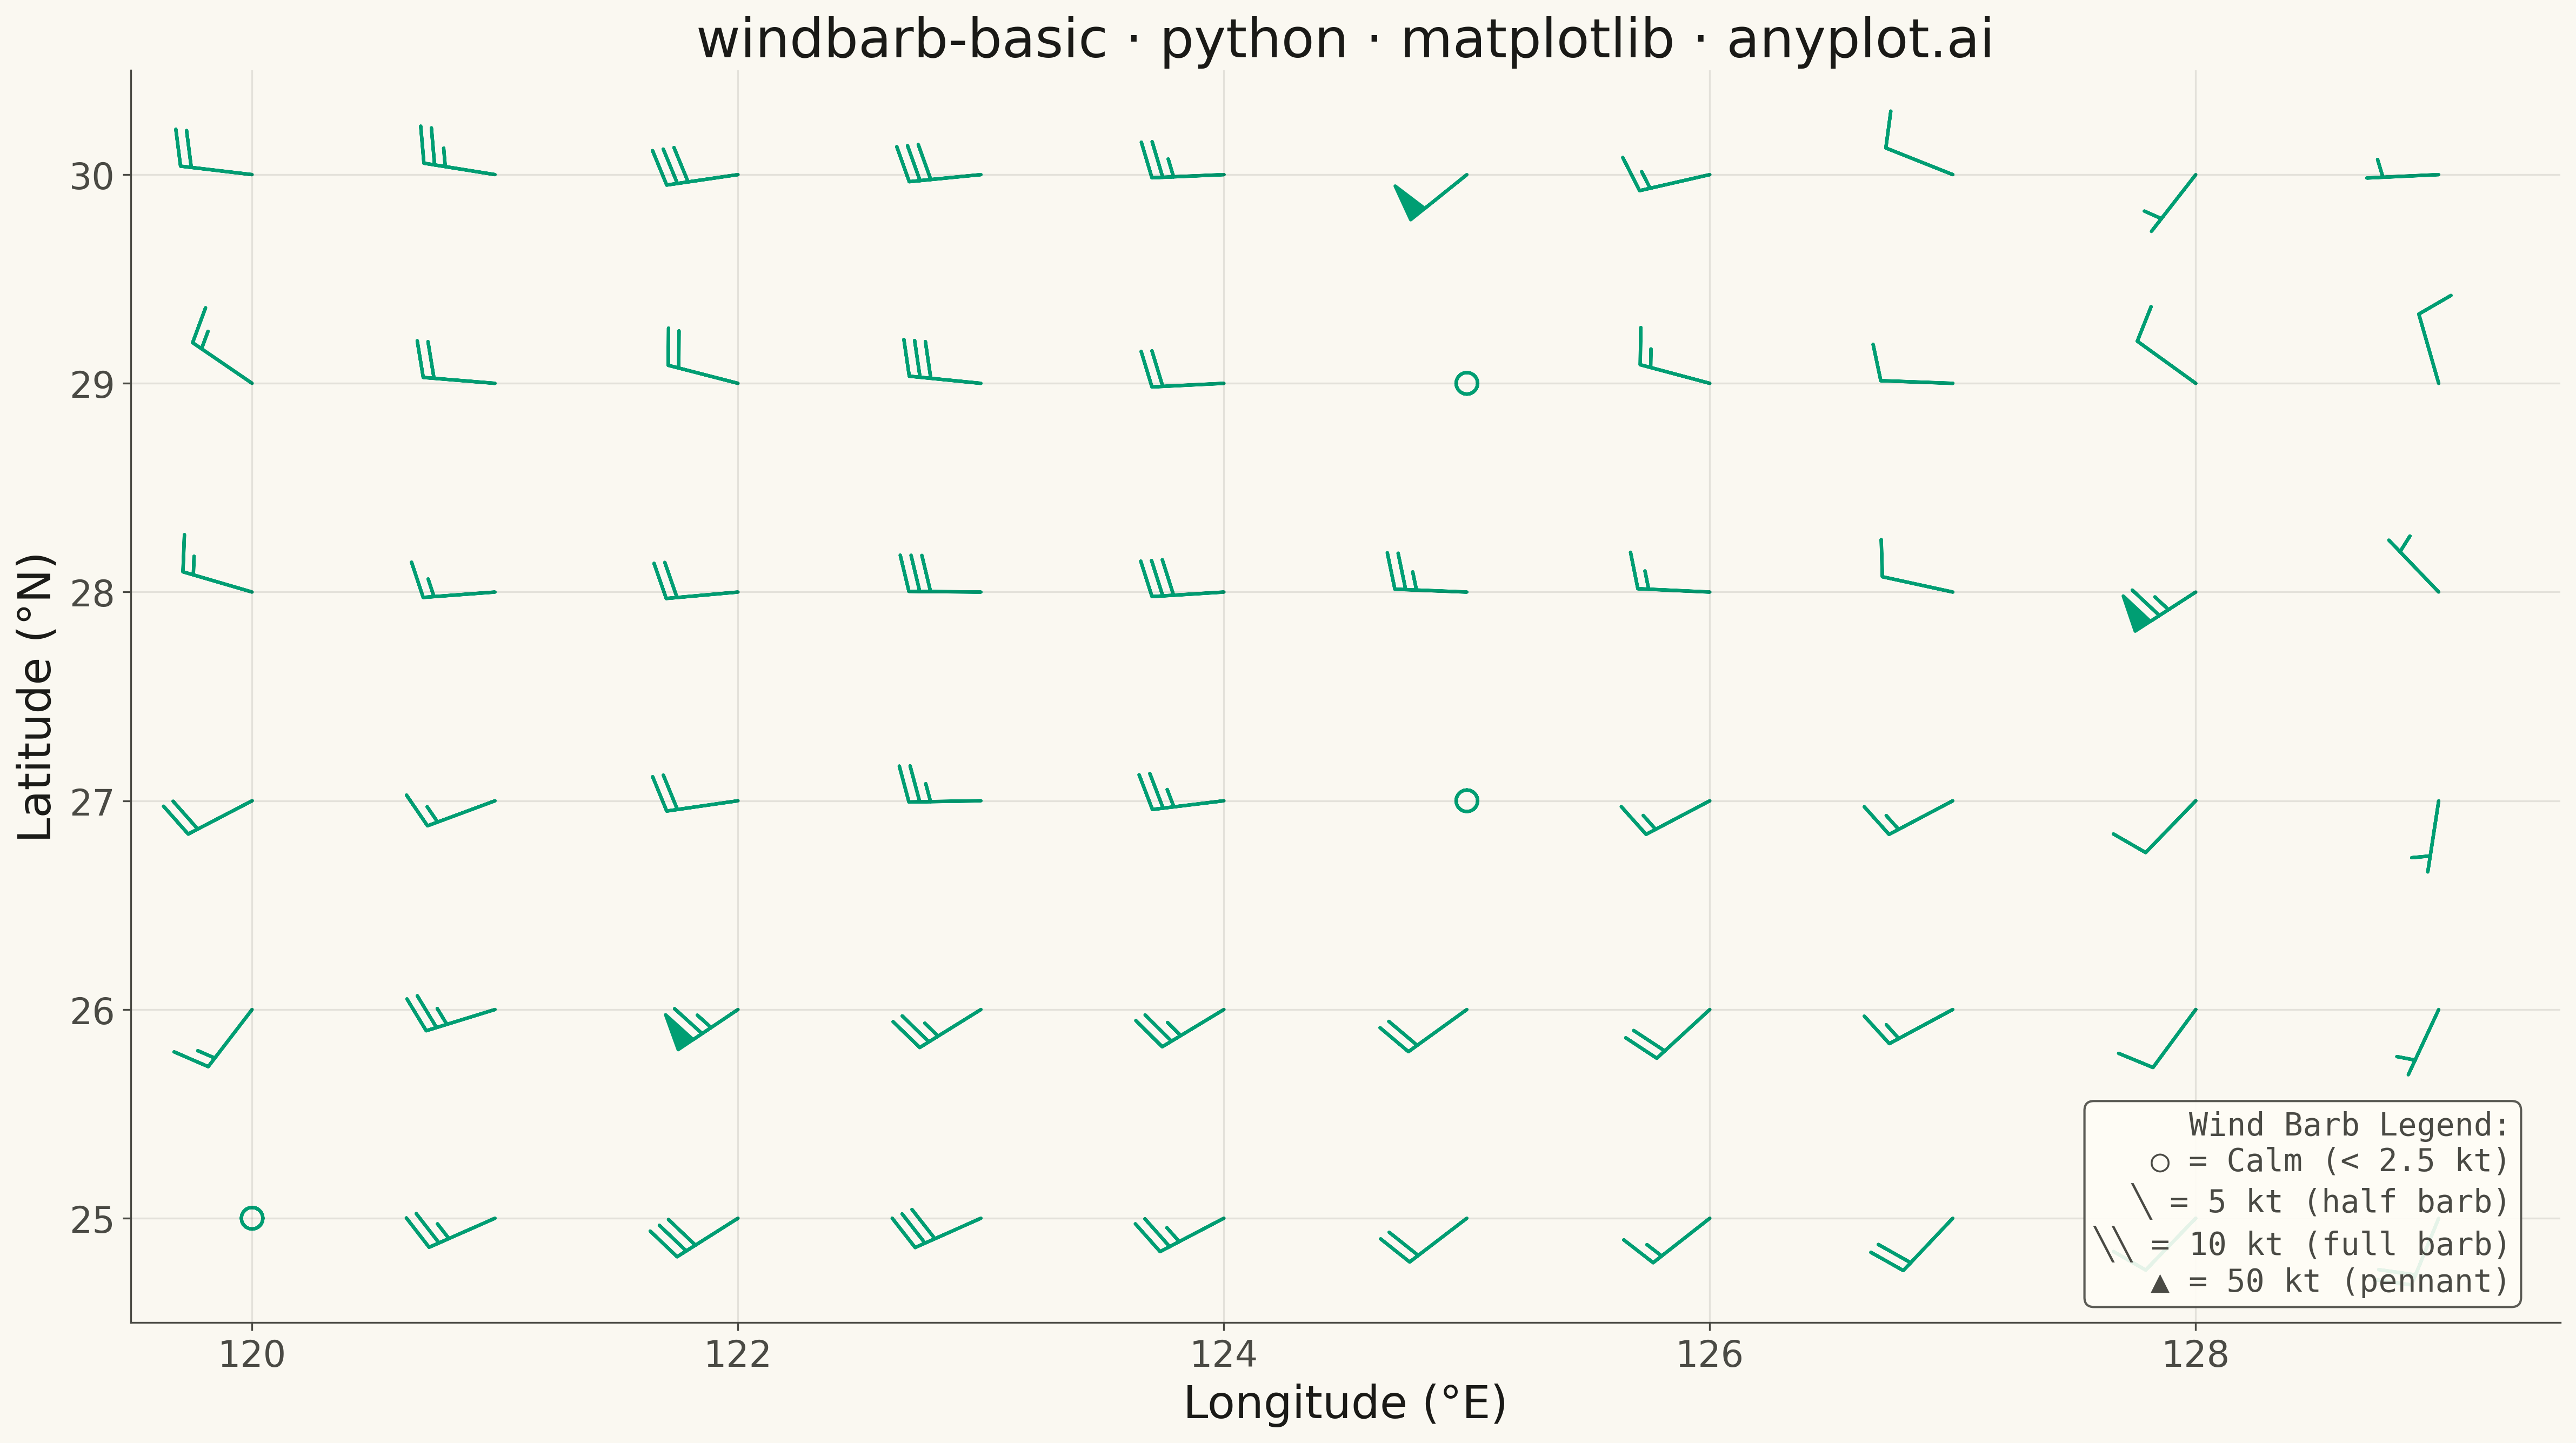
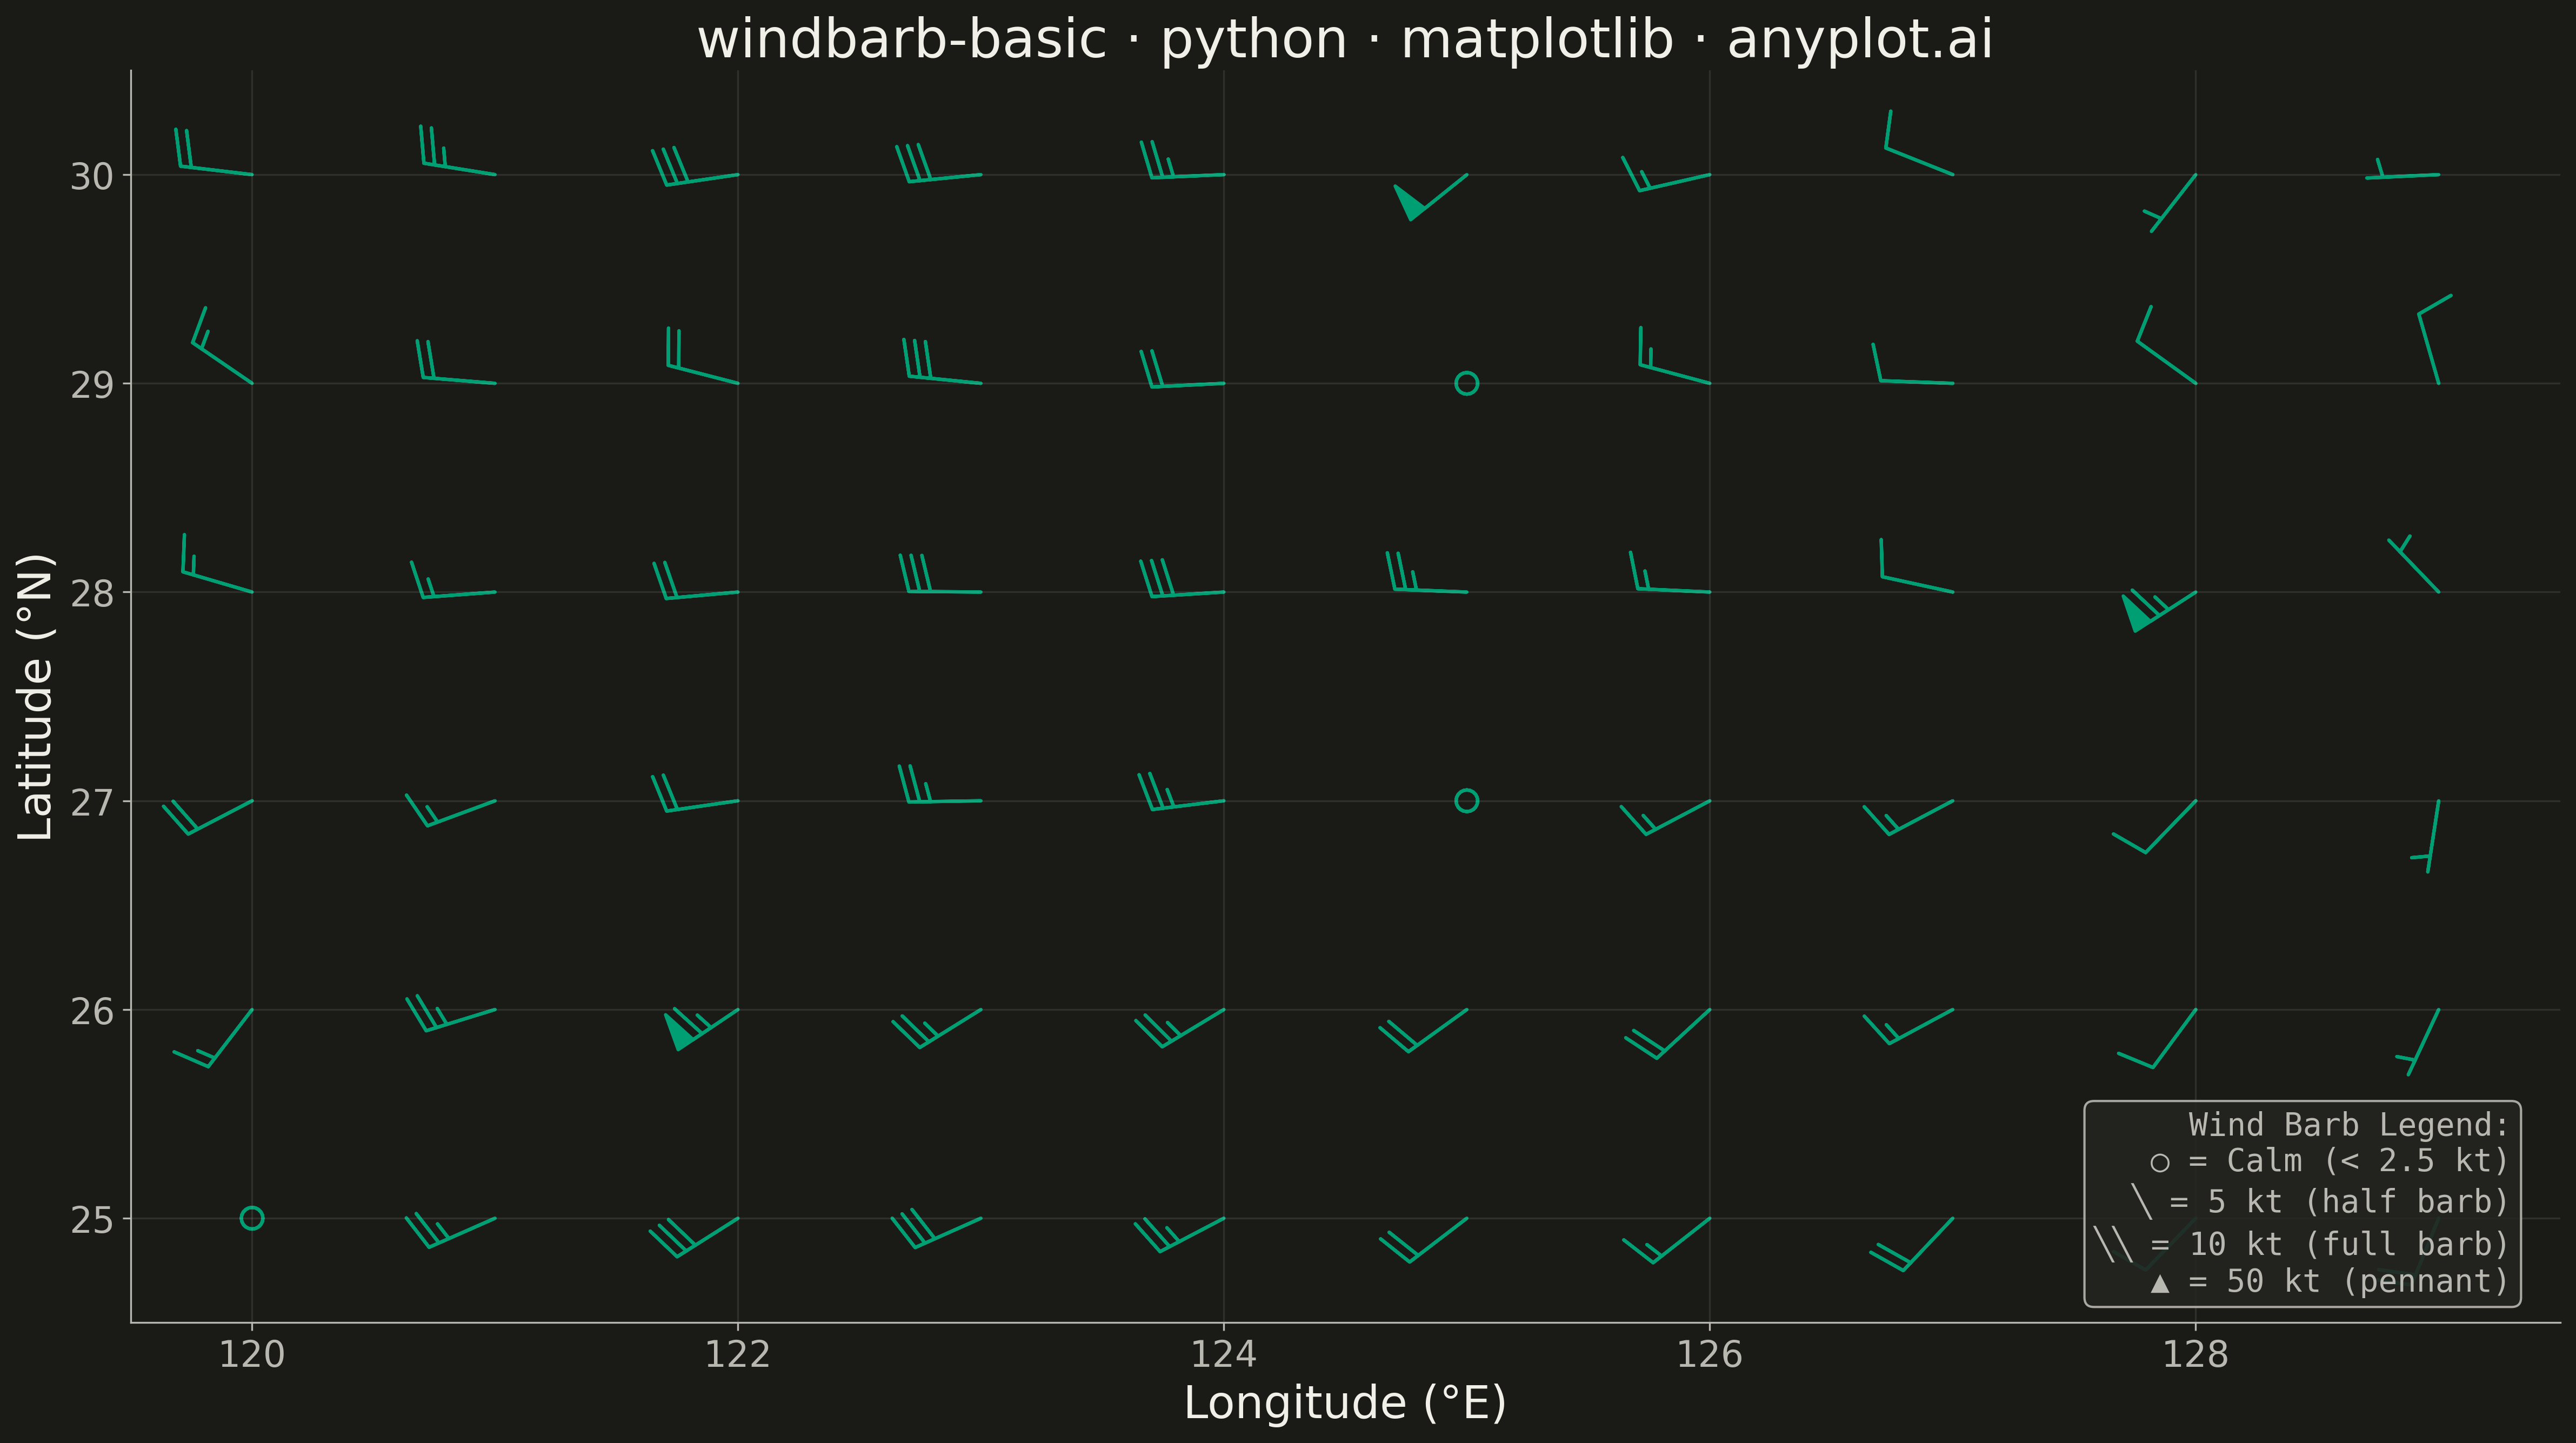
A wind barb plot displays wind speed and direction at specific locations using standard meteorological barb notation. Each barb consists of a staff pointing in the direction from which the wind blows, with short barbs (5 knots), long barbs (10 knots), and triangular pennants (50 knots) attached to indicate speed. This internationally recognized symbology enables rapid interpretation of wind patterns across weather maps and atmospheric data visualizations.
""" anyplot.ai
windbarb-basic: Wind Barb Plot for Meteorological Data
Library: matplotlib 3.10.9 | Python 3.13.13
Quality: 88/100 | Updated: 2026-05-19
"""

import os

import matplotlib.pyplot as plt
import numpy as np


# Theme tokens
THEME = os.getenv("ANYPLOT_THEME", "light")
PAGE_BG = "#FAF8F1" if THEME == "light" else "#1A1A17"
ELEVATED_BG = "#FFFDF6" if THEME == "light" else "#242420"
INK = "#1A1A17" if THEME == "light" else "#F0EFE8"
INK_SOFT = "#4A4A44" if THEME == "light" else "#B8B7B0"
BRAND = "#009E73"  # Okabe-Ito position 1

# Data - Surface wind observations from western Pacific weather station network
np.random.seed(42)

# Grid of observation points: 10 longitude × 6 latitude (120–129°E, 25–30°N)
lon = np.arange(120, 130, 1)
lat = np.arange(25, 31, 1)
LON, LAT = np.meshgrid(lon, lat)
LON = LON.flatten()
LAT = LAT.flatten()

# Generate wind components (u: east-west, v: north-south) in knots
# Realistic mid-latitude westerly pattern with spatial coherence
base_u = 15 + 10 * np.sin((LON - 120) * 0.5)
base_v = 5 + 8 * np.cos((LAT - 25) * 0.8)
U = base_u + np.random.uniform(-5, 5, size=LON.shape)
V = base_v + np.random.uniform(-5, 5, size=LAT.shape)

# Include calm winds (< 2.5 knots)
calm_indices = [0, 25, 45]
U[calm_indices] = np.random.uniform(-1, 1, size=len(calm_indices))
V[calm_indices] = np.random.uniform(-1, 1, size=len(calm_indices))

# Include strong winds with pennants (50+ knots)
strong_indices = [12, 38, 55]
U[strong_indices] = 40 + np.random.uniform(0, 15, size=len(strong_indices))
V[strong_indices] = 30 + np.random.uniform(0, 10, size=len(strong_indices))

# Plot
fig, ax = plt.subplots(figsize=(16, 9), facecolor=PAGE_BG)
ax.set_facecolor(PAGE_BG)

ax.barbs(
    LON,
    LAT,
    U,
    V,
    length=8,
    barb_increments={"half": 5, "full": 10, "flag": 50},
    color=BRAND,
    linewidth=1.5,
    sizes={"emptybarb": 0.15, "spacing": 0.15, "height": 0.5},
)

# Style
ax.set_xlabel("Longitude (°E)", fontsize=20, color=INK)
ax.set_ylabel("Latitude (°N)", fontsize=20, color=INK)
ax.set_title("windbarb-basic · python · matplotlib · anyplot.ai", fontsize=24, fontweight="medium", color=INK)
ax.tick_params(axis="both", labelsize=16, colors=INK_SOFT)
for spine in ("left", "bottom"):
    ax.spines[spine].set_color(INK_SOFT)
ax.spines["top"].set_visible(False)
ax.spines["right"].set_visible(False)
ax.grid(True, alpha=0.10, linewidth=0.8, color=INK)

ax.set_xlim(119.5, 129.5)
ax.set_ylim(24.5, 30.5)

# Barb notation legend — placed in bottom-right to avoid overlapping barbs
legend_text = (
    "Wind Barb Legend:\n○ = Calm (< 2.5 kt)\n╲ = 5 kt (half barb)\n╲╲ = 10 kt (full barb)\n▲ = 50 kt (pennant)"
)
ax.text(
    0.98,
    0.02,
    legend_text,
    transform=ax.transAxes,
    fontsize=14,
    verticalalignment="bottom",
    horizontalalignment="right",
    fontfamily="monospace",
    color=INK_SOFT,
    bbox={"boxstyle": "round", "facecolor": ELEVATED_BG, "alpha": 0.9, "edgecolor": INK_SOFT},
)

# Save
plt.tight_layout()
plt.savefig(f"plot-{THEME}.png", dpi=300, bbox_inches="tight", facecolor=PAGE_BG)
Runnable source as JSON, for any HTTP client: https://api.anyplot.ai/specs/windbarb-basic/matplotlib/code. Any spec id and library id listed in llms-full.txt fit the same URL shape; every URL below is complete and callable.
{
  "spec_id": "windbarb-basic",
  "language": "python",
  "library": "matplotlib",
  "page": "https://anyplot.ai/windbarb-basic/python/matplotlib",
  "hub": "https://anyplot.ai/windbarb-basic",
  "code_json": "https://api.anyplot.ai/specs/windbarb-basic/matplotlib/code",
  "spec_json": "https://api.anyplot.ai/specs/windbarb-basic",
  "render_light_png": "https://storage.googleapis.com/anyplot-images/plots/windbarb-basic/python/matplotlib/plot-light.png",
  "render_dark_png": "https://storage.googleapis.com/anyplot-images/plots/windbarb-basic/python/matplotlib/plot-dark.png",
  "quality_score": 88.0,
  "license": "MIT",
  "guide": "https://anyplot.ai/llms.txt"
}
Part of Wind Barb Plot for Meteorological Data on anyplot.ai.