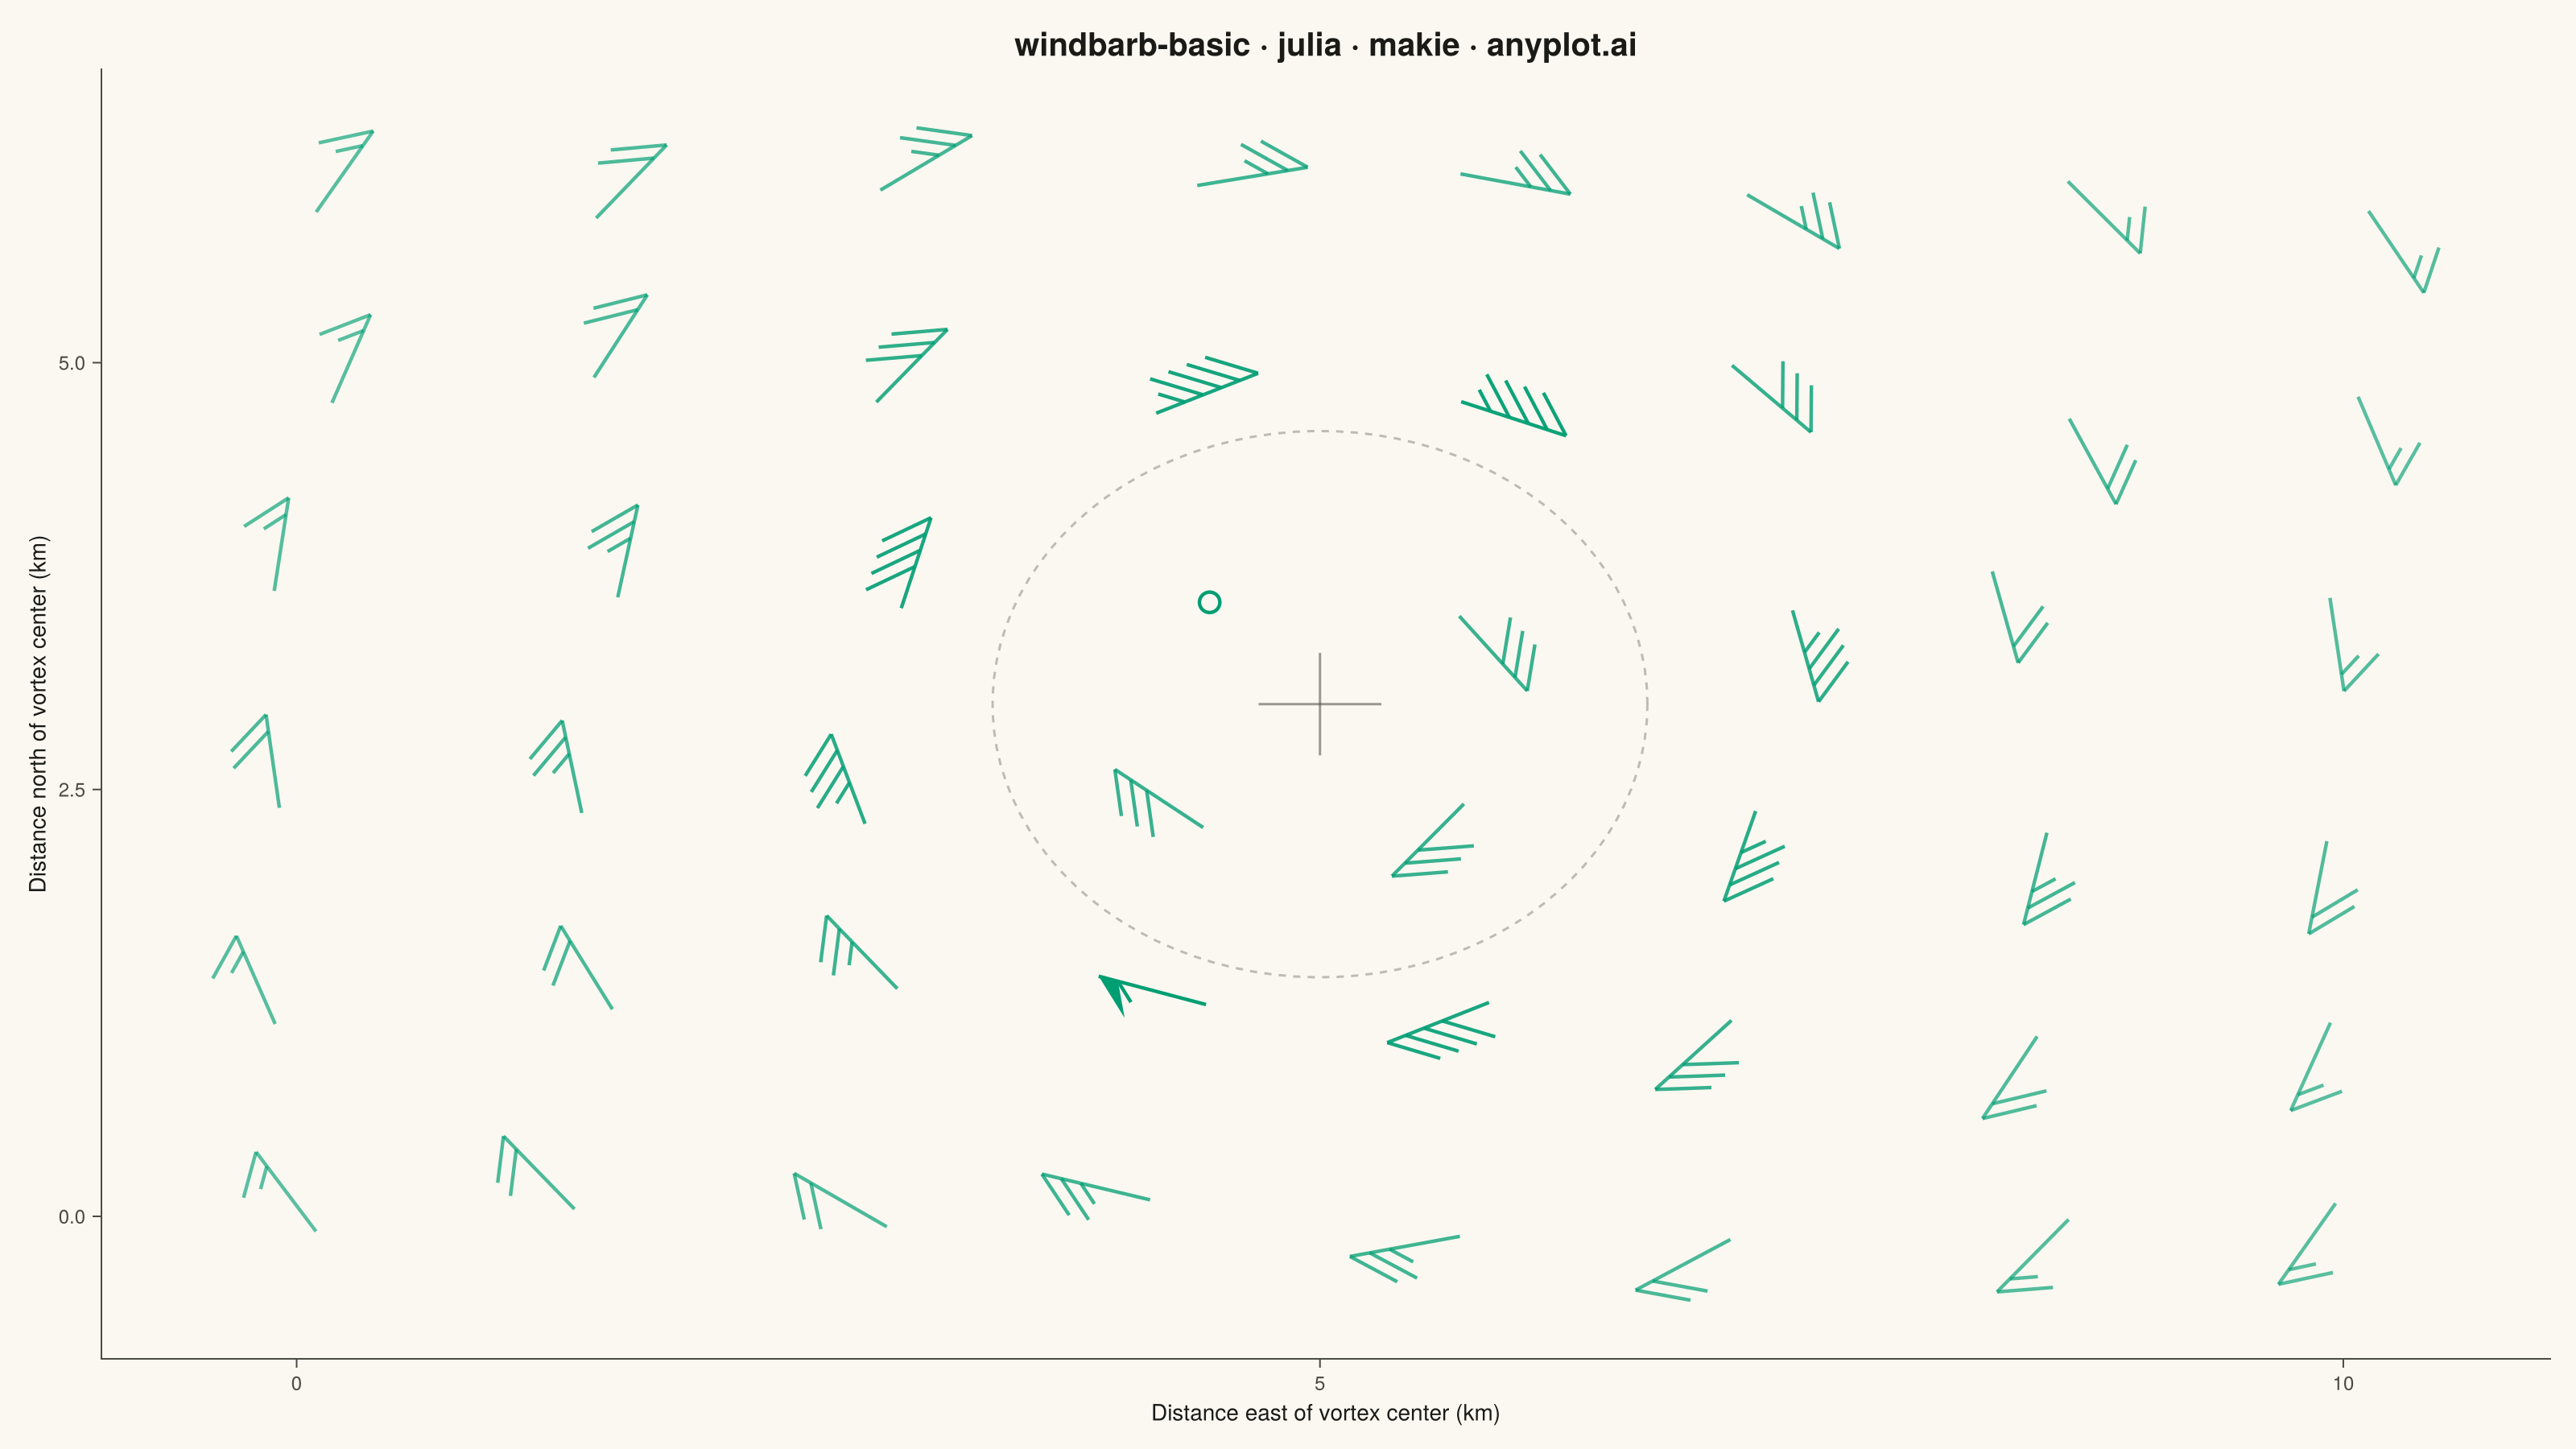
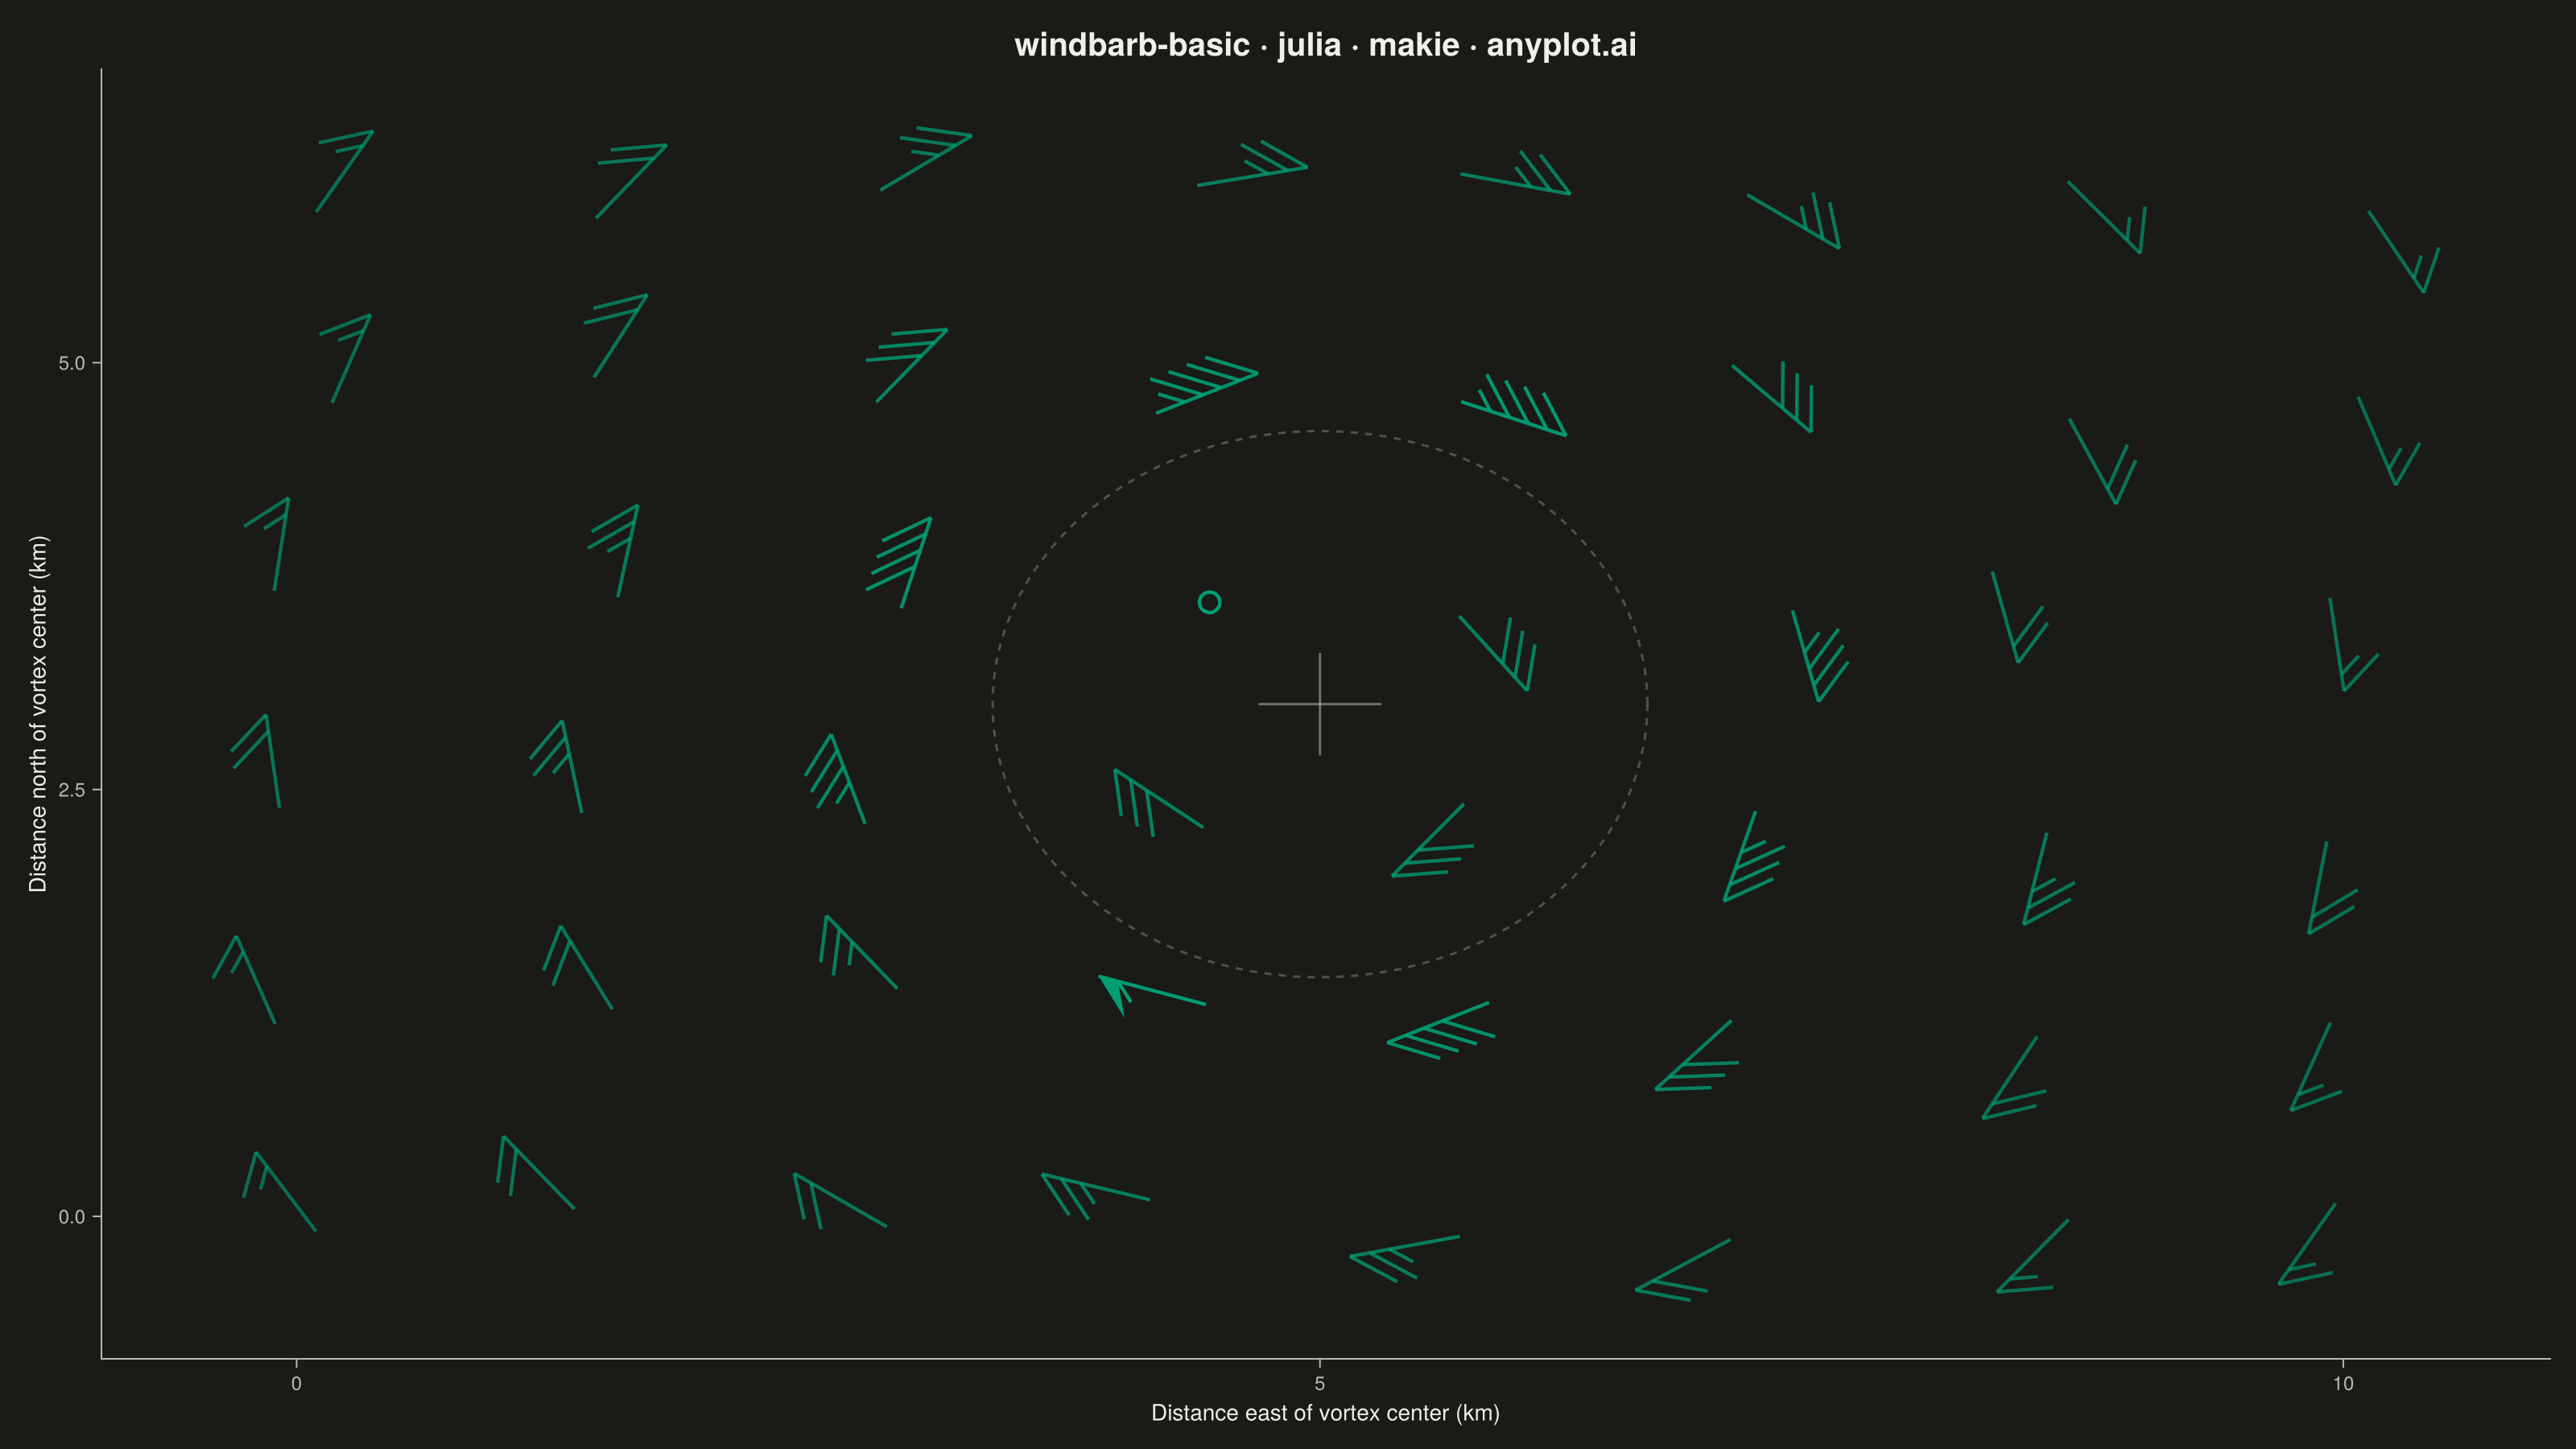
The same plot in 14 other libraries — Python: Altair, Bokeh, lets-plot, Matplotlib, Plotly, plotnine, Pygal, Seaborn; R: ggplot2; JavaScript: Chart.js, D3.js, Apache ECharts, Highcharts, MUI X Charts. Compare all 15 side by side: Wind Barb Plot for Meteorological Data in Python, R, Julia and JavaScript.
A wind barb plot displays wind speed and direction at specific locations using standard meteorological barb notation. Each barb consists of a staff pointing in the direction from which the wind blows, with short barbs (5 knots), long barbs (10 knots), and triangular pennants (50 knots) attached to indicate speed. This internationally recognized symbology enables rapid interpretation of wind patterns across weather maps and atmospheric data visualizations.
# anyplot.ai
# windbarb-basic: Wind Barb Plot for Meteorological Data
# Library: makie 0.21.9 | Julia 1.11.9
# Quality: 90/100 | Created: 2026-09-02

using CairoMakie
using Colors
using Random

Random.seed!(42)

# --- Theme tokens (see prompts/default-style-guide.md "Theme-adaptive Chrome")
const THEME    = get(ENV, "ANYPLOT_THEME", "light")
const PAGE_BG  = THEME == "light" ? colorant"#FAF8F1" : colorant"#1A1A17"
const INK      = THEME == "light" ? colorant"#1A1A17" : colorant"#F0EFE8"
const INK_SOFT = THEME == "light" ? colorant"#4A4A44" : colorant"#B8B7B0"
const BRAND    = colorant"#009E73"  # Imprint palette position 1 — always first series

# --- Data: surface wind observations on a grid around a local vortex ---------
# Domain and radius are mesocyclone-scale (~km), not a synoptic low.
station_x = Float64[]
station_y = Float64[]
for grid_x in range(0.0, 10.0; length = 8), grid_y in range(0.0, 6.0; length = 6)
    push!(station_x, grid_x + 0.12 * randn())
    push!(station_y, grid_y + 0.10 * randn())
end

center_x, center_y = 5.0, 3.0
radius_max, speed_max = 1.6, 52.0  # Rankine-vortex radius / peak tangential speed (knots)

wind_u = Float64[]
wind_v = Float64[]
for i in eachindex(station_x)
    dx = station_x[i] - center_x
    dy = station_y[i] - center_y
    r  = hypot(dx, dy) + 1e-6
    tangent_x, tangent_y = -dy / r, dx / r  # cyclonic (counterclockwise) circulation
    speed = r <= radius_max ? speed_max * (r / radius_max) : speed_max * (radius_max / r)
    speed = max(speed + 1.5 * randn(), 0.0)
    push!(wind_u, speed * tangent_x)
    push!(wind_v, speed * tangent_y)
end

# Guarantee the full barb vocabulary is on display: the station nearest the
# eye reads as calm, and the station nearest the peak-wind ring reads gale-force.
station_radius = hypot.(station_x .- center_x, station_y .- center_y)
eye_index = argmin(station_radius)
wind_u[eye_index], wind_v[eye_index] = 0.6, -0.4
gale_index = argmin(abs.(station_radius .- radius_max))
gale_scale = 55.0 / hypot(wind_u[gale_index], wind_v[gale_index])
wind_u[gale_index] *= gale_scale
wind_v[gale_index] *= gale_scale

# --- Wind barb geometry (staff, feathers, pennants, calm circles) -----------
staff_len    = 0.55
full_len     = staff_len * 0.5
half_len     = full_len * 0.5
tick_spacing = staff_len * 0.18
barb_offset  = 3π / 4  # feather angle relative to the staff — back and to the left

staff_points  = Point2f[]
staff_colors  = RGBAf[]
barb_points   = Point2f[]
barb_colors   = RGBAf[]
pennant_polys = Vector{Point2f}[]
pennant_colors = RGBAf[]
calm_x        = Float64[]
calm_y        = Float64[]

# Speed-keyed alpha: stronger stations render more opaque, weaker ones more
# translucent, giving the swirl a visible intensity gradient without adding
# a second data hue.
barb_alpha(speed) = clamp(0.5 + 0.5 * (speed / speed_max), 0.5, 1.0)
brand_alpha(alpha) = RGBAf(BRAND.r, BRAND.g, BRAND.b, alpha)

for i in eachindex(station_x)
    speed = hypot(wind_u[i], wind_v[i])
    x0, y0 = station_x[i], station_y[i]

    if speed < 2.5
        push!(calm_x, x0)
        push!(calm_y, y0)
        continue
    end

    station_color = brand_alpha(barb_alpha(speed))

    heading = atan(-wind_v[i], -wind_u[i])  # staff points FROM which the wind blows
    tip_x = x0 + staff_len * cos(heading)
    tip_y = y0 + staff_len * sin(heading)
    push!(staff_points, Point2f(x0, y0), Point2f(tip_x, tip_y))
    push!(staff_colors, station_color, station_color)

    rounded_int = round(Int, speed / 5) * 5
    n_pennants  = rounded_int ÷ 50
    remainder1  = rounded_int % 50
    n_full      = remainder1 ÷ 10
    remainder2  = remainder1 % 10
    n_half      = remainder2 >= 5 ? 1 : 0

    step = 0
    for _ in 1:n_pennants
        base_x = tip_x - step * tick_spacing * cos(heading)
        base_y = tip_y - step * tick_spacing * sin(heading)
        far_x  = tip_x - (step + 1) * tick_spacing * cos(heading)
        far_y  = tip_y - (step + 1) * tick_spacing * sin(heading)
        apex_x = base_x + full_len * cos(heading + barb_offset)
        apex_y = base_y + full_len * sin(heading + barb_offset)
        push!(pennant_polys, [Point2f(base_x, base_y), Point2f(far_x, far_y), Point2f(apex_x, apex_y)])
        push!(pennant_colors, station_color)
        step += 1
    end
    for _ in 1:n_full
        base_x = tip_x - step * tick_spacing * cos(heading)
        base_y = tip_y - step * tick_spacing * sin(heading)
        end_x  = base_x + full_len * cos(heading + barb_offset)
        end_y  = base_y + full_len * sin(heading + barb_offset)
        push!(barb_points, Point2f(base_x, base_y), Point2f(end_x, end_y))
        push!(barb_colors, station_color, station_color)
        step += 1
    end
    for _ in 1:n_half
        base_x = tip_x - step * tick_spacing * cos(heading)
        base_y = tip_y - step * tick_spacing * sin(heading)
        end_x  = base_x + half_len * cos(heading + barb_offset)
        end_y  = base_y + half_len * sin(heading + barb_offset)
        push!(barb_points, Point2f(base_x, base_y), Point2f(end_x, end_y))
        push!(barb_colors, station_color, station_color)
        step += 1
    end
end

# --- Plot ---------------------------------------------------------------------
fig = Figure(resolution = (1600, 900), fontsize = 14, backgroundcolor = PAGE_BG)

ax = Axis(
    fig[1, 1];
    title              = "windbarb-basic · julia · makie · anyplot.ai",
    titlesize          = 20,
    titlecolor         = INK,
    xlabel             = "Distance east of vortex center (km)",
    ylabel             = "Distance north of vortex center (km)",
    xlabelsize         = 14,
    ylabelsize         = 14,
    xlabelcolor        = INK,
    ylabelcolor        = INK,
    xticklabelsize     = 12,
    yticklabelsize     = 12,
    xticklabelcolor    = INK_SOFT,
    yticklabelcolor    = INK_SOFT,
    xtickcolor         = INK_SOFT,
    ytickcolor         = INK_SOFT,
    backgroundcolor    = PAGE_BG,
    topspinevisible    = false,
    rightspinevisible  = false,
    leftspinecolor     = INK_SOFT,
    bottomspinecolor   = INK_SOFT,
    xgridvisible       = false,
    ygridvisible       = false,
)

# Faint, non-data reference ring + crosshair anchoring the vortex center so
# the cyclonic swirl reads immediately instead of requiring inference from
# barb orientation alone (chrome ink, not a second data hue).
ring_theta = range(0, 2π; length = 100)
lines!(ax, center_x .+ radius_max .* cos.(ring_theta), center_y .+ radius_max .* sin.(ring_theta);
       color = INK_SOFT, linestyle = :dash, linewidth = 1.5, alpha = 0.35)
cross_len = 0.3
linesegments!(ax, [Point2f(center_x - cross_len, center_y), Point2f(center_x + cross_len, center_y),
                    Point2f(center_x, center_y - cross_len), Point2f(center_x, center_y + cross_len)];
              color = INK_SOFT, linewidth = 1.5, alpha = 0.55)

linesegments!(ax, staff_points; color = staff_colors, linewidth = 2.2)
linesegments!(ax, barb_points; color = barb_colors, linewidth = 2.2)
if !isempty(pennant_polys)
    poly!(ax, pennant_polys; color = pennant_colors, strokewidth = 0)
end
if !isempty(calm_x)
    scatter!(ax, calm_x, calm_y; marker = :circle, markersize = 18,
             color = :transparent, strokecolor = BRAND, strokewidth = 2.2)
end

# --- Save -----------------------------------------------------------------
save("plot-$(THEME).png", fig; px_per_unit = 2)
Runnable source as JSON, for any HTTP client: https://api.anyplot.ai/specs/windbarb-basic/makie/code. Any spec id and library id listed in llms-full.txt fit the same URL shape; every URL below is complete and callable.
{
  "spec_id": "windbarb-basic",
  "language": "julia",
  "library": "makie",
  "page": "https://anyplot.ai/windbarb-basic/julia/makie",
  "hub": "https://anyplot.ai/windbarb-basic",
  "code_json": "https://api.anyplot.ai/specs/windbarb-basic/makie/code",
  "spec_json": "https://api.anyplot.ai/specs/windbarb-basic",
  "render_light_png": "https://storage.googleapis.com/anyplot-images/plots/windbarb-basic/julia/makie/plot-light.png",
  "render_dark_png": "https://storage.googleapis.com/anyplot-images/plots/windbarb-basic/julia/makie/plot-dark.png",
  "quality_score": 90.0,
  "license": "MIT",
  "guide": "https://anyplot.ai/llms.txt"
}
Part of Wind Barb Plot for Meteorological Data on anyplot.ai.