The same plot in 14 other libraries — JavaScript: Chart.js, Apache ECharts, Highcharts, MUI X Charts; Python: Altair, Bokeh, lets-plot, Matplotlib, Plotly, plotnine, Pygal, Seaborn; R: ggplot2; Julia: Makie.jl. Compare all 15 side by side: Wind Barb Plot for Meteorological Data in Python, R, Julia and JavaScript.
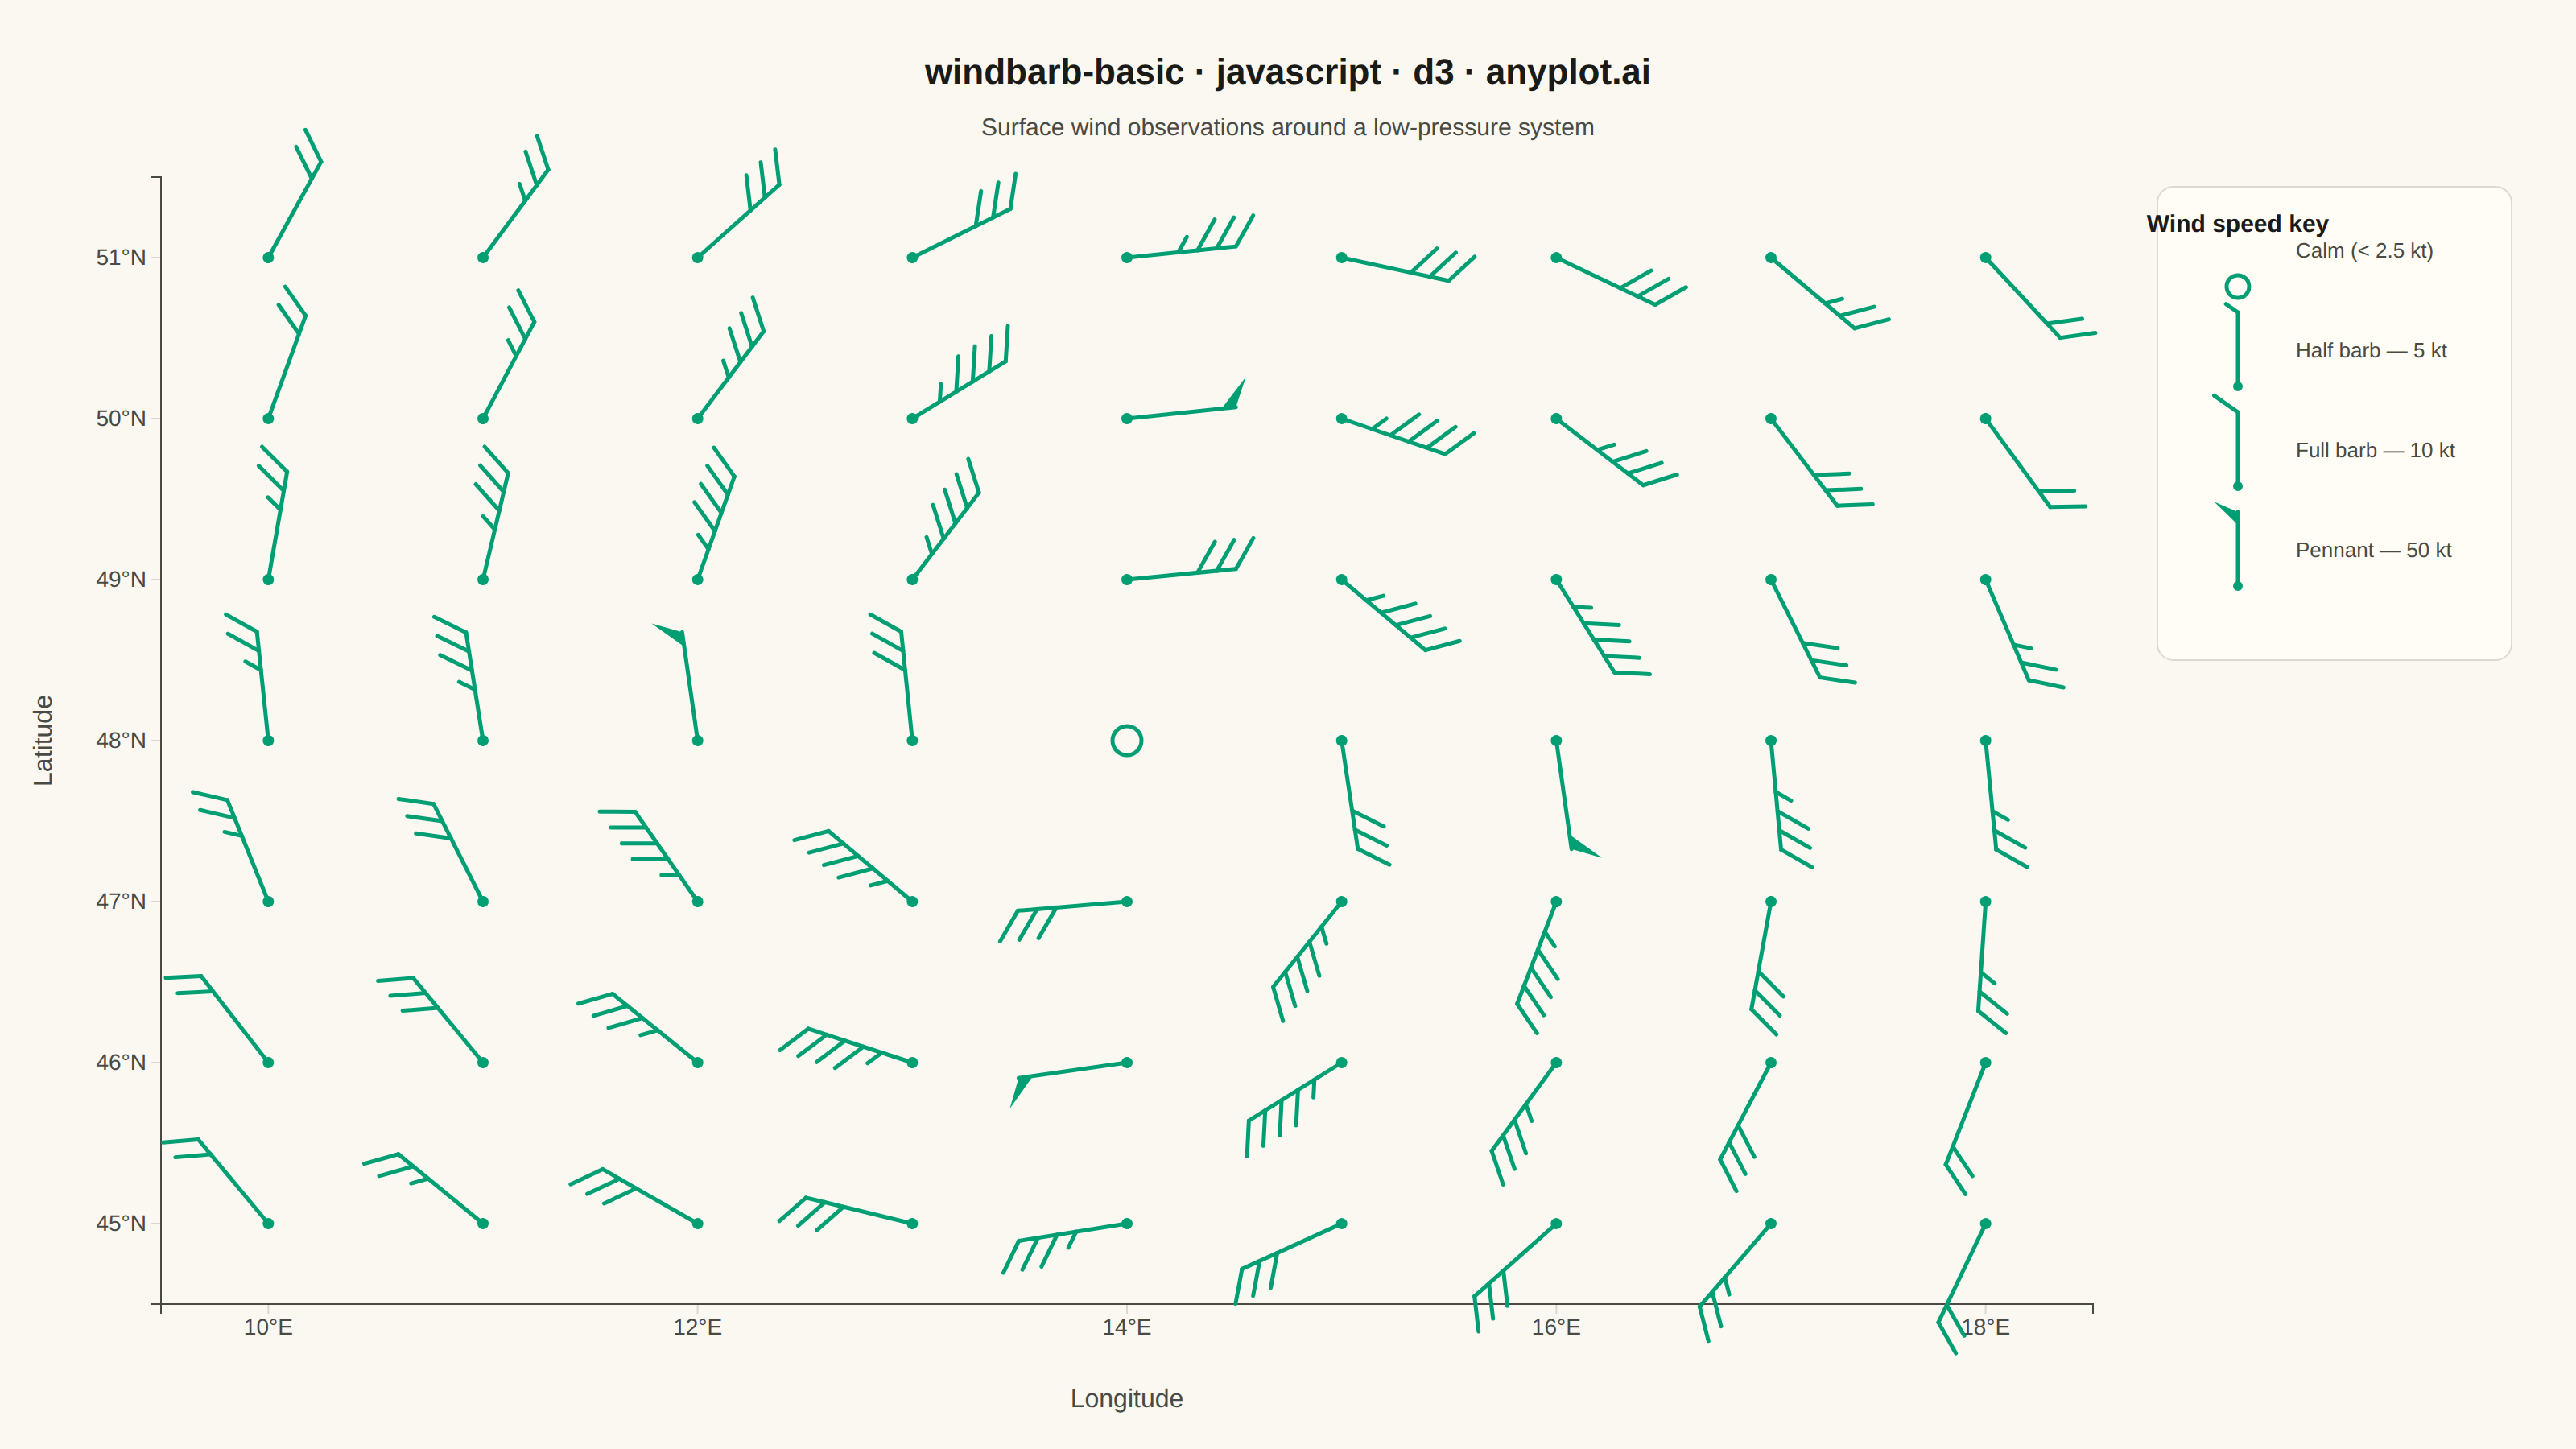
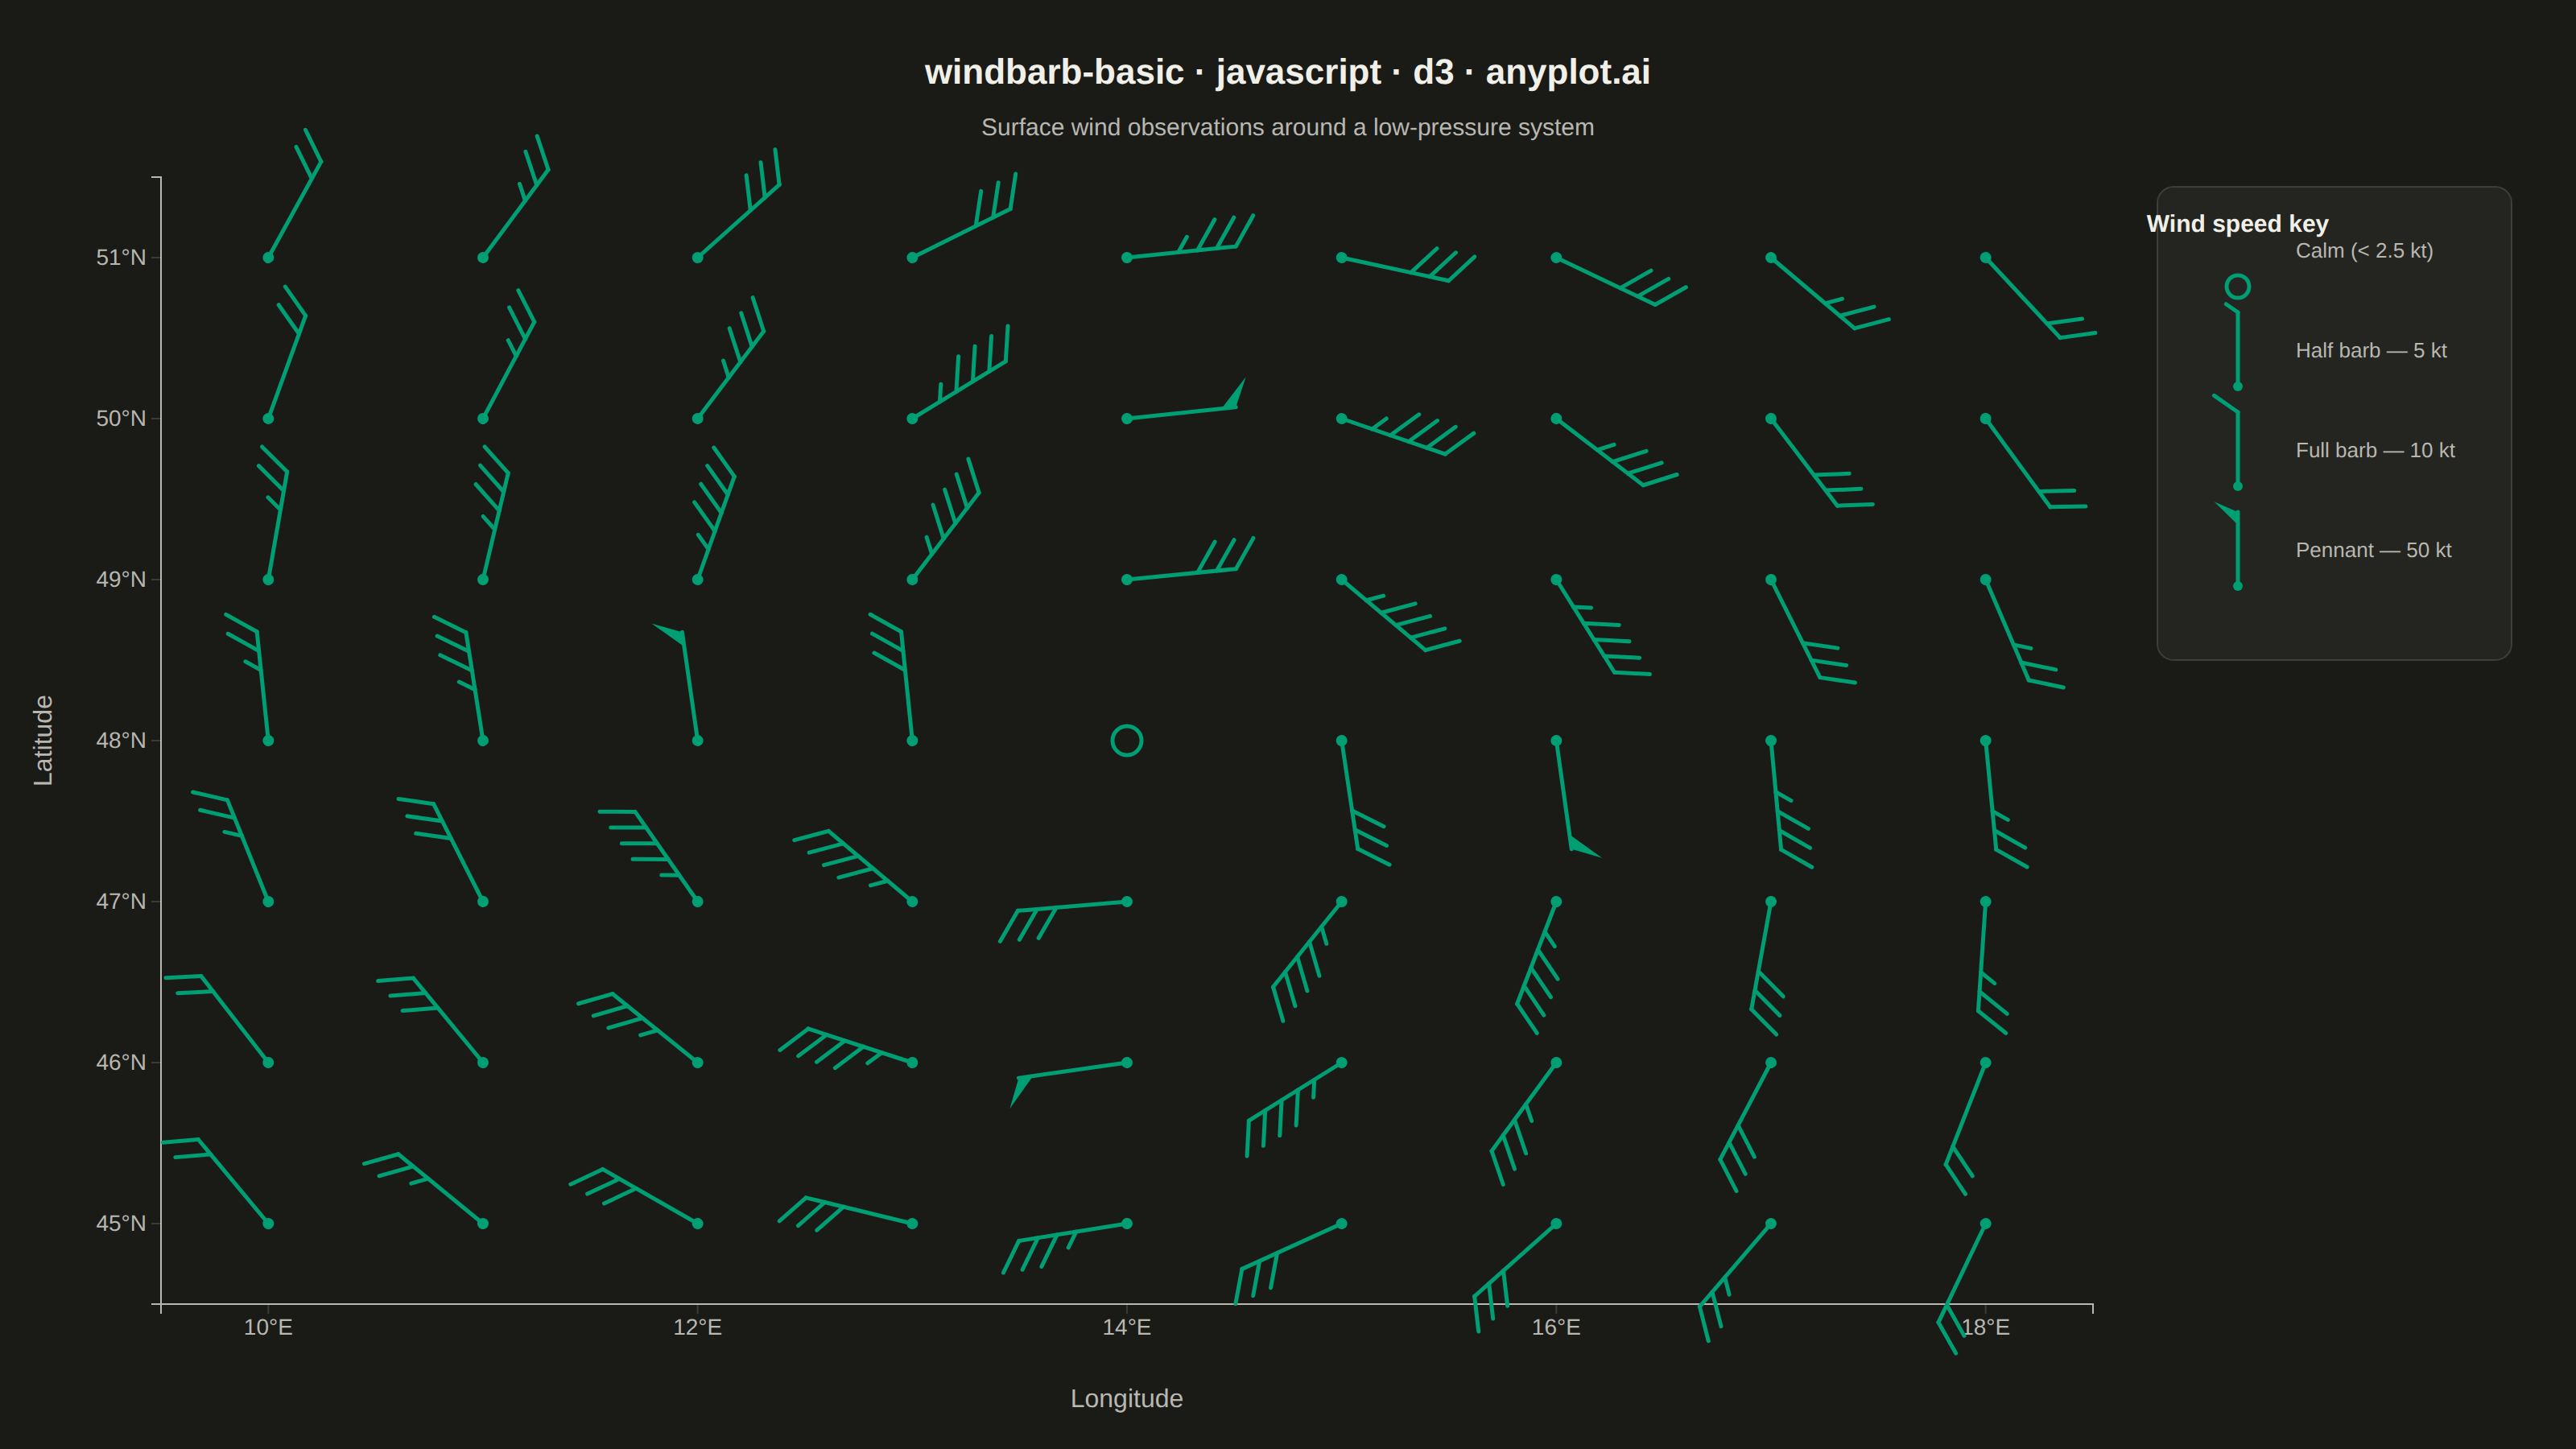
A wind barb plot displays wind speed and direction at specific locations using standard meteorological barb notation. Each barb consists of a staff pointing in the direction from which the wind blows, with short barbs (5 knots), long barbs (10 knots), and triangular pennants (50 knots) attached to indicate speed. This internationally recognized symbology enables rapid interpretation of wind patterns across weather maps and atmospheric data visualizations.
// anyplot.ai
// windbarb-basic: Wind Barb Plot for Meteorological Data
// Library: d3 7.9.0 | JavaScript 22.23.2
// Quality: 85/100 | Created: 2026-09-02

const t = window.ANYPLOT_TOKENS;
const { width, height } = window.ANYPLOT_SIZE;

// --- Deterministic PRNG (LCG) ------------------------------------------------
let seed = 42;
function lcg() {
  seed = (seed * 1664525 + 1013904223) % 4294967296;
  return seed / 4294967296;
}

// --- Data: surface wind observations around a synthetic low-pressure center -
// A Rankine combined vortex — solid-body rotation inside the core radius,
// irrotational decay outside — gives a realistic cyclonic wind field: calm at
// the exact center, peak speed at the core edge, and tapering outward.
const NX = 9;
const NY = 7;
const CENTER_I = 4;
const CENTER_J = 3;
const CORE_RADIUS = 1.8; // grid units
const PEAK_SPEED = 55; // knots, tangential speed at the core radius

const stations = [];
for (let j = 0; j < NY; j++) {
  for (let i = 0; i < NX; i++) {
    const dx = i - CENTER_I;
    const dy = j - CENTER_J;
    const r = Math.sqrt(dx * dx + dy * dy);
    const vTan = r <= CORE_RADIUS ? PEAK_SPEED * (r / CORE_RADIUS) : PEAK_SPEED * (CORE_RADIUS / r);
    const vRad = -0.12 * vTan; // mild inflow toward the low
    let u = 0; // eastward component (knots)
    let v = 0; // northward component (knots)
    if (r > 1e-9) {
      u = vTan * (-dy / r) + vRad * (dx / r);
      v = vTan * (dx / r) + vRad * (dy / r);
      u += (lcg() - 0.5) * 3;
      v += (lcg() - 0.5) * 3;
    }
    stations.push({ lon: 10 + i, lat: 45 + j, u, v });
  }
}

// --- Layout -------------------------------------------------------------
const margin = { top: 110, right: 300, bottom: 90, left: 100 };
const iw = width - margin.left - margin.right;
const ih = height - margin.top - margin.bottom;

const xScale = d3.scaleLinear().domain([9.5, 18.5]).range([0, iw]);
const yScale = d3.scaleLinear().domain([44.5, 51.5]).range([ih, 0]);

const svg = d3.select("#container").append("svg").attr("width", width).attr("height", height);
const g = svg.append("g").attr("transform", `translate(${margin.left},${margin.top})`);

// --- Axes -----------------------------------------------------------------
const xAxis = g
  .append("g")
  .attr("transform", `translate(0,${ih})`)
  .call(
    d3
      .axisBottom(xScale)
      .tickValues(d3.range(10, 19, 2))
      .tickFormat((d) => `${d}°E`)
  );
const yAxis = g.append("g").call(
  d3
    .axisLeft(yScale)
    .tickValues(d3.range(45, 52, 1))
    .tickFormat((d) => `${d}°N`)
);
for (const axis of [xAxis, yAxis]) {
  axis.selectAll("text").attr("fill", t.inkSoft).style("font-size", "14px");
  axis.selectAll("line").attr("stroke", t.grid);
  axis.select(".domain").attr("stroke", t.inkSoft);
}

g.append("text")
  .attr("x", iw / 2)
  .attr("y", ih + 64)
  .attr("text-anchor", "middle")
  .attr("fill", t.inkSoft)
  .style("font-size", "16px")
  .text("Longitude");

g.append("text")
  .attr("x", -ih / 2)
  .attr("y", -68)
  .attr("transform", "rotate(-90)")
  .attr("text-anchor", "middle")
  .attr("fill", t.inkSoft)
  .style("font-size", "16px")
  .text("Latitude");

// --- Wind barb glyph ---------------------------------------------------------
// Meteorological convention: the staff points toward the direction FROM which
// the wind blows; barbs/pennants sit on the left side of the staff (Northern
// Hemisphere) and are read outer-tip-inward as 50 kt (pennant), 10 kt (full
// barb), 5 kt (half barb). Calm winds (< 2.5 kt) draw as an open circle.
const CALM_KNOTS = 2.5;
const BARB_ANGLE = (55 * Math.PI) / 180; // tilt of each barb off the staff

function barbTip(len) {
  return [-len * Math.sin(BARB_ANGLE), -len * Math.cos(BARB_ANGLE)];
}

// Draws one barb (dot + staff + speed notation) into `parent`, already
// translated to the station's screen position. `u`/`v` are eastward/northward
// wind components in knots; sizes scale the staff/barb/pennant geometry so the
// same routine renders both the map glyphs and the compact legend key.
function drawBarb(parent, u, v, sizes) {
  const speed = Math.sqrt(u * u + v * v);

  if (speed < CALM_KNOTS) {
    parent.append("circle").attr("r", sizes.calmR).attr("fill", "none").attr("stroke", t.palette[0]).attr("stroke-width", 2.5);
    return;
  }

  const theta = (Math.atan2(-u, -v) * 180) / Math.PI;
  const rounded = Math.round(speed / 5) * 5;
  let remaining = rounded;
  const pennants = Math.floor(remaining / 50);
  remaining -= pennants * 50;
  const fullBarbs = Math.floor(remaining / 10);
  remaining -= fullBarbs * 10;
  const halfBarb = remaining >= 5 ? 1 : 0;

  const rotated = parent.append("g").attr("transform", `rotate(${theta})`);

  rotated.append("circle").attr("r", sizes.dotR).attr("fill", t.palette[0]);
  rotated
    .append("line")
    .attr("x1", 0)
    .attr("y1", 0)
    .attr("x2", 0)
    .attr("y2", -sizes.staffLen)
    .attr("stroke", t.palette[0])
    .attr("stroke-width", 2.5)
    .attr("stroke-linecap", "round");

  let y = -sizes.staffLen;
  for (let k = 0; k < pennants; k++) {
    const yTip = y;
    const yBase = y + sizes.step;
    const [ox, oy] = barbTip(sizes.pennantLen);
    const apex = [ox, (yTip + yBase) / 2 + oy];
    rotated.append("path").attr("d", `M0,${yTip} L0,${yBase} L${apex[0]},${apex[1]} Z`).attr("fill", t.palette[0]);
    y += sizes.step + sizes.gap;
  }
  for (let k = 0; k < fullBarbs; k++) {
    const [ox, oy] = barbTip(sizes.barbLen);
    rotated
      .append("line")
      .attr("x1", 0)
      .attr("y1", y)
      .attr("x2", ox)
      .attr("y2", y + oy)
      .attr("stroke", t.palette[0])
      .attr("stroke-width", 2.5)
      .attr("stroke-linecap", "round");
    y += sizes.step + sizes.gap;
  }
  if (halfBarb) {
    const [ox, oy] = barbTip(sizes.halfLen);
    rotated
      .append("line")
      .attr("x1", 0)
      .attr("y1", y)
      .attr("x2", ox)
      .attr("y2", y + oy)
      .attr("stroke", t.palette[0])
      .attr("stroke-width", 2.5)
      .attr("stroke-linecap", "round");
  }
}

const MAP_SIZES = { staffLen: 68, barbLen: 22, halfLen: 11, pennantLen: 22, step: 9, gap: 3, dotR: 3.5, calmR: 9 };

const stationLayer = g.append("g");
for (const s of stations) {
  const stationGroup = stationLayer.append("g").attr("transform", `translate(${xScale(s.lon)},${yScale(s.lat)})`);
  drawBarb(stationGroup, s.u, s.v, MAP_SIZES);
}

// --- Legend: symbol key -------------------------------------------------
// A north-pointing staff (u=0, v=-knots) rotates to theta=0, so the same
// drawBarb routine used on the map also renders clean, upright legend glyphs.
const LEGEND_SIZES = { staffLen: 46, barbLen: 18, halfLen: 9, pennantLen: 18, step: 8, gap: 3, dotR: 3, calmR: 7 };
const legendEntries = [
  { knots: 0, label: "Calm (< 2.5 kt)" },
  { knots: 5, label: "Half barb — 5 kt" },
  { knots: 10, label: "Full barb — 10 kt" },
  { knots: 50, label: "Pennant — 50 kt" },
];
const legendX = margin.left + iw + 70;
const legendY = margin.top + 40;
const legendRowH = 62;
const legendBoxW = 220;
const legendBoxH = legendEntries.length * legendRowH + 46;

const legend = svg.append("g").attr("transform", `translate(${legendX},${legendY})`);
legend
  .append("rect")
  .attr("x", -30)
  .attr("y", -34)
  .attr("width", legendBoxW)
  .attr("height", legendBoxH)
  .attr("rx", 10)
  .attr("fill", t.elevatedBg)
  .attr("stroke", t.grid);
legend.append("text").attr("x", 20).attr("y", -6).attr("text-anchor", "middle").attr("fill", t.ink).style("font-size", "15px").style("font-weight", "600").text("Wind speed key");

legendEntries.forEach((entry, idx) => {
  const rowY = idx * legendRowH + 28;
  const glyph = legend.append("g").attr("transform", `translate(20,${rowY})`);
  drawBarb(glyph, 0, entry.knots === 0 ? 0 : -entry.knots, LEGEND_SIZES);
  legend
    .append("text")
    .attr("x", 56)
    .attr("y", rowY - LEGEND_SIZES.staffLen / 2 + 5)
    .attr("fill", t.inkSoft)
    .style("font-size", "13px")
    .text(entry.label);
});

// --- Title --------------------------------------------------------------
svg
  .append("text")
  .attr("x", width / 2)
  .attr("y", 52)
  .attr("text-anchor", "middle")
  .attr("fill", t.ink)
  .style("font-size", "22px")
  .style("font-weight", "600")
  .text("windbarb-basic · javascript · d3 · anyplot.ai");

svg
  .append("text")
  .attr("x", width / 2)
  .attr("y", 84)
  .attr("text-anchor", "middle")
  .attr("fill", t.inkSoft)
  .style("font-size", "15px")
  .text("Surface wind observations around a low-pressure system");
Runnable source as JSON, for any HTTP client: https://api.anyplot.ai/specs/windbarb-basic/d3/code. Any spec id and library id listed in llms-full.txt fit the same URL shape; every URL below is complete and callable.
{
  "spec_id": "windbarb-basic",
  "language": "javascript",
  "library": "d3",
  "page": "https://anyplot.ai/windbarb-basic/javascript/d3",
  "hub": "https://anyplot.ai/windbarb-basic",
  "code_json": "https://api.anyplot.ai/specs/windbarb-basic/d3/code",
  "spec_json": "https://api.anyplot.ai/specs/windbarb-basic",
  "render_light_png": "https://storage.googleapis.com/anyplot-images/plots/windbarb-basic/javascript/d3/plot-light.png",
  "render_dark_png": "https://storage.googleapis.com/anyplot-images/plots/windbarb-basic/javascript/d3/plot-dark.png",
  "interactive_light_html": "https://storage.googleapis.com/anyplot-images/plots/windbarb-basic/javascript/d3/plot-light.html",
  "interactive_dark_html": "https://storage.googleapis.com/anyplot-images/plots/windbarb-basic/javascript/d3/plot-dark.html",
  "quality_score": 85.0,
  "license": "MIT",
  "guide": "https://anyplot.ai/llms.txt"
}
Part of Wind Barb Plot for Meteorological Data on anyplot.ai.