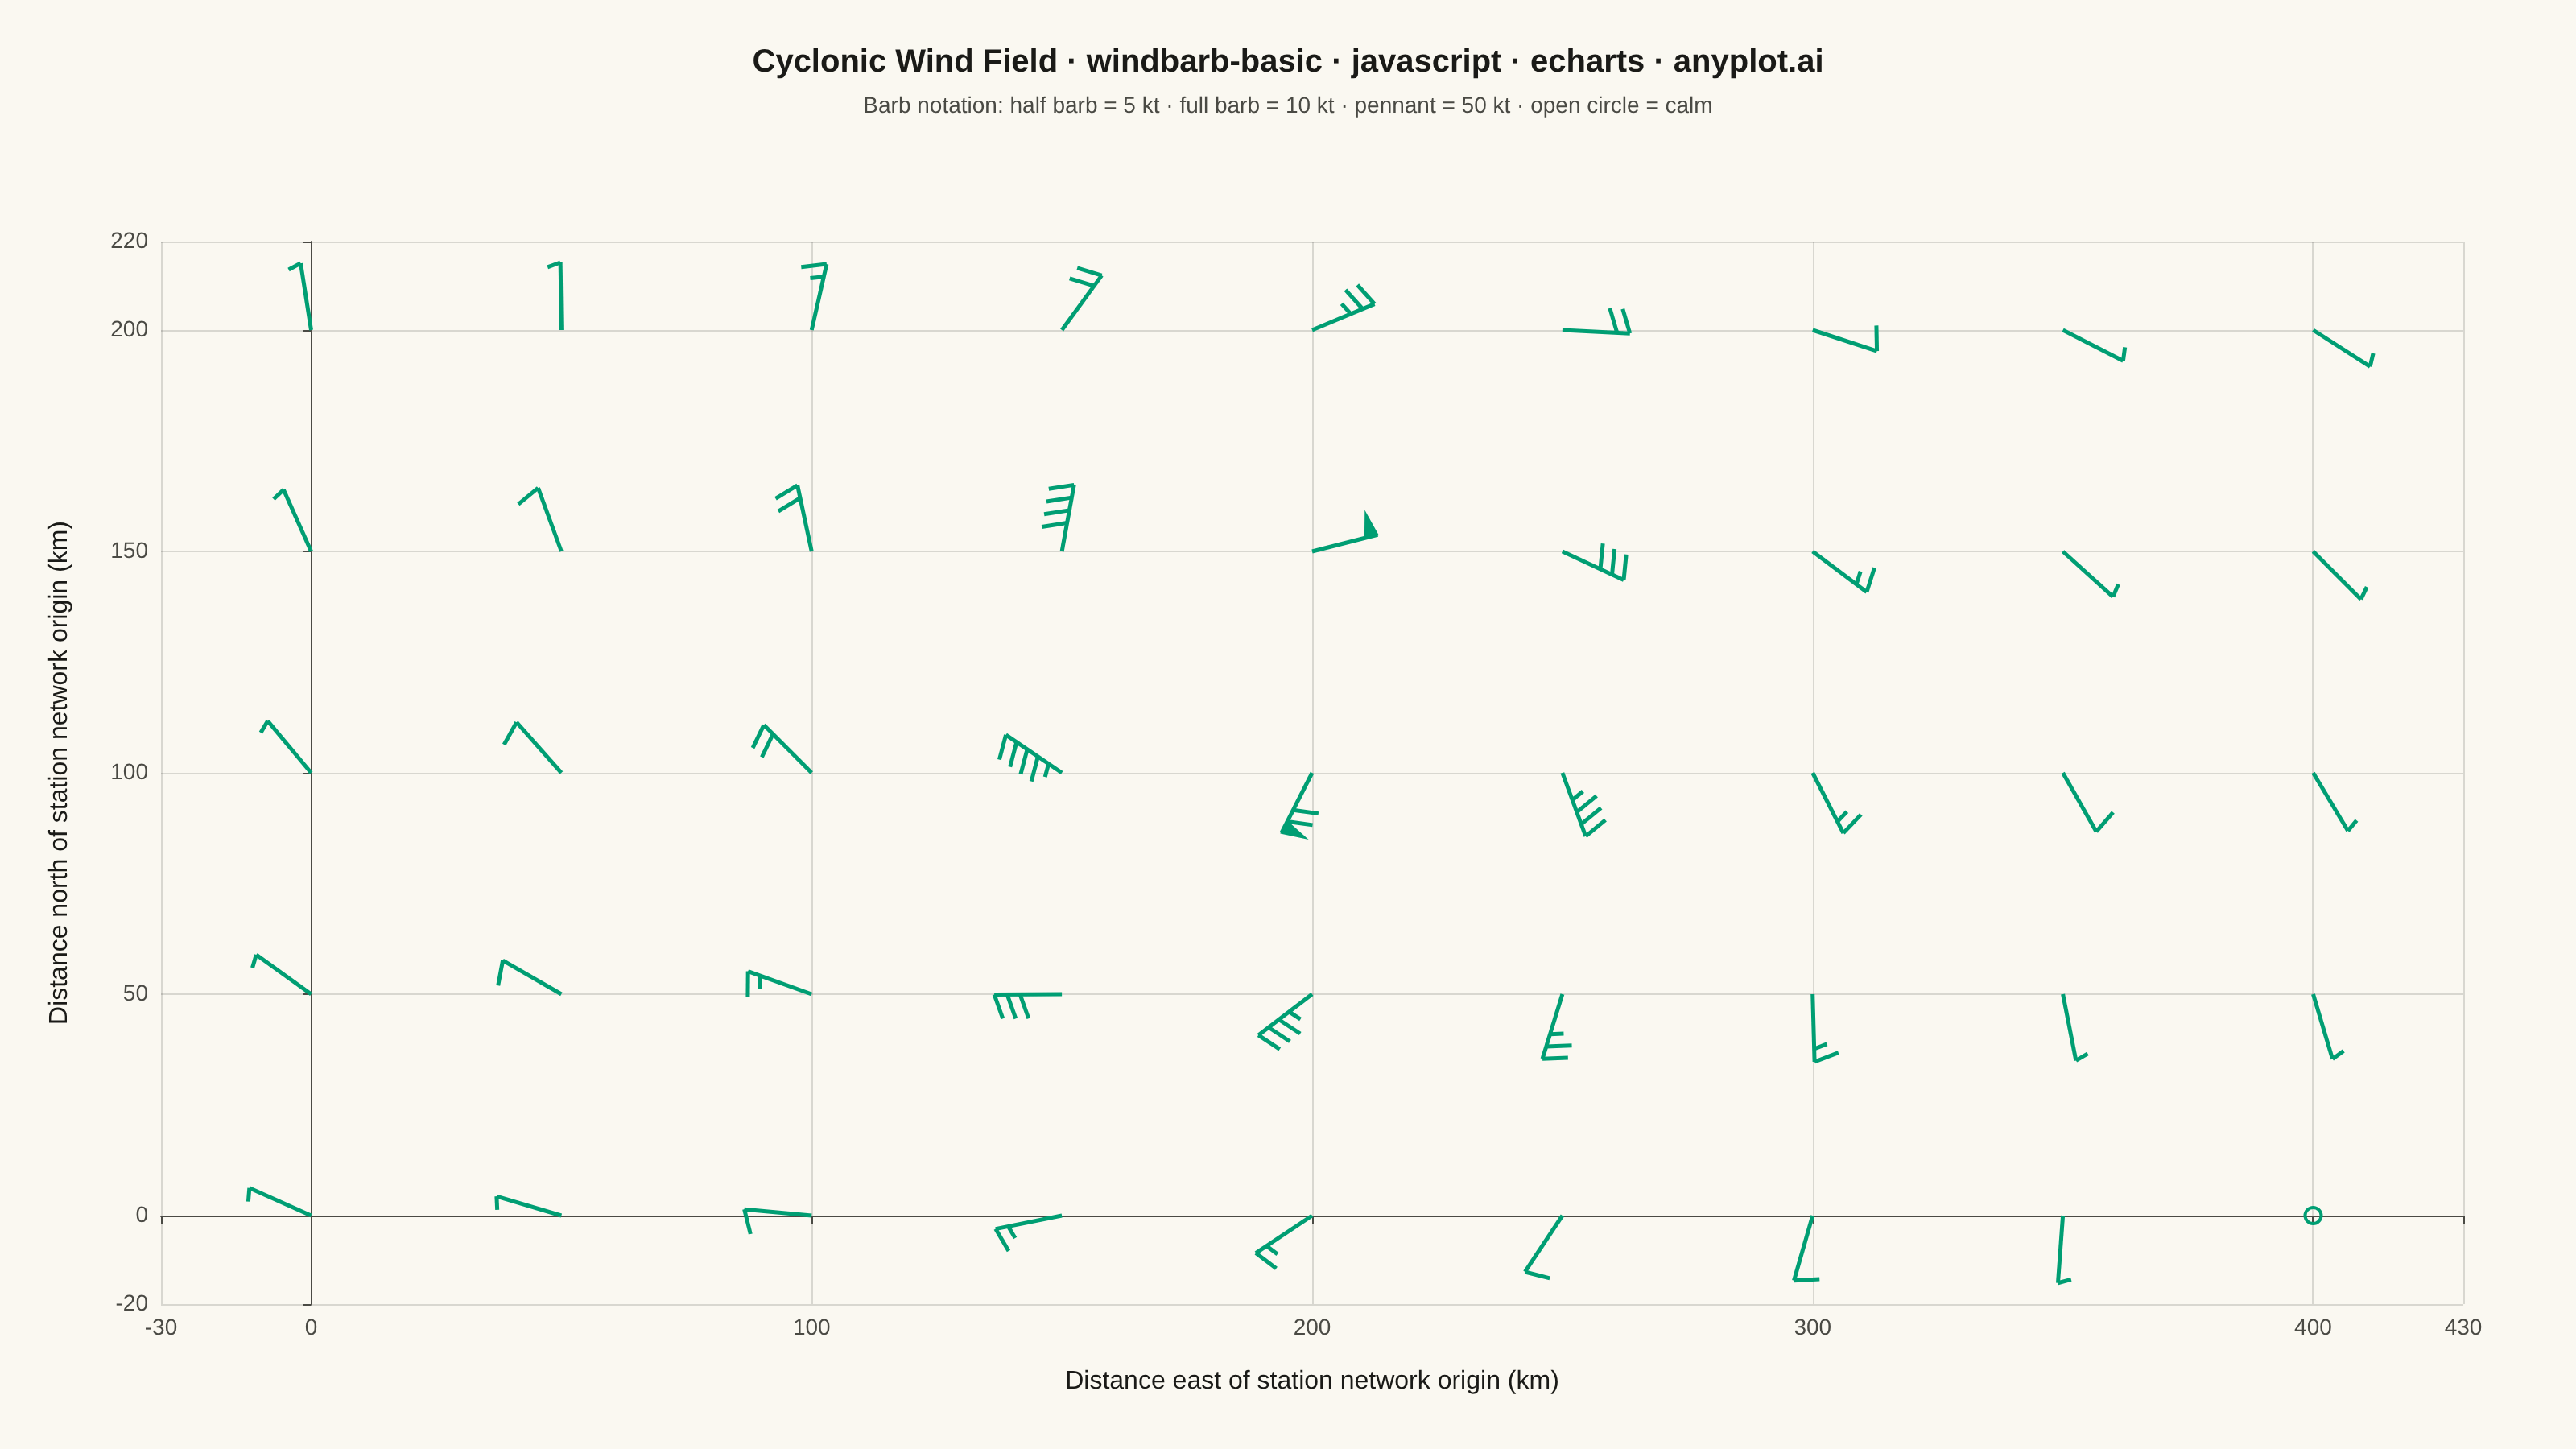
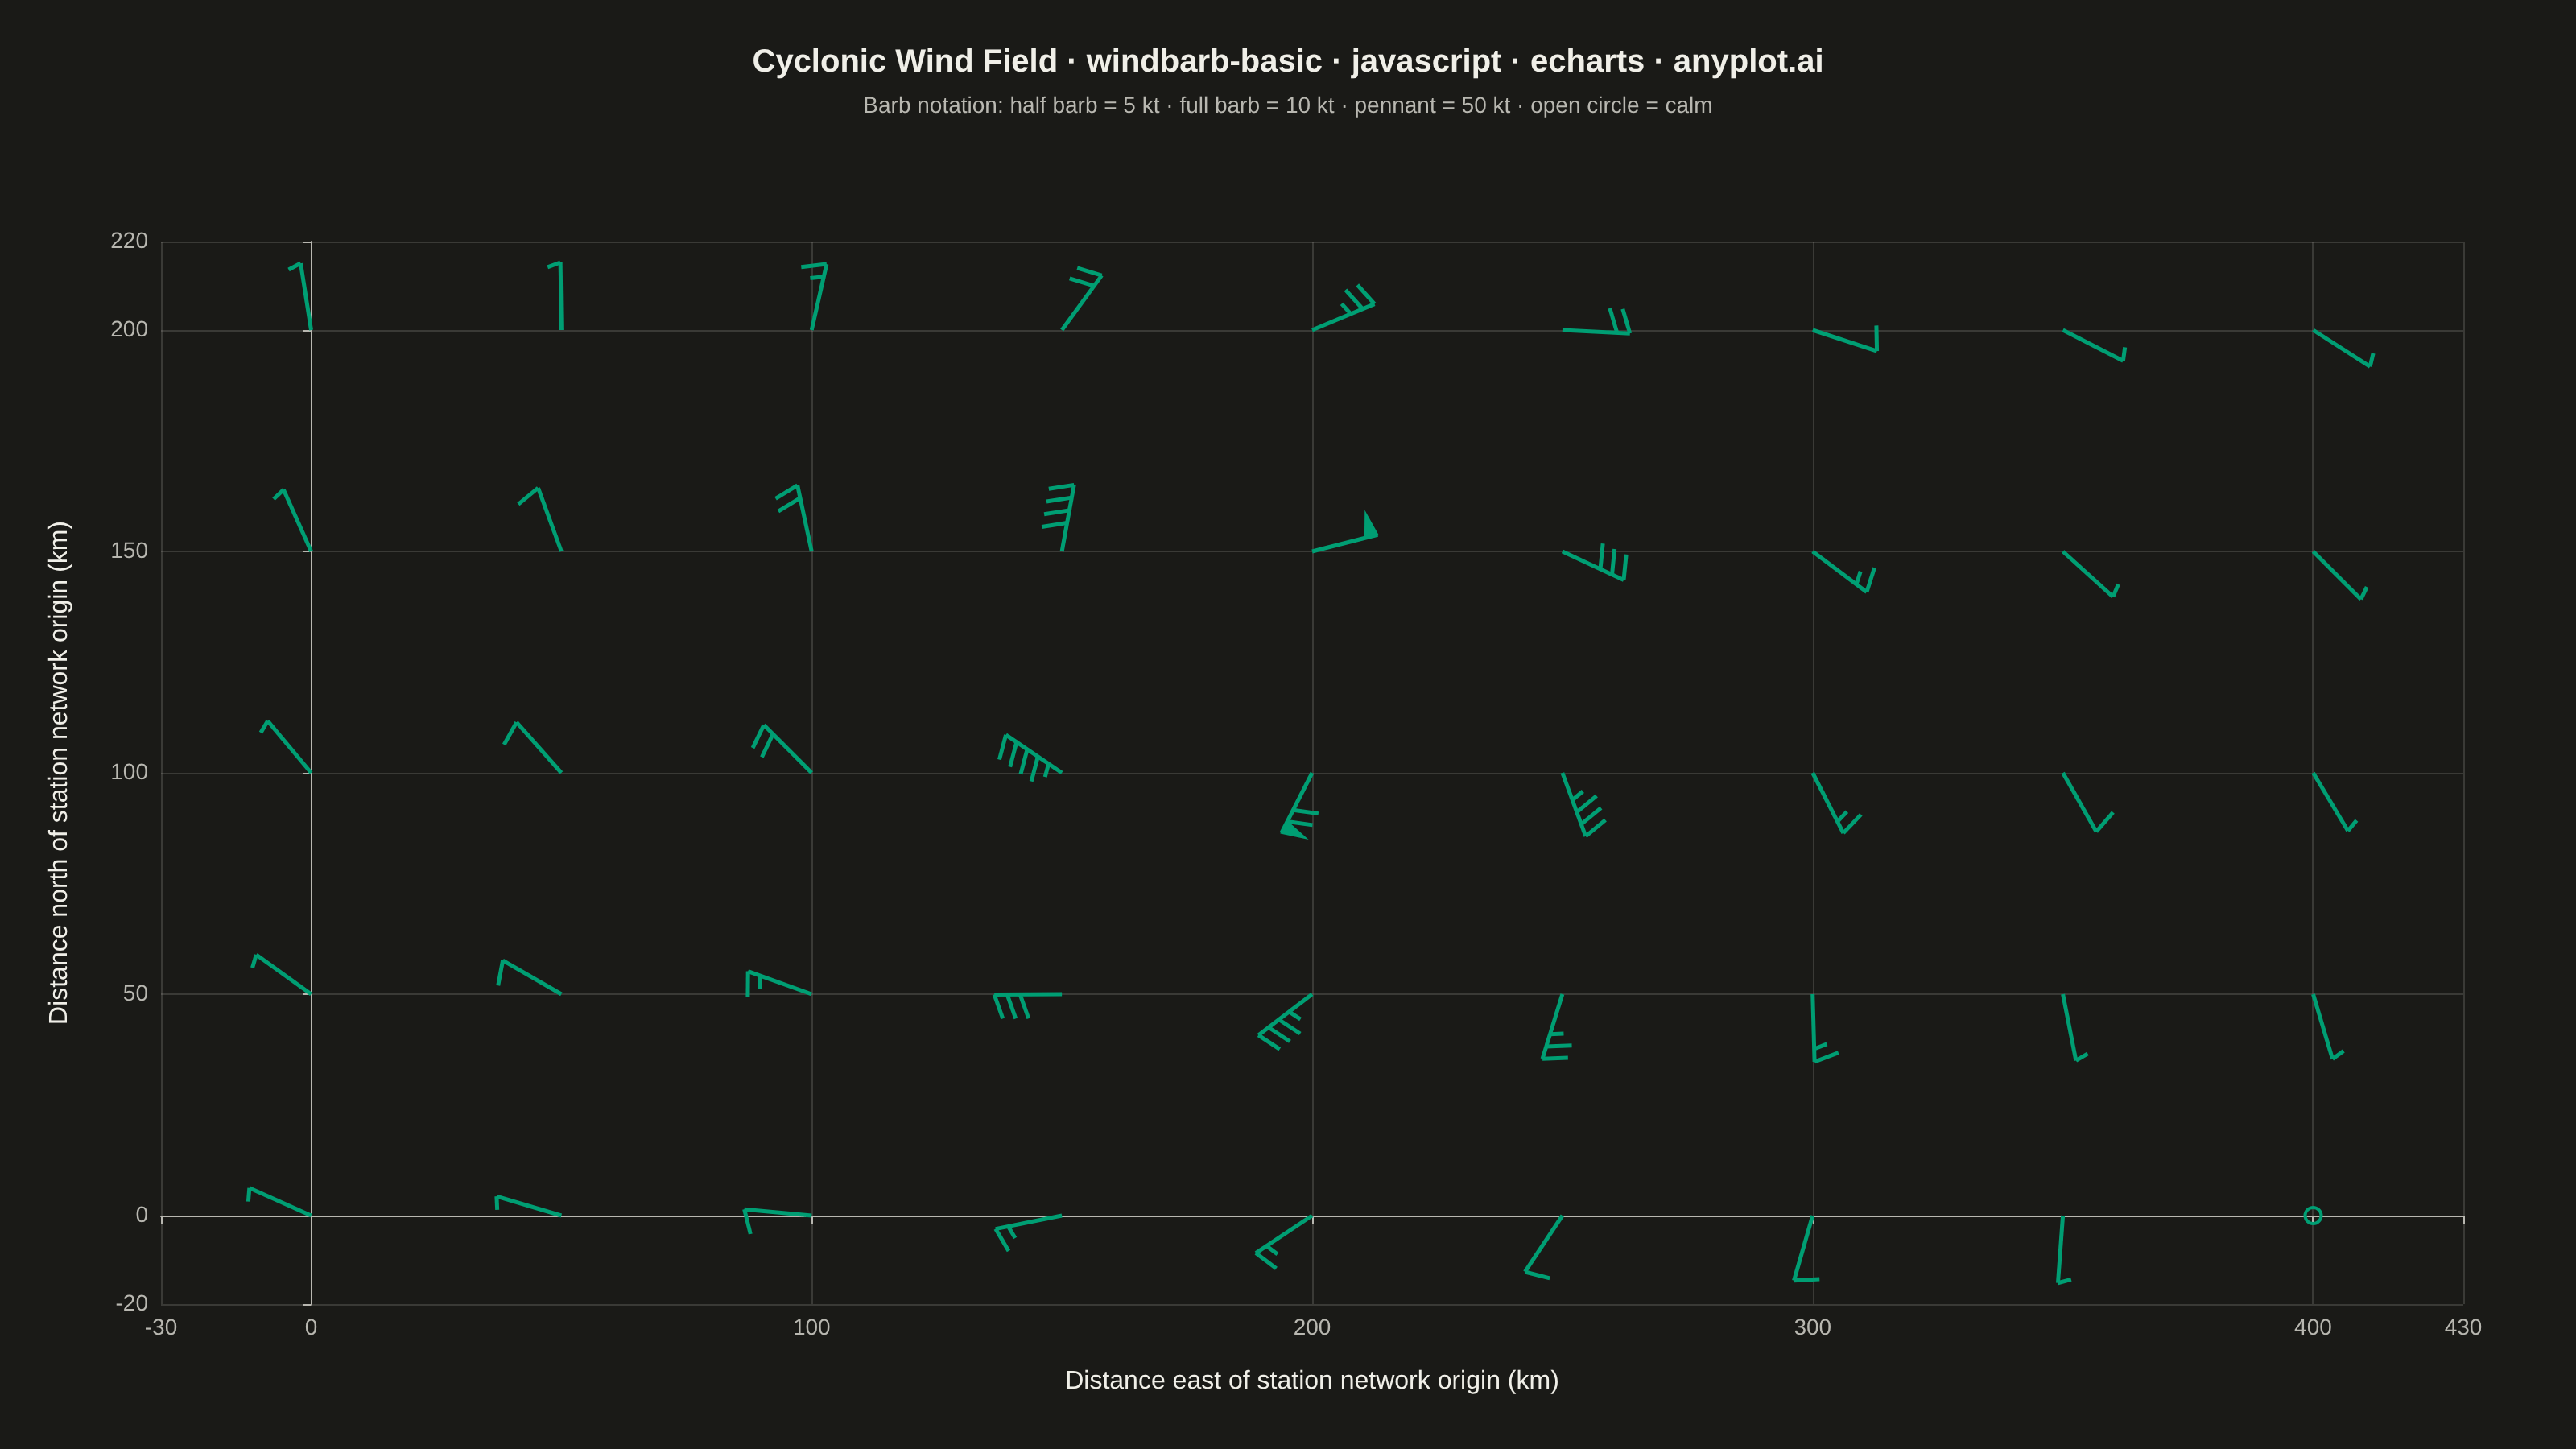
The same plot in 14 other libraries — JavaScript: Chart.js, D3.js, Highcharts, MUI X Charts; Python: Altair, Bokeh, lets-plot, Matplotlib, Plotly, plotnine, Pygal, Seaborn; R: ggplot2; Julia: Makie.jl. Compare all 15 side by side: Wind Barb Plot for Meteorological Data in Python, R, Julia and JavaScript.
A wind barb plot displays wind speed and direction at specific locations using standard meteorological barb notation. Each barb consists of a staff pointing in the direction from which the wind blows, with short barbs (5 knots), long barbs (10 knots), and triangular pennants (50 knots) attached to indicate speed. This internationally recognized symbology enables rapid interpretation of wind patterns across weather maps and atmospheric data visualizations.
// anyplot.ai
// windbarb-basic: Wind Barb Plot for Meteorological Data
// Library: echarts 6.1.0 | JavaScript 22.23.2
// Quality: 94/100 | Created: 2026-09-02

const t = window.ANYPLOT_TOKENS;

// --- Data: surface wind observations around a developing low-pressure system
// Station grid spacing (km), low center offset off-grid so no station sits
// exactly at the vortex core.
const xsKm = [0, 50, 100, 150, 200, 250, 300, 350, 400];
const ysKm = [0, 50, 100, 150, 200];
const centerX = 190;
const centerY = 115;

const stations = [];
for (const x of xsKm) {
  for (const y of ysKm) {
    const dx = x - centerX;
    const dy = y - centerY;
    const r = Math.sqrt(dx * dx + dy * dy);
    // Counterclockwise tangential flow plus inward spiral (cyclonic pattern).
    const tangentX = -dy / r;
    const tangentY = dx / r;
    const inwardX = -dx / r;
    const inwardY = -dy / r;
    const dirX = 0.8 * tangentX + 0.5 * inwardX;
    const dirY = 0.8 * tangentY + 0.5 * inwardY;
    const dirNorm = Math.hypot(dirX, dirY);
    const speedKt = 90 * Math.exp(-r / 65);
    const u = (dirX / dirNorm) * speedKt;
    const v = (dirY / dirNorm) * speedKt;
    stations.push([x, y, u, v]);
  }
}

// --- Wind barb rendering (staff + half/full barbs + pennants) ---------------
const STAFF_LEN = 42;
const BARB_GAP = 8;
const FULL_SPAN = 15;
const HALF_SPAN = 8;
const CALM_KT = 2.5;

function speedToCounts(speedKt) {
  const rounded = Math.round(speedKt / 5) * 5;
  const pennants = Math.floor(rounded / 50);
  let remainder = rounded - pennants * 50;
  const fulls = Math.floor(remainder / 10);
  remainder -= fulls * 10;
  const half = remainder >= 5;
  return { pennants, fulls, half };
}

function renderBarb(params, api) {
  const x = api.value(0);
  const y = api.value(1);
  const u = api.value(2);
  const v = api.value(3);
  const station = api.coord([x, y]);
  const speedKt = Math.hypot(u, v);

  if (speedKt < CALM_KT) {
    return {
      type: "circle",
      shape: { cx: station[0], cy: station[1], r: 5 },
      style: api.style({ fill: "none", stroke: t.palette[0], lineWidth: 2 }),
    };
  }

  // Staff points FROM which the wind blows — opposite the (u, v) vector.
  const tip = api.coord([x - u, y - v]);
  let dirX = tip[0] - station[0];
  let dirY = tip[1] - station[1];
  const dirLen = Math.hypot(dirX, dirY);
  dirX /= dirLen;
  dirY /= dirLen;
  const perpX = -dirY;
  const perpY = dirX;

  function toPixel(along, across) {
    return [
      station[0] + dirX * along + perpX * across,
      station[1] + dirY * along + perpY * across,
    ];
  }

  const { pennants, fulls, half } = speedToCounts(speedKt);
  const lineStyle = api.style({ stroke: t.palette[0], fill: "none", lineWidth: 2.5 });
  const fillStyle = api.style({ fill: t.palette[0], stroke: t.palette[0] });
  const children = [
    { type: "polyline", shape: { points: [[station[0], station[1]], toPixel(STAFF_LEN, 0)] }, style: lineStyle },
  ];

  let pos = STAFF_LEN;
  for (let i = 0; i < pennants; i++) {
    children.push({
      type: "polygon",
      shape: { points: [toPixel(pos, 0), toPixel(pos - BARB_GAP, 0), toPixel(pos - BARB_GAP / 2, -FULL_SPAN)] },
      style: fillStyle,
    });
    pos -= BARB_GAP;
  }
  for (let i = 0; i < fulls; i++) {
    children.push({
      type: "polyline",
      shape: { points: [toPixel(pos, 0), toPixel(pos - FULL_SPAN * 0.35, -FULL_SPAN)] },
      style: lineStyle,
    });
    pos -= BARB_GAP;
  }
  if (half) {
    children.push({
      type: "polyline",
      shape: { points: [toPixel(pos, 0), toPixel(pos - HALF_SPAN * 0.35, -HALF_SPAN)] },
      style: lineStyle,
    });
  }

  return { type: "group", children };
}

// --- Chart --------------------------------------------------------------
const chart = echarts.init(document.getElementById("container"));

chart.setOption({
  animation: false,
  backgroundColor: "transparent",
  title: {
    text: "Cyclonic Wind Field · windbarb-basic · javascript · echarts · anyplot.ai",
    subtext: "Barb notation: half barb = 5 kt · full barb = 10 kt · pennant = 50 kt · open circle = calm",
    left: "center",
    top: 24,
    textStyle: { color: t.ink, fontSize: 20 },
    subtextStyle: { color: t.inkSoft, fontSize: 14 },
  },
  grid: { left: 100, right: 70, top: 150, bottom: 90 },
  xAxis: {
    type: "value",
    name: "Distance east of station network origin (km)",
    nameLocation: "middle",
    nameGap: 40,
    min: -30,
    max: 430,
    nameTextStyle: { color: t.ink, fontSize: 16 },
    axisLabel: { color: t.inkSoft, fontSize: 14 },
    axisLine: { lineStyle: { color: t.inkSoft } },
    splitLine: { lineStyle: { color: t.grid } },
  },
  yAxis: {
    type: "value",
    name: "Distance north of station network origin (km)",
    nameLocation: "middle",
    nameGap: 55,
    min: -20,
    max: 220,
    nameTextStyle: { color: t.ink, fontSize: 16 },
    axisLabel: { color: t.inkSoft, fontSize: 14 },
    axisLine: { lineStyle: { color: t.inkSoft } },
    splitLine: { lineStyle: { color: t.grid } },
  },
  series: [
    {
      type: "custom",
      coordinateSystem: "cartesian2d",
      encode: { x: 0, y: 1 },
      renderItem: renderBarb,
      data: stations,
    },
  ],
});
Runnable source as JSON, for any HTTP client: https://api.anyplot.ai/specs/windbarb-basic/echarts/code. Any spec id and library id listed in llms-full.txt fit the same URL shape; every URL below is complete and callable.
{
  "spec_id": "windbarb-basic",
  "language": "javascript",
  "library": "echarts",
  "page": "https://anyplot.ai/windbarb-basic/javascript/echarts",
  "hub": "https://anyplot.ai/windbarb-basic",
  "code_json": "https://api.anyplot.ai/specs/windbarb-basic/echarts/code",
  "spec_json": "https://api.anyplot.ai/specs/windbarb-basic",
  "render_light_png": "https://storage.googleapis.com/anyplot-images/plots/windbarb-basic/javascript/echarts/plot-light.png",
  "render_dark_png": "https://storage.googleapis.com/anyplot-images/plots/windbarb-basic/javascript/echarts/plot-dark.png",
  "interactive_light_html": "https://storage.googleapis.com/anyplot-images/plots/windbarb-basic/javascript/echarts/plot-light.html",
  "interactive_dark_html": "https://storage.googleapis.com/anyplot-images/plots/windbarb-basic/javascript/echarts/plot-dark.html",
  "quality_score": 94.0,
  "license": "MIT",
  "guide": "https://anyplot.ai/llms.txt"
}
Part of Wind Barb Plot for Meteorological Data on anyplot.ai.