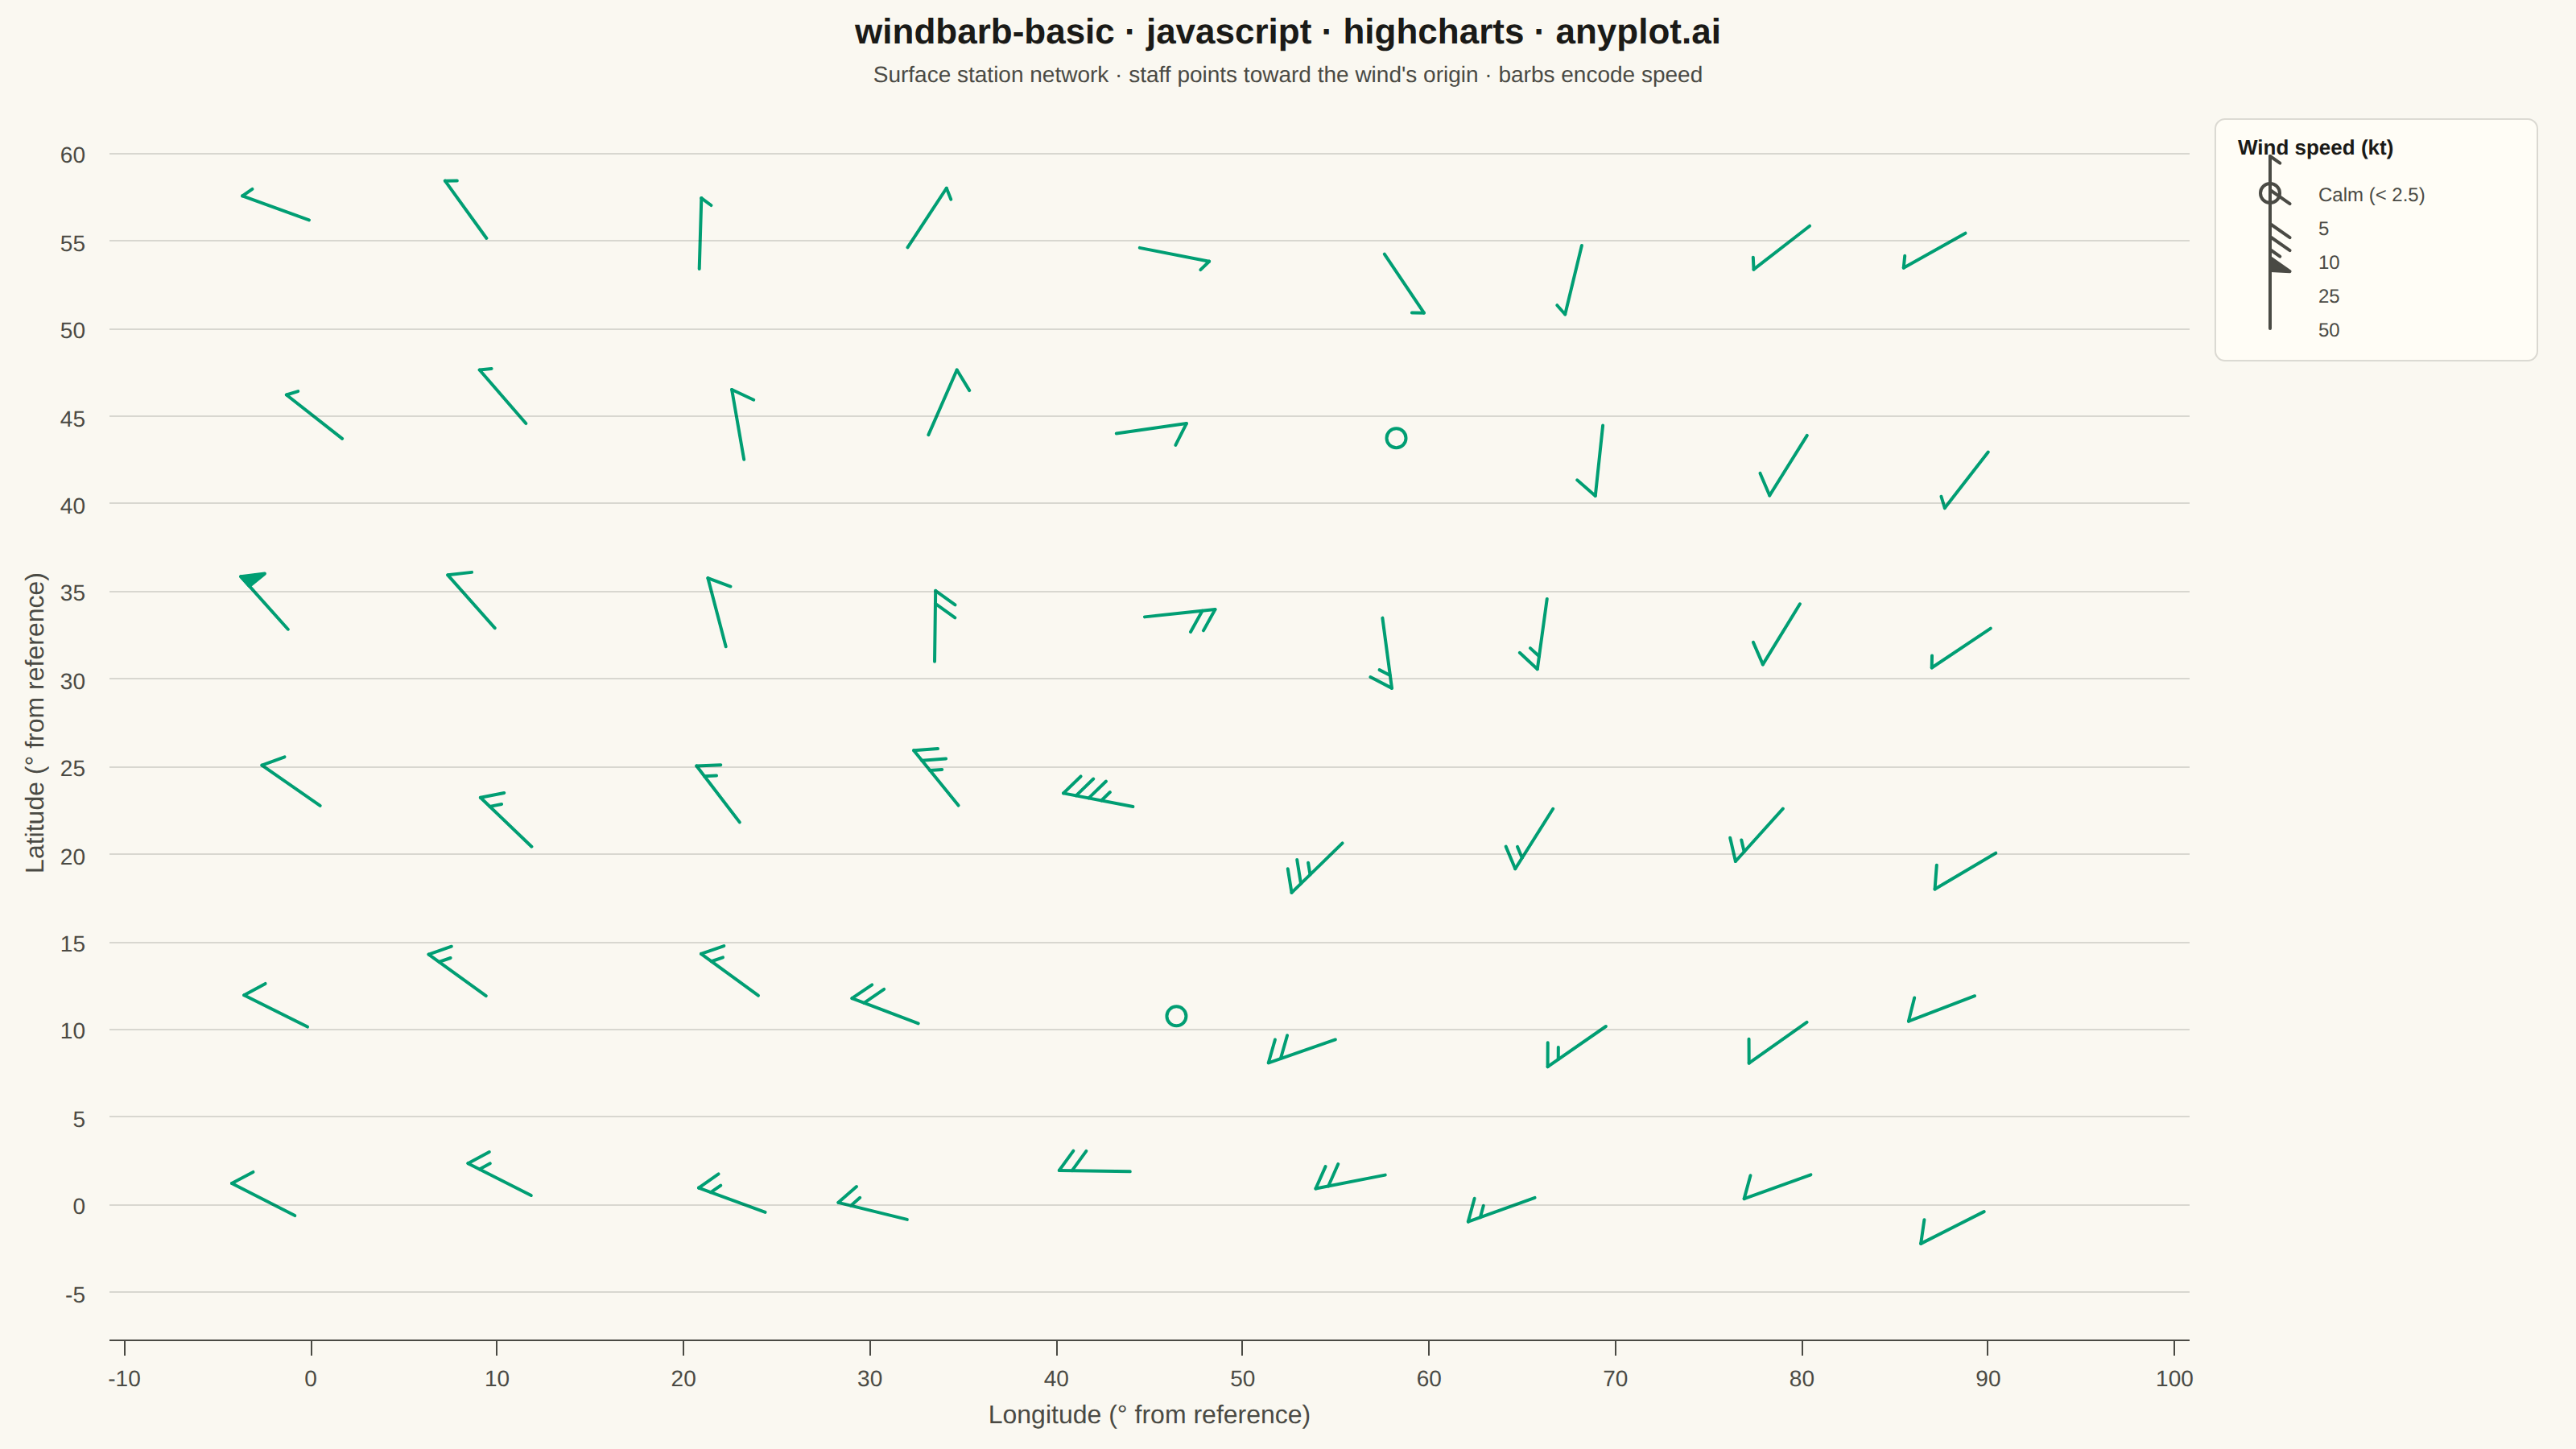
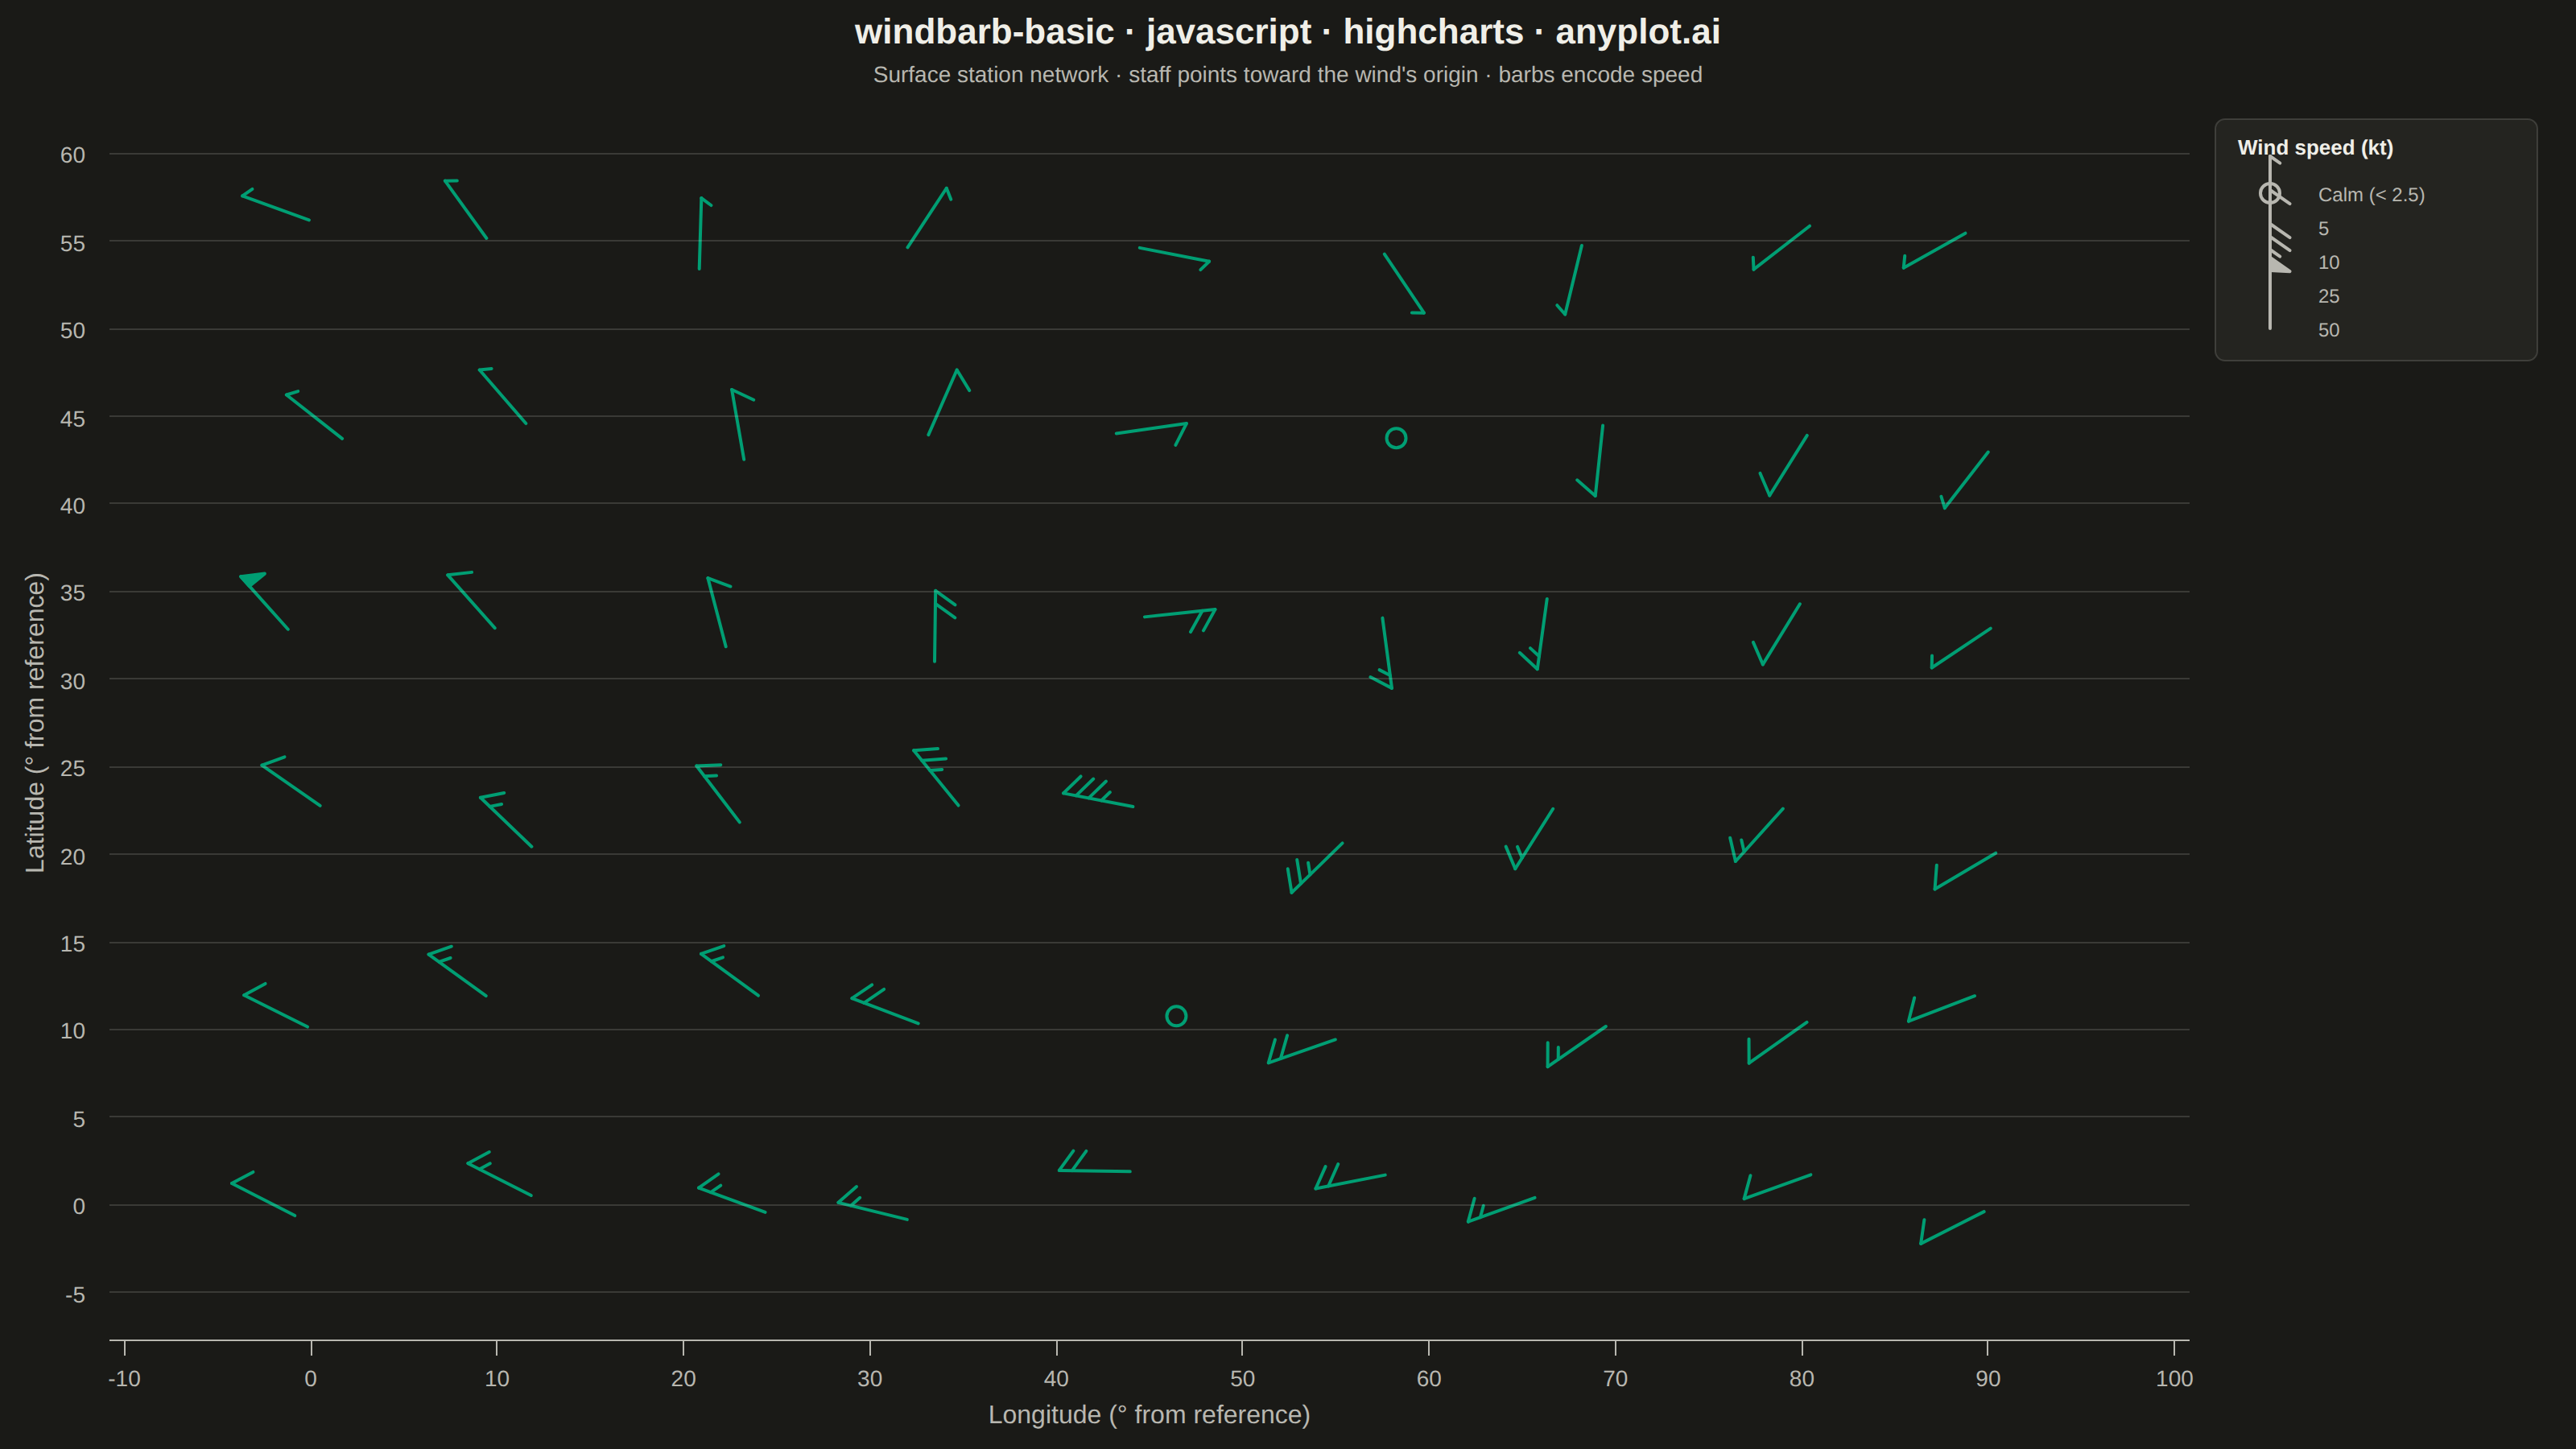
The same plot in 14 other libraries — JavaScript: Chart.js, D3.js, Apache ECharts, MUI X Charts; Python: Altair, Bokeh, lets-plot, Matplotlib, Plotly, plotnine, Pygal, Seaborn; R: ggplot2; Julia: Makie.jl. Compare all 15 side by side: Wind Barb Plot for Meteorological Data in Python, R, Julia and JavaScript.
A wind barb plot displays wind speed and direction at specific locations using standard meteorological barb notation. Each barb consists of a staff pointing in the direction from which the wind blows, with short barbs (5 knots), long barbs (10 knots), and triangular pennants (50 knots) attached to indicate speed. This internationally recognized symbology enables rapid interpretation of wind patterns across weather maps and atmospheric data visualizations.
// anyplot.ai
// windbarb-basic: Wind Barb Plot for Meteorological Data
// Library: highcharts 12.6.0 | JavaScript 22.23.2
// Quality: 89/100 | Created: 2026-09-02
//# anyplot-orientation: landscape

const t = window.ANYPLOT_TOKENS;

// --- Data (in-memory, deterministic) ----------------------------------------
// Small fixed-seed LCG — no network, no Math.random(), fully reproducible.
function makeLcg(seed) {
  let s = seed >>> 0;
  return function () {
    s = (s * 1664525 + 1013904223) >>> 0;
    return s / 4294967296;
  };
}
const rand = makeLcg(20260615);

// Grid of surface weather stations over a synoptic map. Positions carry a
// little jitter around a regular lattice so barbs stay legible (no overlap)
// while looking like a real observation network rather than a perfect grid.
const COLS = 9;
const ROWS = 6;
const SPAN_X = 90; // degrees longitude, arbitrary reference frame
const SPAN_Y = 55; // degrees latitude
const cx = SPAN_X / 2;
const cy = SPAN_Y / 2;

const stations = [];
for (let row = 0; row < ROWS; row++) {
  for (let col = 0; col < COLS; col++) {
    const x = (col / (COLS - 1)) * SPAN_X + (rand() - 0.5) * 4;
    const y = (row / (ROWS - 1)) * SPAN_Y + (rand() - 0.5) * 4;

    // Synthetic flow: a cyclonic gyre near the map centre (low-pressure
    // system) superposed on a background westerly, in u/v knots.
    const dx = x - cx;
    const dy = y - cy;
    const r = Math.sqrt(dx * dx + dy * dy) + 1e-6;
    const rotSpeed = 34 * Math.exp(-r / 24);
    const u = (-dy / r) * rotSpeed + 7 + (rand() - 0.5) * 3; // eastward component
    const v = (dx / r) * rotSpeed + (rand() - 0.5) * 3; // northward component

    stations.push({ x, y, u, v });
  }
}
// Force a couple of calm stations (< 2.5 kt) so the "open circle" notation
// actually appears in the plot, per the specification's notes.
stations[Math.floor(COLS * 1.5)].u = 0.5;
stations[Math.floor(COLS * 1.5)].v = -0.3;
stations[stations.length - Math.floor(COLS * 1.5)].u = -0.4;
stations[stations.length - Math.floor(COLS * 1.5)].v = 0.6;
// Force one station past 50 kt so the pennant (triangle) glyph actually
// renders in the data itself, not only in the static notation key.
const pennantIdx = Math.floor(stations.length / 2);
stations[pennantIdx].u = 34;
stations[pennantIdx].v = -38;

const xPad = SPAN_X * 0.12;
const yPad = SPAN_Y * 0.14;
const xMin = -xPad;
const xMax = SPAN_X + xPad;
const yMin = -yPad;
const yMax = SPAN_Y + yPad;

// --- Wind barb glyph ---------------------------------------------------------
// Meteorological convention: the staff points toward the direction the wind
// blows FROM; short barb = 5 kt, full barb = 10 kt, pennant (triangle) = 50 kt,
// rounded to the nearest 5 kt; calm (< 2.5 kt) draws as a bare open circle.
// Barbs are attached on a fixed side of the staff (Northern-Hemisphere
// convention) walking from the tip back toward the station, angled back
// toward the base like a feather rather than straight perpendicular.
const SHAFT_LEN = 44;
const BARB_LEN = 15;
const BARB_GAP = 8;
const CALM_RADIUS = 6;
const BARB_ANGLE = (55 * Math.PI) / 180; // degrees off the reverse-staff direction

function windBarbShapes(cxPx, cyPx, u, v, color) {
  const speedRaw = Math.sqrt(u * u + v * v);
  if (speedRaw < 2.5) {
    return [{ tag: "circle", cx: cxPx, cy: cyPx, r: CALM_RADIUS, color }];
  }

  // Compass bearing (0 = N, 90 = E) the wind is blowing TOWARD, then flipped
  // 180° to get the direction the staff points (toward the wind's origin).
  const toBearing = (Math.atan2(u, v) * 180) / Math.PI;
  const fromBearing = toBearing + 180;
  const rad = (fromBearing * Math.PI) / 180;
  const ux = Math.sin(rad);
  const uy = -Math.cos(rad);
  // Fixed perpendicular side for the barbs (consistent across all stations),
  // then angled back toward the staff's base for an authentic feather look
  // instead of a straight 90° tick mark.
  const px = -uy;
  const py = ux;
  const bpx = -ux * Math.cos(BARB_ANGLE) + px * Math.sin(BARB_ANGLE);
  const bpy = -uy * Math.cos(BARB_ANGLE) + py * Math.sin(BARB_ANGLE);

  const tipX = cxPx + ux * SHAFT_LEN;
  const tipY = cyPx + uy * SHAFT_LEN;

  const shapes = [
    {
      tag: "path",
      d: [
        ["M", cxPx, cyPx],
        ["L", tipX, tipY],
      ],
      color,
      fill: "none",
    },
  ];

  let speed = Math.round(speedRaw / 5) * 5;
  const pennants = Math.floor(speed / 50);
  speed -= pennants * 50;
  const fullBarbs = Math.floor(speed / 10);
  speed -= fullBarbs * 10;
  const halfBarb = speed >= 5 ? 1 : 0;

  let pos = SHAFT_LEN;
  for (let i = 0; i < pennants; i++) {
    const bx = cxPx + ux * pos;
    const by = cyPx + uy * pos;
    const nx = cxPx + ux * (pos - BARB_GAP);
    const ny = cyPx + uy * (pos - BARB_GAP);
    const tx = bx + bpx * BARB_LEN;
    const ty = by + bpy * BARB_LEN;
    shapes.push({
      tag: "path",
      d: [["M", bx, by], ["L", tx, ty], ["L", nx, ny], ["Z"]],
      color,
      fill: color,
    });
    pos -= BARB_GAP;
  }
  for (let i = 0; i < fullBarbs; i++) {
    const bx = cxPx + ux * pos;
    const by = cyPx + uy * pos;
    const tx = bx + bpx * BARB_LEN;
    const ty = by + bpy * BARB_LEN;
    shapes.push({
      tag: "path",
      d: [
        ["M", bx, by],
        ["L", tx, ty],
      ],
      color,
      fill: "none",
    });
    pos -= BARB_GAP;
  }
  if (halfBarb) {
    const bx = cxPx + ux * pos;
    const by = cyPx + uy * pos;
    const tx = bx + bpx * (BARB_LEN / 2);
    const ty = by + bpy * (BARB_LEN / 2);
    shapes.push({
      tag: "path",
      d: [
        ["M", bx, by],
        ["L", tx, ty],
      ],
      color,
      fill: "none",
    });
  }

  return shapes;
}

function paintShape(renderer, group, shape) {
  if (shape.tag === "circle") {
    renderer
      .circle(shape.cx, shape.cy, shape.r)
      .attr({ fill: "none", stroke: shape.color, "stroke-width": 2 })
      .add(group);
  } else {
    renderer
      .path(shape.d)
      .attr({
        fill: shape.fill === "none" ? "none" : shape.color,
        stroke: shape.color,
        "stroke-width": 2,
        "stroke-linejoin": "round",
        "stroke-linecap": "round",
      })
      .add(group);
  }
}

function drawBarbs(chart) {
  if (chart.barbGroup) chart.barbGroup.destroy();
  chart.barbGroup = chart.renderer.g("wind-barbs").add();

  const xAxis = chart.xAxis[0];
  const yAxis = chart.yAxis[0];
  stations.forEach((s) => {
    const px = xAxis.toPixels(s.x, false);
    const py = yAxis.toPixels(s.y, false);
    windBarbShapes(px, py, s.u, s.v, t.palette[0]).forEach((shape) =>
      paintShape(chart.renderer, chart.barbGroup, shape),
    );
  });

  drawLegendKey(chart);
}

// --- Notation key (barb glyphs are unfamiliar without a legend) ------------
function drawLegendKey(chart) {
  if (chart.barbLegendGroup) chart.barbLegendGroup.destroy();
  const renderer = chart.renderer;
  const group = renderer.g("wind-barb-key").add();
  chart.barbLegendGroup = group;

  // Lives in the reserved right margin (chart.marginRight below), never over
  // the plot area, so it can never occlude a station's barb.
  const boxW = 200;
  const boxH = 150;
  const boxX = chart.plotLeft + chart.plotWidth + 16;
  const boxY = chart.plotTop + 8;

  renderer
    .rect(boxX, boxY, boxW, boxH, 6)
    .attr({
      fill: t.elevatedBg,
      stroke: t.grid,
      "stroke-width": 1,
    })
    .add(group);

  renderer
    .text("Wind speed (kt)", boxX + 14, boxY + 22)
    .attr({ zIndex: 5 })
    .css({ color: t.ink, fontSize: "13px", fontWeight: "600" })
    .add(group);

  const entries = [
    { label: "Calm (< 2.5)", u: 0, v: 0 },
    { label: "5", u: 0, v: -5 },
    { label: "10", u: 0, v: -10 },
    { label: "25", u: 0, v: -25 },
    { label: "50", u: 0, v: -50 },
  ];
  const rowY0 = boxY + 46;
  const rowGap = 21;
  const iconX = boxX + 34;
  entries.forEach((entry, i) => {
    const rowY = rowY0 + i * rowGap;
    windBarbShapes(iconX, rowY, entry.u, entry.v, t.inkSoft).forEach((shape) =>
      paintShape(renderer, group, shape),
    );
    renderer
      .text(entry.label, boxX + 64, rowY + 5)
      .css({ color: t.inkSoft, fontSize: "12px" })
      .add(group);
  });
}

// --- Chart -------------------------------------------------------------------
Highcharts.chart("container", {
  chart: {
    type: "scatter",
    backgroundColor: "transparent",
    animation: false,
    marginRight: 240, // reserves the notation-key panel outside the data area
    style: { fontFamily: "inherit" },
    events: {
      render: function () {
        drawBarbs(this);
      },
    },
  },
  credits: { enabled: false },
  colors: t.palette,
  title: {
    text: "windbarb-basic · javascript · highcharts · anyplot.ai",
    style: { color: t.ink, fontSize: "22px", fontWeight: "600" },
  },
  subtitle: {
    text: "Surface station network · staff points toward the wind's origin · barbs encode speed",
    style: { color: t.inkSoft, fontSize: "14px" },
  },
  xAxis: {
    min: xMin,
    max: xMax,
    startOnTick: false,
    endOnTick: false,
    title: {
      text: "Longitude (° from reference)",
      style: { color: t.inkSoft, fontSize: "16px" },
    },
    lineColor: t.inkSoft,
    tickColor: t.inkSoft,
    gridLineColor: t.grid,
    labels: { style: { color: t.inkSoft, fontSize: "14px" } },
  },
  yAxis: {
    min: yMin,
    max: yMax,
    startOnTick: false,
    endOnTick: false,
    title: {
      text: "Latitude (° from reference)",
      style: { color: t.inkSoft, fontSize: "16px" },
    },
    lineColor: t.inkSoft,
    tickColor: t.inkSoft,
    gridLineColor: t.grid,
    labels: { style: { color: t.inkSoft, fontSize: "14px" } },
  },
  legend: { enabled: false },
  tooltip: { enabled: false },
  plotOptions: {
    series: { animation: false, enableMouseTracking: false },
    scatter: { marker: { enabled: false } },
  },
  series: [
    {
      name: "Stations",
      data: stations.map((s) => [s.x, s.y]),
      marker: { enabled: false },
    },
  ],
});
Runnable source as JSON, for any HTTP client: https://api.anyplot.ai/specs/windbarb-basic/highcharts/code. Any spec id and library id listed in llms-full.txt fit the same URL shape; every URL below is complete and callable.
{
  "spec_id": "windbarb-basic",
  "language": "javascript",
  "library": "highcharts",
  "page": "https://anyplot.ai/windbarb-basic/javascript/highcharts",
  "hub": "https://anyplot.ai/windbarb-basic",
  "code_json": "https://api.anyplot.ai/specs/windbarb-basic/highcharts/code",
  "spec_json": "https://api.anyplot.ai/specs/windbarb-basic",
  "render_light_png": "https://storage.googleapis.com/anyplot-images/plots/windbarb-basic/javascript/highcharts/plot-light.png",
  "render_dark_png": "https://storage.googleapis.com/anyplot-images/plots/windbarb-basic/javascript/highcharts/plot-dark.png",
  "interactive_light_html": "https://storage.googleapis.com/anyplot-images/plots/windbarb-basic/javascript/highcharts/plot-light.html",
  "interactive_dark_html": "https://storage.googleapis.com/anyplot-images/plots/windbarb-basic/javascript/highcharts/plot-dark.html",
  "quality_score": 89.0,
  "license": "MIT",
  "guide": "https://anyplot.ai/llms.txt"
}
Part of Wind Barb Plot for Meteorological Data on anyplot.ai.