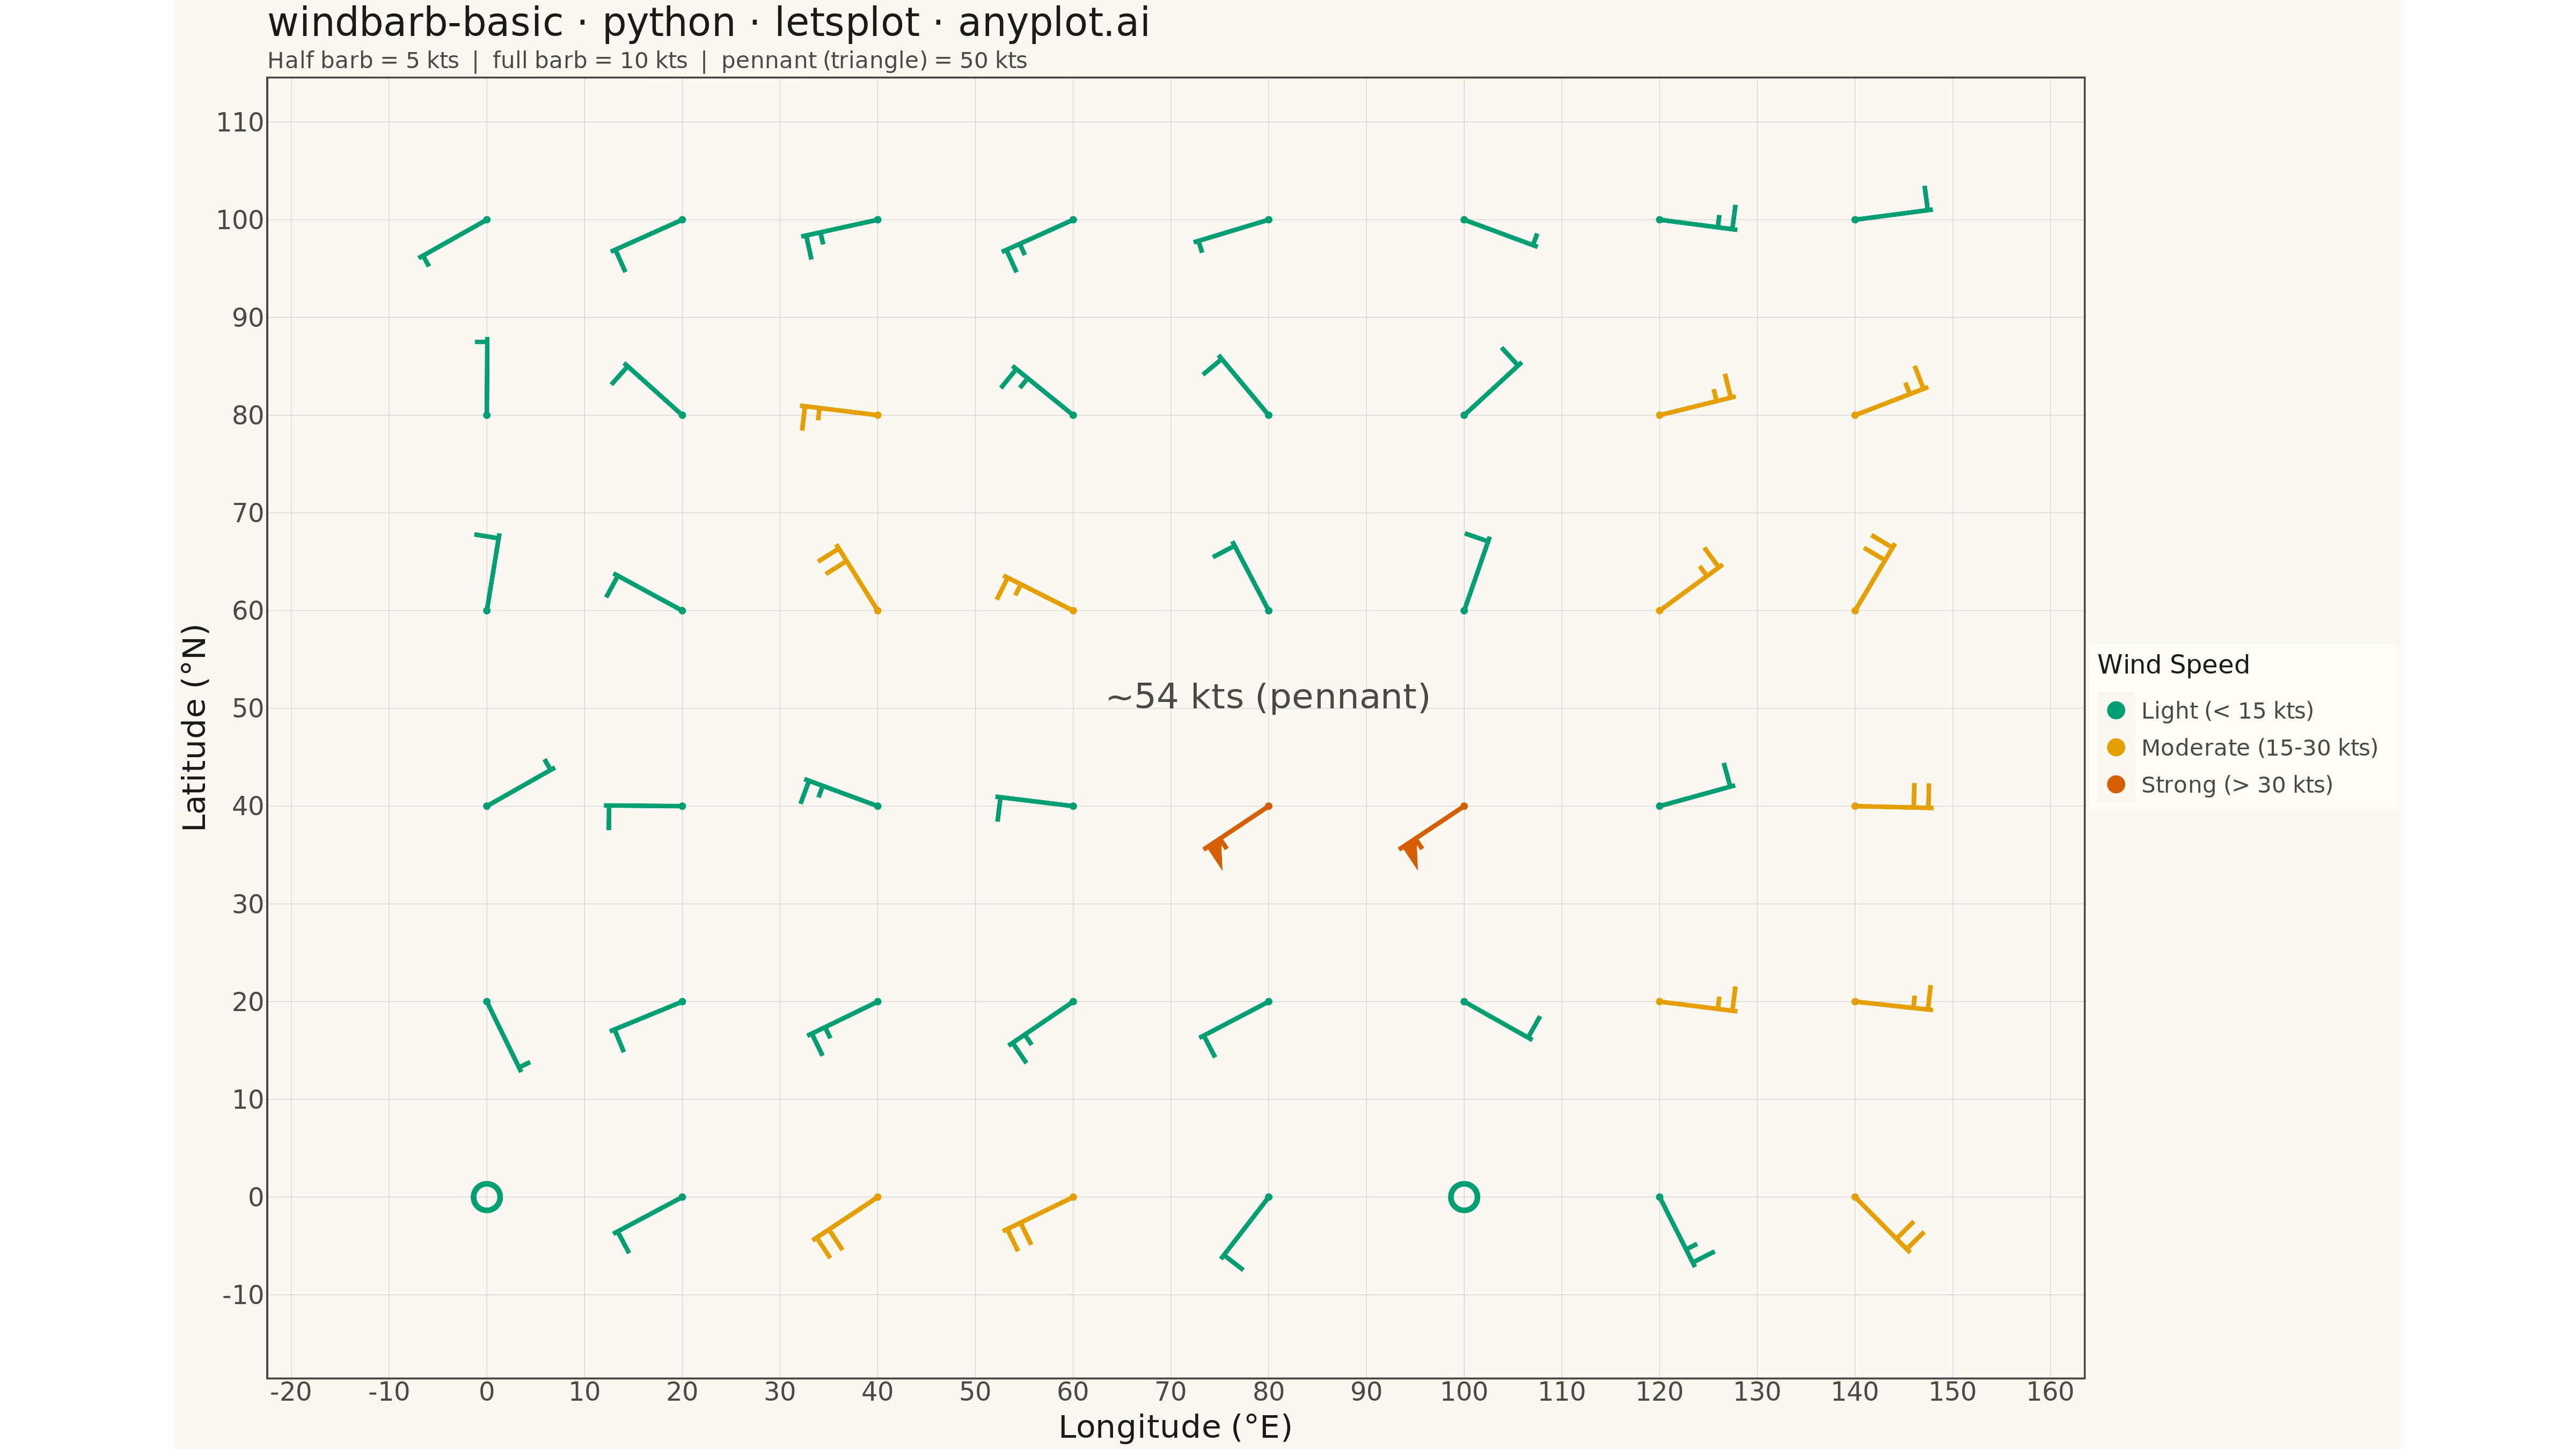
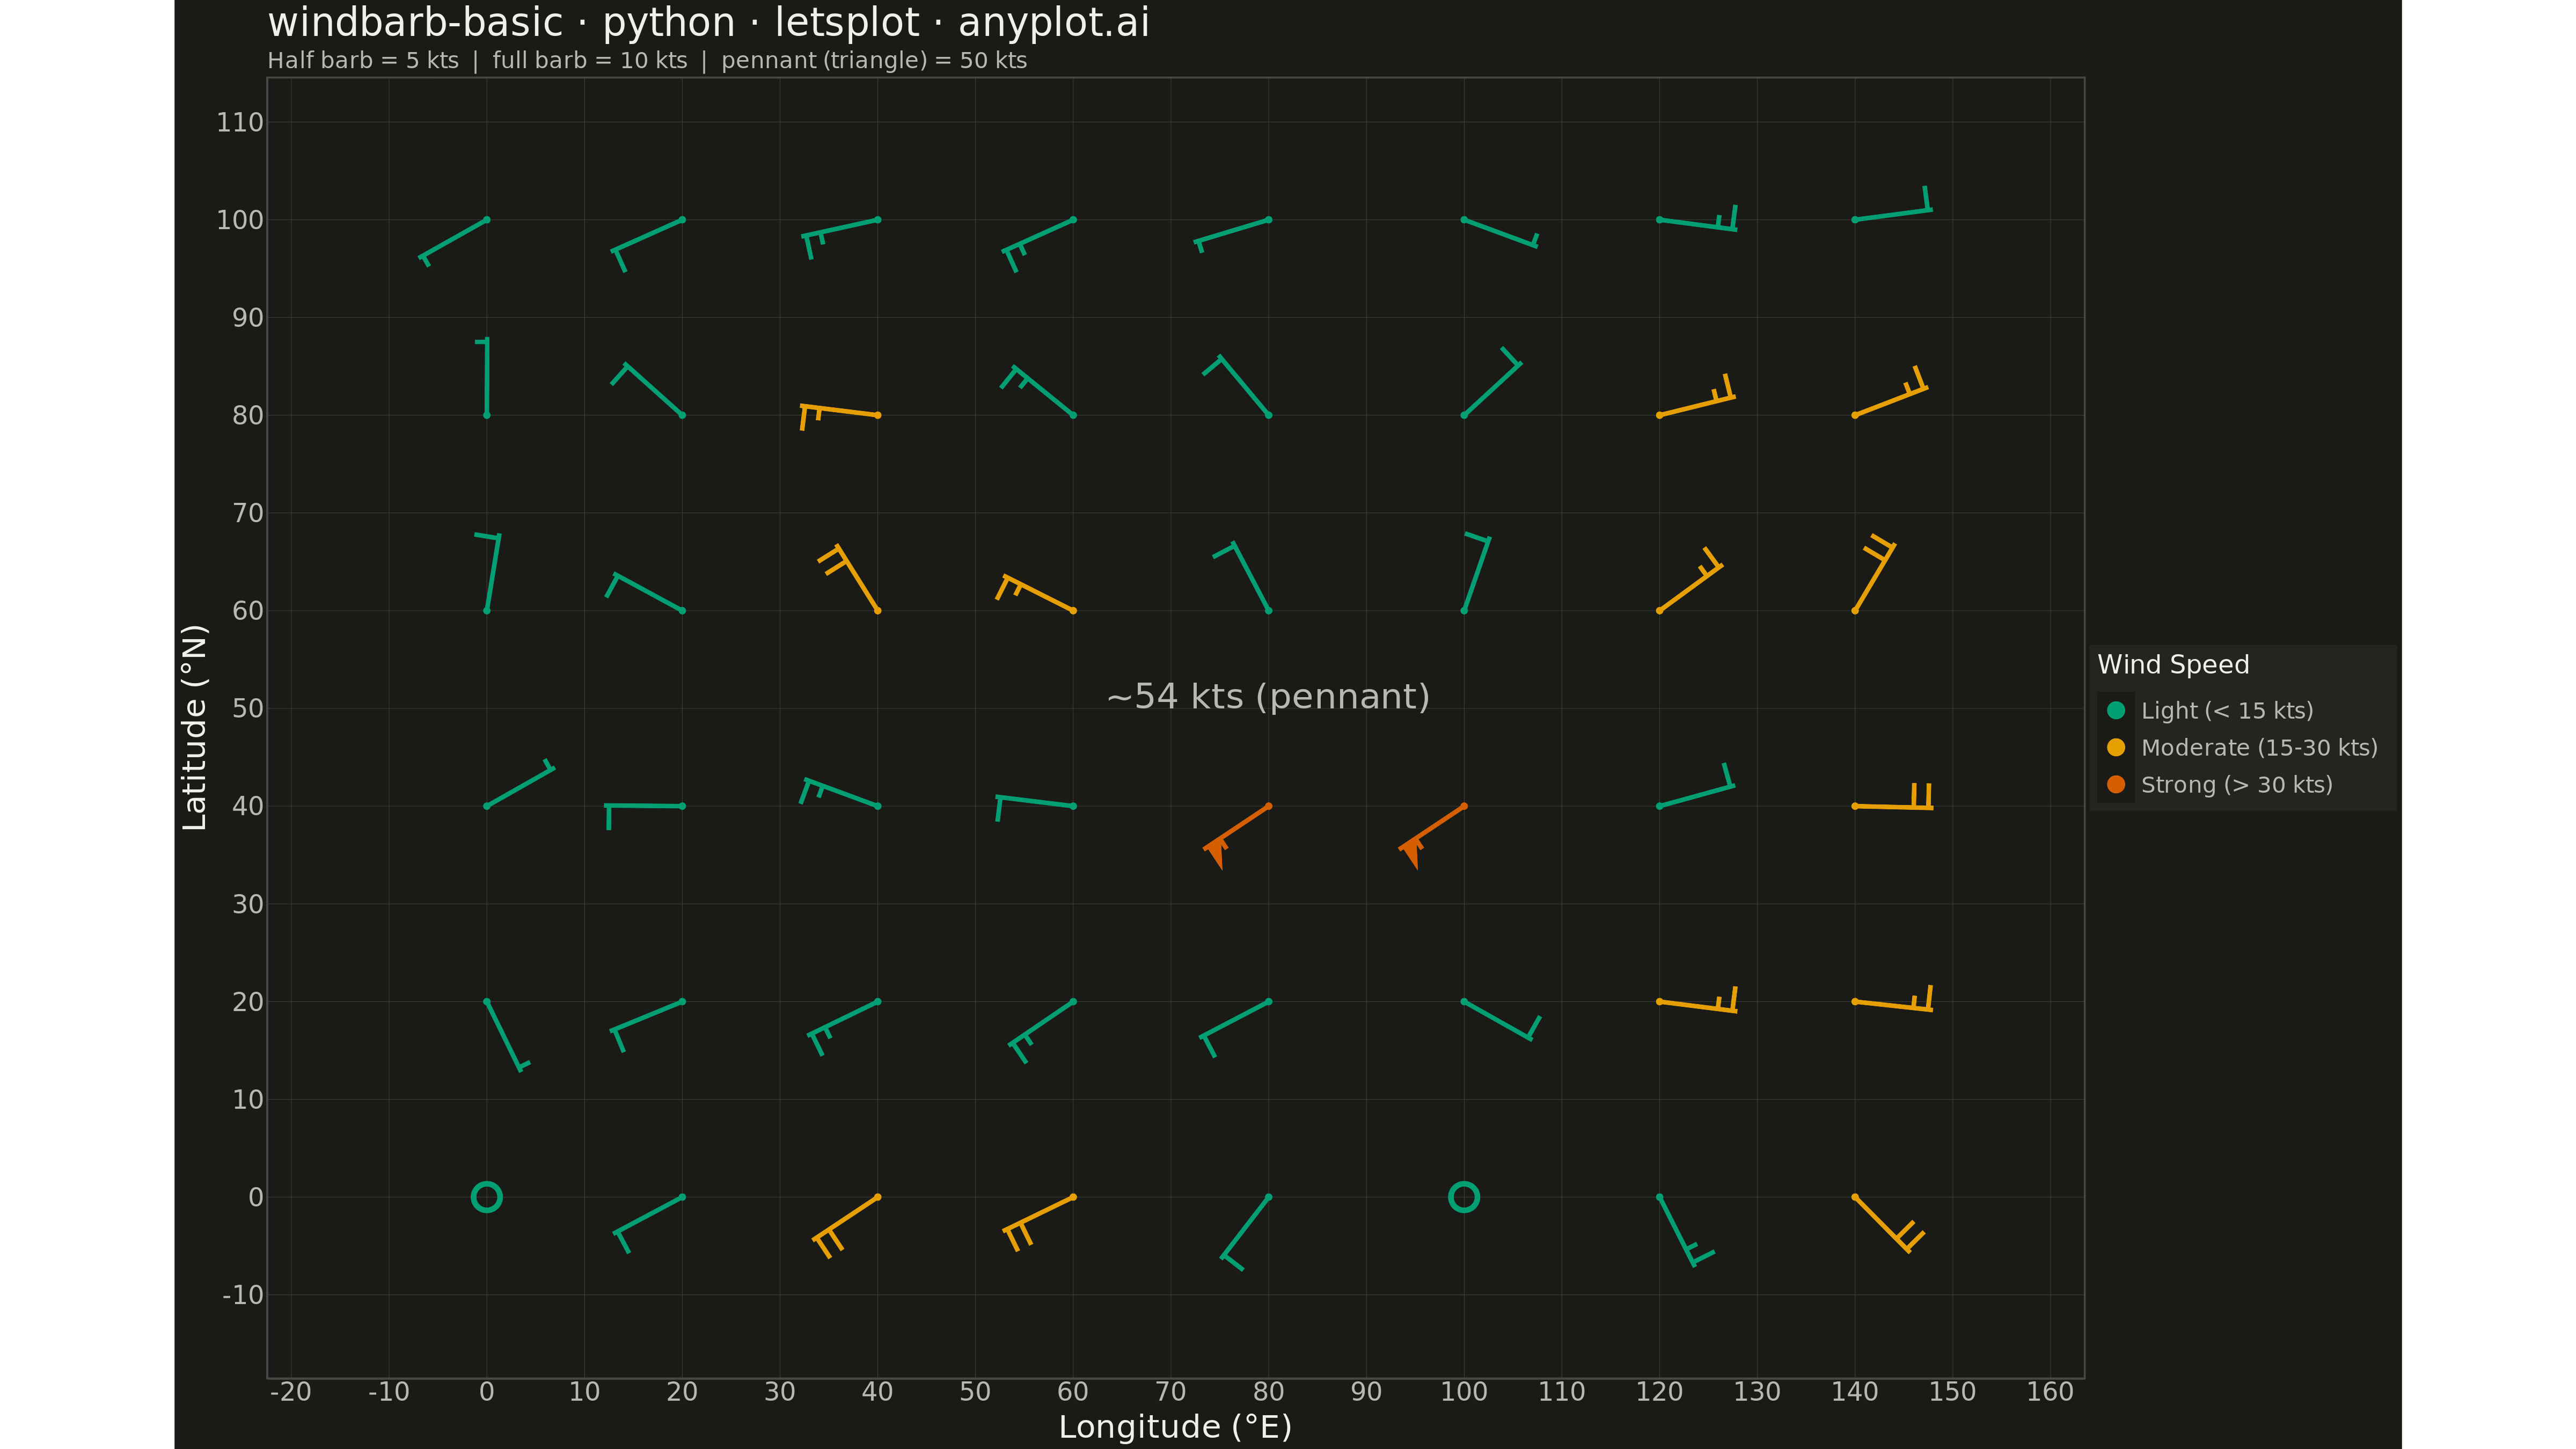
A wind barb plot displays wind speed and direction at specific locations using standard meteorological barb notation. Each barb consists of a staff pointing in the direction from which the wind blows, with short barbs (5 knots), long barbs (10 knots), and triangular pennants (50 knots) attached to indicate speed. This internationally recognized symbology enables rapid interpretation of wind patterns across weather maps and atmospheric data visualizations.
""" anyplot.ai
windbarb-basic: Wind Barb Plot for Meteorological Data
Library: letsplot 4.9.0 | Python 3.13.13
Quality: 87/100 | Updated: 2026-05-19
"""

import os

import numpy as np
import pandas as pd
from lets_plot import (
    LetsPlot,
    aes,
    coord_fixed,
    element_blank,
    element_line,
    element_rect,
    element_text,
    geom_point,
    geom_polygon,
    geom_segment,
    ggplot,
    ggsave,
    ggsize,
    labs,
    scale_x_continuous,
    scale_y_continuous,
    theme,
    theme_minimal,
)


LetsPlot.setup_html()

THEME = os.getenv("ANYPLOT_THEME", "light")
PAGE_BG = "#FAF8F1" if THEME == "light" else "#1A1A17"
INK = "#1A1A17" if THEME == "light" else "#F0EFE8"
INK_SOFT = "#4A4A44" if THEME == "light" else "#B8B7B0"
GRID_COLOR = "#CCCCCC" if THEME == "light" else "#3D3D3A"
BRAND = "#009E73"

np.random.seed(42)

# Generate grid of weather stations (8x6 grid = 48 stations)
n_x, n_y = 8, 6
x_coords = np.linspace(0, 140, n_x)
y_coords = np.linspace(0, 100, n_y)
X, Y = np.meshgrid(x_coords, y_coords)
x = X.flatten()
y = Y.flatten()

# Generate wind components (u = east-west, v = north-south) in knots
u = 15 * np.sin(x / 30) + np.random.normal(0, 3, len(x))
v = 10 * np.cos(y / 20) + np.random.normal(0, 3, len(y))

# Force calm winds at two stations (< 2.5 knots) for demonstration
calm_indices = [0, 5]
u[calm_indices] = 0.5
v[calm_indices] = 0.5

# Force high-speed winds at two stations (~54 knots) to demonstrate pennants
high_indices = [20, 21]
u[high_indices] = 45.0
v[high_indices] = 30.0

wind_speed = np.sqrt(u**2 + v**2)

# Wind barb geometry parameters
barb_length = 8
barb_spacing = 1.5
barb_tick_length = 2.5

# Build barb segments and pennant polygons for each station
segments = []
pennants = []

for i in range(len(x)):
    speed = np.sqrt(u[i] ** 2 + v[i] ** 2)
    angle = np.arctan2(-v[i], -u[i])

    if speed < 2.5:
        continue

    cos_a, sin_a = np.cos(angle), np.sin(angle)
    x_end = x[i] + barb_length * cos_a
    y_end = y[i] + barb_length * sin_a

    # Main staff
    segments.append({"x": x[i], "y": y[i], "xend": x_end, "yend": y_end})

    remaining_speed = speed
    barb_position = barb_length - 0.5
    perp_angle = angle + np.pi / 2

    # Pennants: 50 knots each (filled triangles)
    while remaining_speed >= 47.5:
        bx = x[i] + barb_position * cos_a
        by = y[i] + barb_position * sin_a
        tip_x = bx + barb_tick_length * np.cos(perp_angle)
        tip_y = by + barb_tick_length * np.sin(perp_angle)
        base_x = x[i] + (barb_position - barb_spacing) * cos_a
        base_y = y[i] + (barb_position - barb_spacing) * sin_a
        pennants.append({"x": [bx, tip_x, base_x], "y": [by, tip_y, base_y]})
        remaining_speed -= 50
        barb_position -= barb_spacing

    # Full barbs: 10 knots each
    while remaining_speed >= 7.5:
        bx = x[i] + barb_position * cos_a
        by = y[i] + barb_position * sin_a
        segments.append(
            {
                "x": bx,
                "y": by,
                "xend": bx + barb_tick_length * np.cos(perp_angle),
                "yend": by + barb_tick_length * np.sin(perp_angle),
            }
        )
        remaining_speed -= 10
        barb_position -= barb_spacing

    # Half barb: 5 knots
    if remaining_speed >= 2.5:
        bx = x[i] + barb_position * cos_a
        by = y[i] + barb_position * sin_a
        segments.append(
            {
                "x": bx,
                "y": by,
                "xend": bx + barb_tick_length * 0.5 * np.cos(perp_angle),
                "yend": by + barb_tick_length * 0.5 * np.sin(perp_angle),
            }
        )

segment_df = pd.DataFrame(segments)
station_df = pd.DataFrame({"x": x, "y": y, "speed": wind_speed})
calm_df = station_df[station_df["speed"] < 2.5].copy()

anyplot_theme = theme(
    plot_background=element_rect(fill=PAGE_BG, color=PAGE_BG),
    panel_background=element_rect(fill=PAGE_BG),
    panel_grid_major=element_line(color=GRID_COLOR, size=0.3),
    panel_grid_minor=element_blank(),
    axis_title=element_text(color=INK, size=20),
    axis_text=element_text(color=INK_SOFT, size=16),
    axis_line=element_line(color=INK_SOFT),
    plot_title=element_text(color=INK, size=24),
)

plot = ggplot() + theme_minimal() + anyplot_theme

# Staffs and barb ticks
if len(segment_df) > 0:
    plot = plot + geom_segment(aes(x="x", y="y", xend="xend", yend="yend"), data=segment_df, color=BRAND, size=1.2)

# Pennants as filled triangles
for pennant in pennants:
    pennant_df = pd.DataFrame({"x": pennant["x"], "y": pennant["y"]})
    plot = plot + geom_polygon(aes(x="x", y="y"), data=pennant_df, fill=BRAND, color=BRAND, size=0.5)

# Calm wind stations (open circles for speed < 2.5 knots)
if len(calm_df) > 0:
    plot = plot + geom_point(aes(x="x", y="y"), data=calm_df, shape=1, size=6, color=BRAND, stroke=1.5)

# Station center dots
plot = plot + geom_point(aes(x="x", y="y"), data=station_df, size=2, color=BRAND)

plot = (
    plot
    + labs(x="Longitude (°E)", y="Latitude (°N)", title="windbarb-basic · python · letsplot · anyplot.ai")
    + coord_fixed(ratio=1)
    + scale_x_continuous(expand=[0.1, 0])
    + scale_y_continuous(expand=[0.1, 0])
    + ggsize(1600, 900)
)

ggsave(plot, f"plot-{THEME}.png", path=".", scale=3)
ggsave(plot, f"plot-{THEME}.html", path=".")
Runnable source as JSON, for any HTTP client: https://api.anyplot.ai/specs/windbarb-basic/letsplot/code. Any spec id and library id listed in llms-full.txt fit the same URL shape; every URL below is complete and callable.
{
  "spec_id": "windbarb-basic",
  "language": "python",
  "library": "letsplot",
  "page": "https://anyplot.ai/windbarb-basic/python/letsplot",
  "hub": "https://anyplot.ai/windbarb-basic",
  "code_json": "https://api.anyplot.ai/specs/windbarb-basic/letsplot/code",
  "spec_json": "https://api.anyplot.ai/specs/windbarb-basic",
  "render_light_png": "https://storage.googleapis.com/anyplot-images/plots/windbarb-basic/python/letsplot/plot-light.png",
  "render_dark_png": "https://storage.googleapis.com/anyplot-images/plots/windbarb-basic/python/letsplot/plot-dark.png",
  "interactive_light_html": "https://storage.googleapis.com/anyplot-images/plots/windbarb-basic/python/letsplot/plot-light.html",
  "interactive_dark_html": "https://storage.googleapis.com/anyplot-images/plots/windbarb-basic/python/letsplot/plot-dark.html",
  "quality_score": 87.0,
  "license": "MIT",
  "guide": "https://anyplot.ai/llms.txt"
}
Part of Wind Barb Plot for Meteorological Data on anyplot.ai.