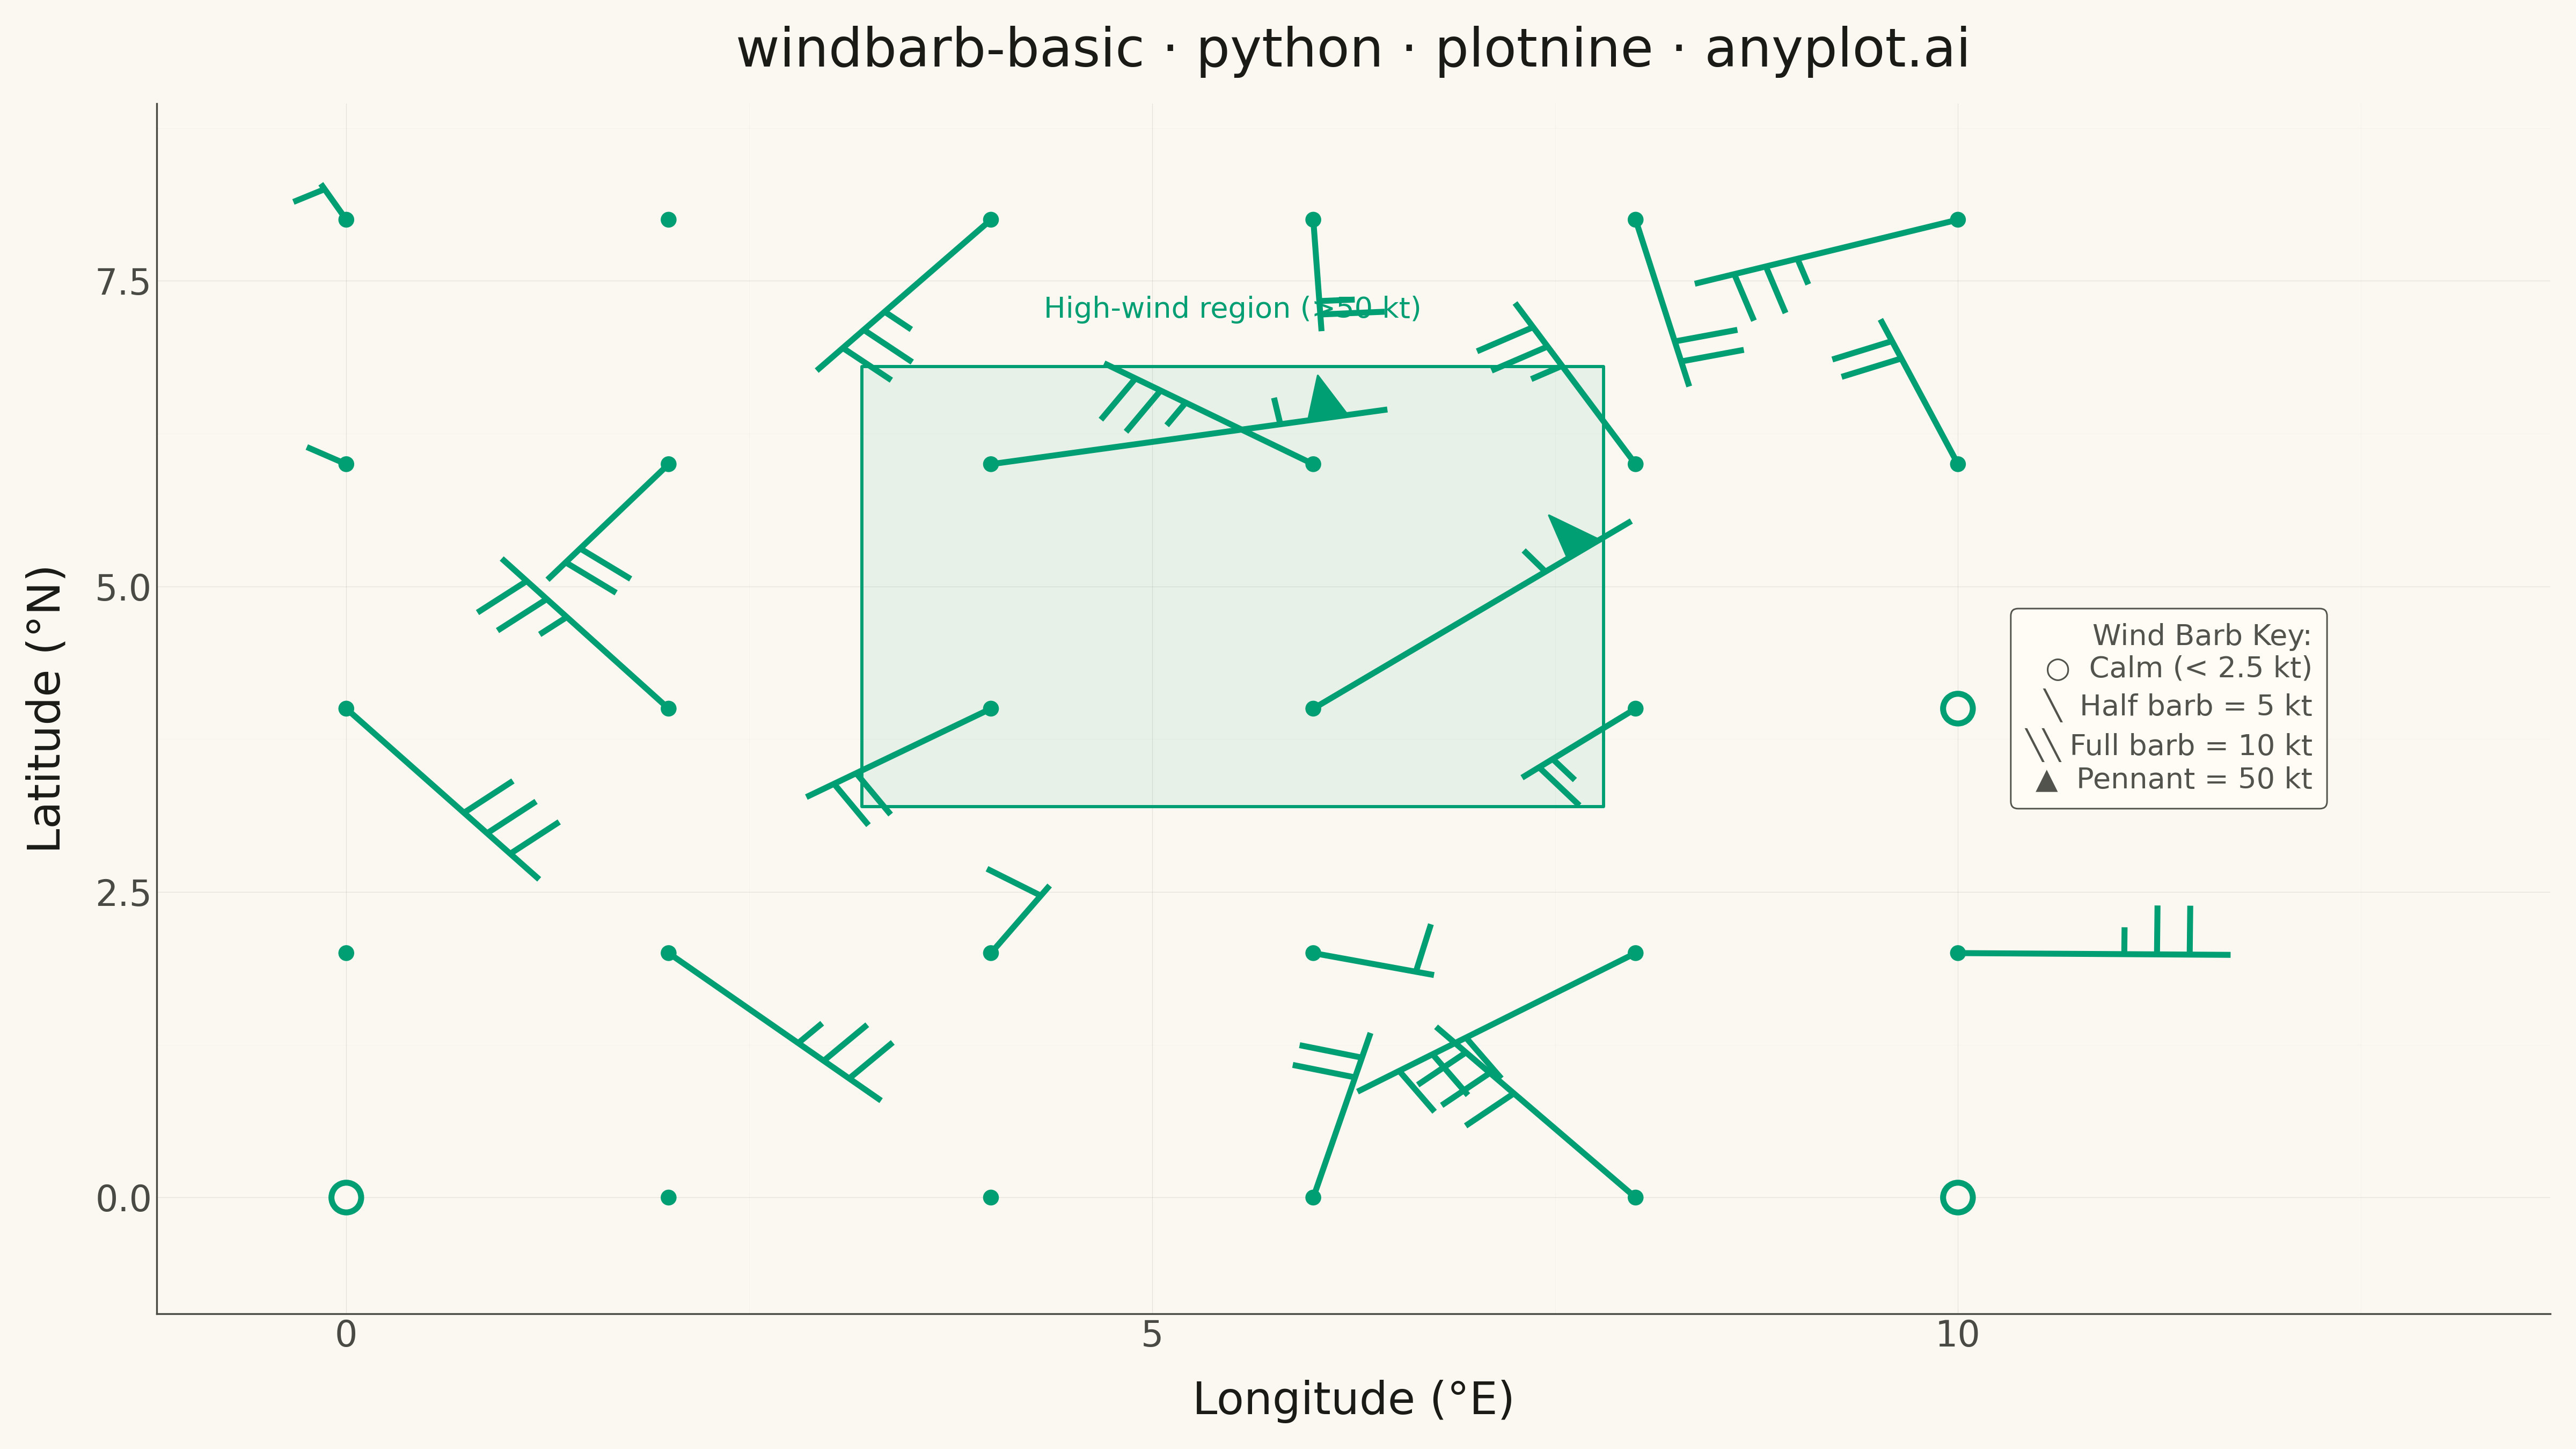
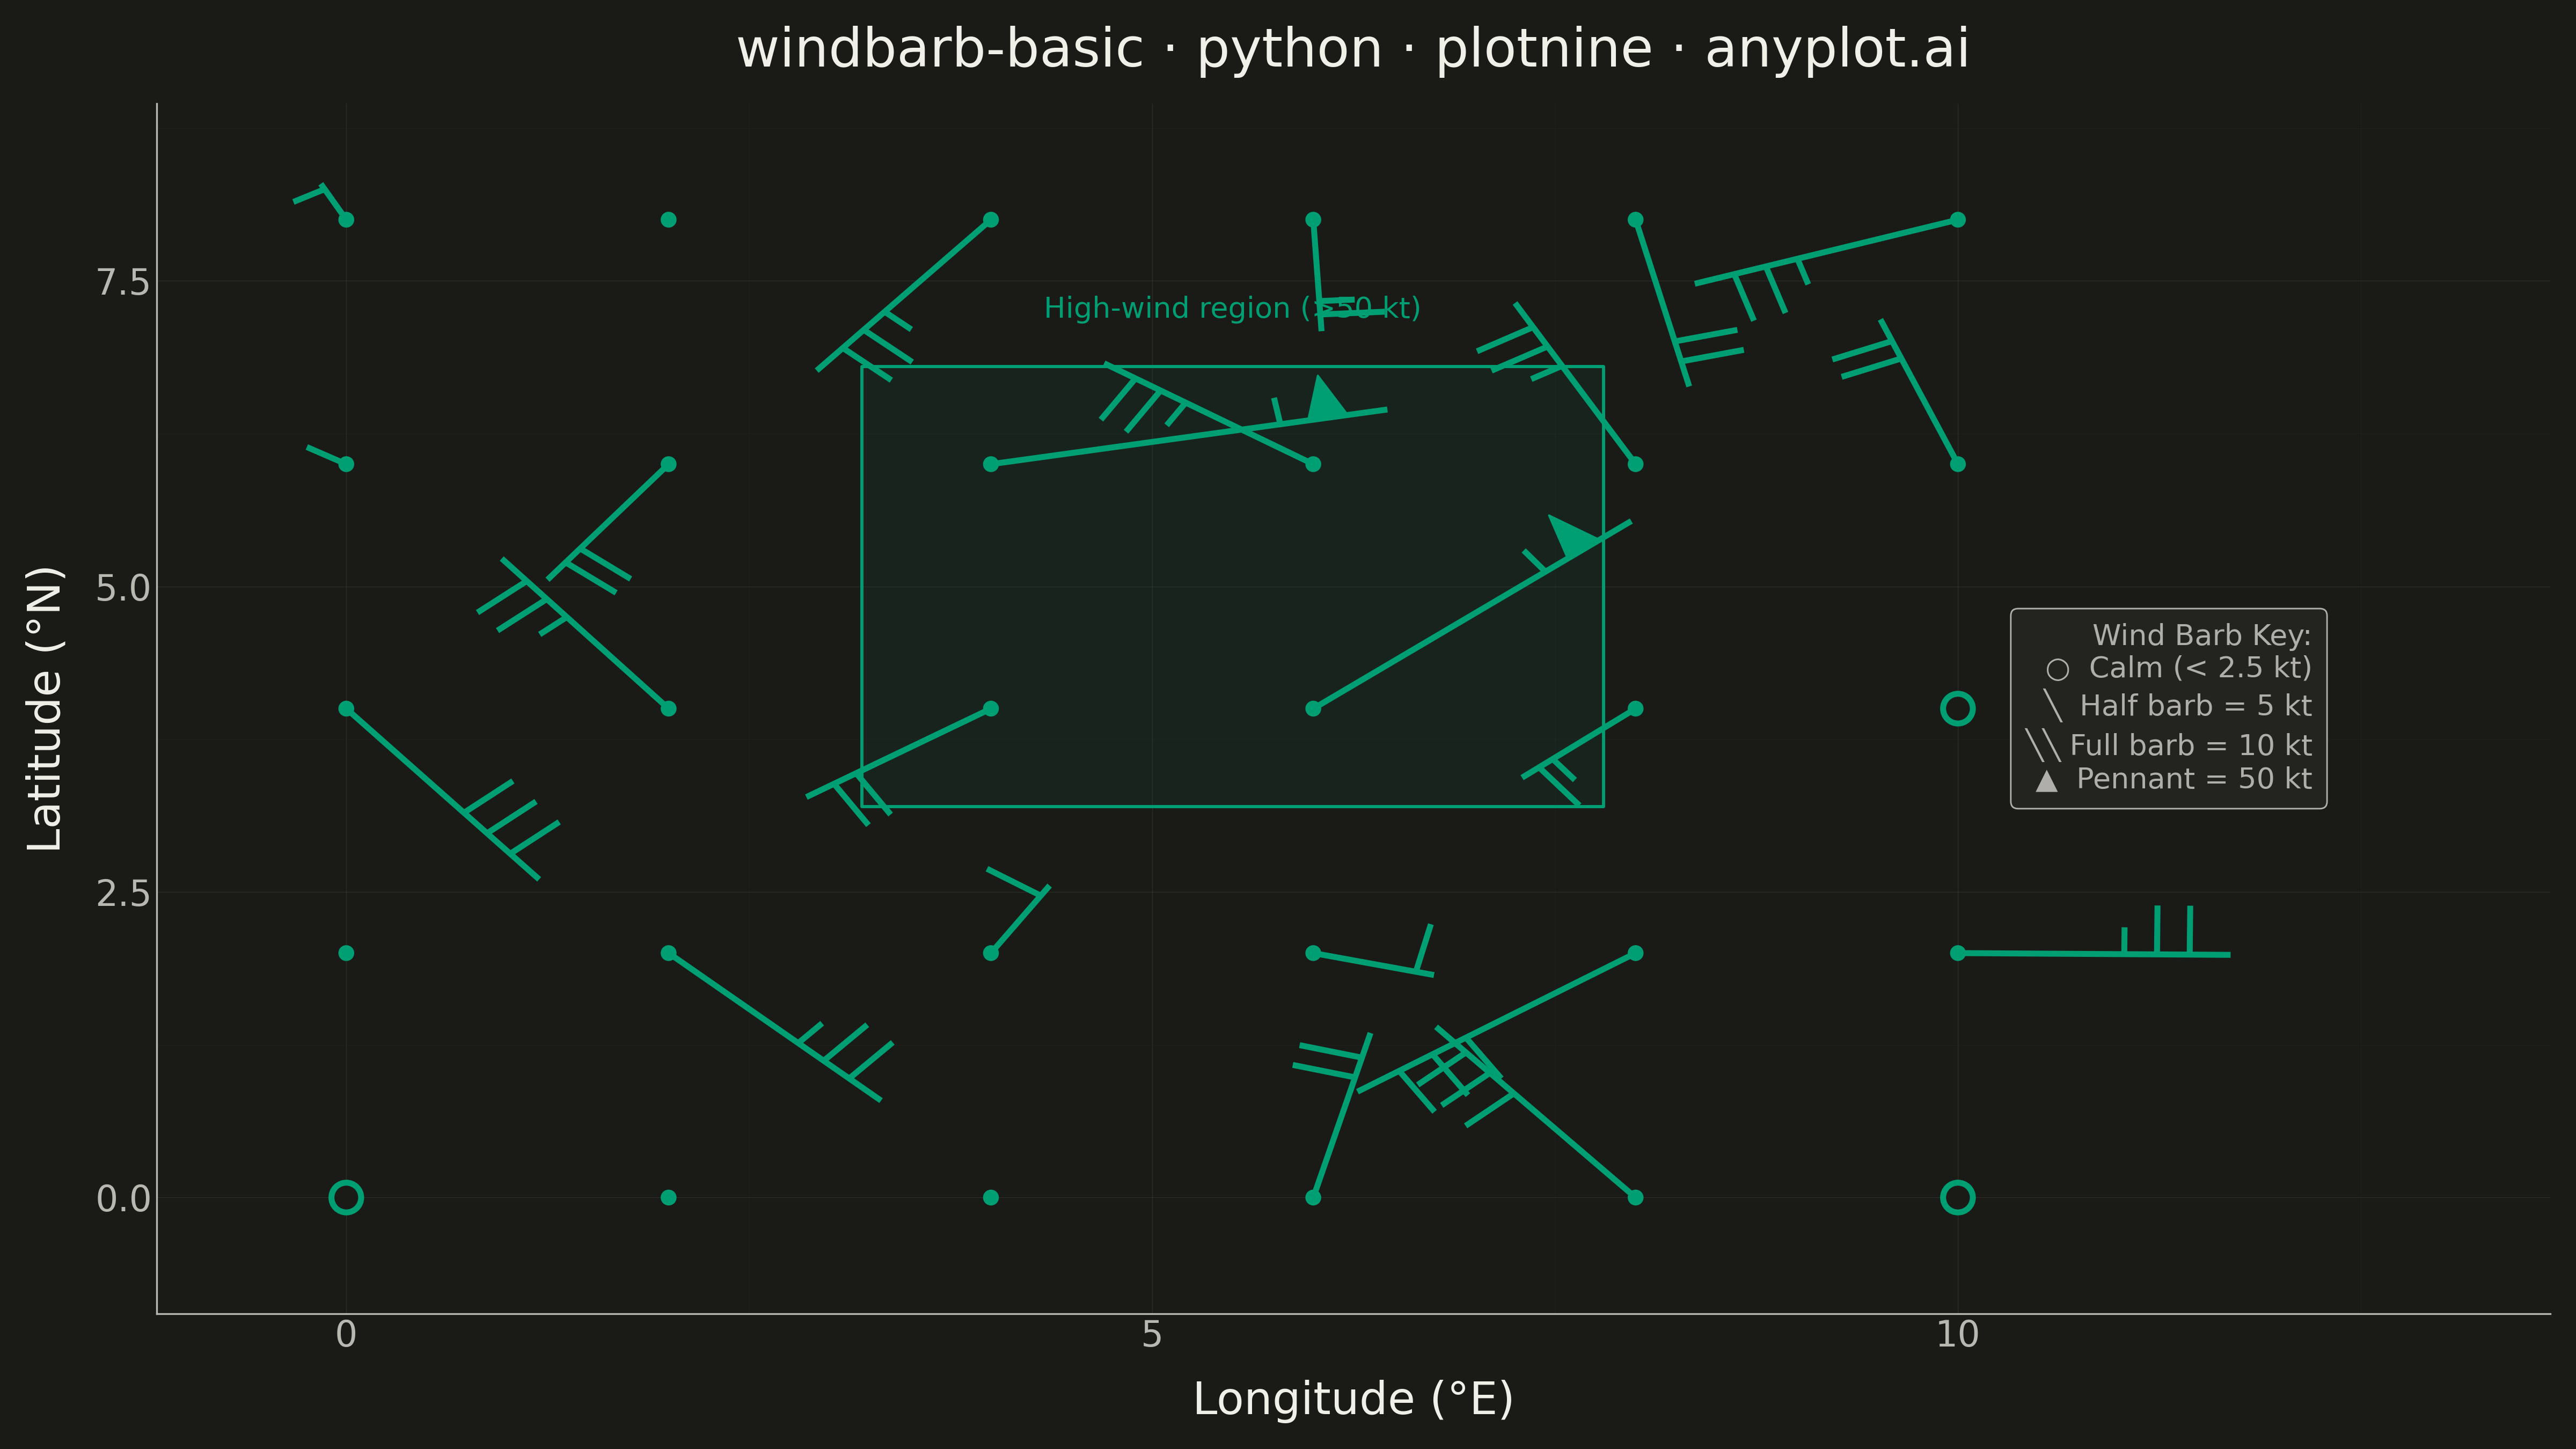
A wind barb plot displays wind speed and direction at specific locations using standard meteorological barb notation. Each barb consists of a staff pointing in the direction from which the wind blows, with short barbs (5 knots), long barbs (10 knots), and triangular pennants (50 knots) attached to indicate speed. This internationally recognized symbology enables rapid interpretation of wind patterns across weather maps and atmospheric data visualizations.
""" anyplot.ai
windbarb-basic: Wind Barb Plot for Meteorological Data
Library: plotnine 0.15.4 | Python 3.13.13
Quality: 86/100 | Updated: 2026-05-19
"""

import importlib
import os
import sys

import numpy as np
import pandas as pd


# This file is named plotnine.py, which shadows the plotnine library.
# Remove the script directory before importing the library.
_here = os.path.dirname(os.path.abspath(__file__))
if _here in sys.path:
    sys.path.remove(_here)
del _here

_pn = importlib.import_module("plotnine")
aes = _pn.aes
annotate = _pn.annotate
element_line = _pn.element_line
element_rect = _pn.element_rect
element_text = _pn.element_text
geom_point = _pn.geom_point
geom_polygon = _pn.geom_polygon
geom_segment = _pn.geom_segment
ggplot = _pn.ggplot
labs = _pn.labs
scale_x_continuous = _pn.scale_x_continuous
scale_y_continuous = _pn.scale_y_continuous
theme = _pn.theme
theme_minimal = _pn.theme_minimal
del _pn

# Theme tokens
THEME = os.getenv("ANYPLOT_THEME", "light")
PAGE_BG = "#FAF8F1" if THEME == "light" else "#1A1A17"
ELEVATED_BG = "#FFFDF6" if THEME == "light" else "#242420"
INK = "#1A1A17" if THEME == "light" else "#F0EFE8"
INK_SOFT = "#4A4A44" if THEME == "light" else "#B8B7B0"
BRAND = "#009E73"  # Okabe-Ito position 1

# Data - Surface wind observations from a grid of weather stations
np.random.seed(42)

# Create a grid of observation points (6x5 grid = 30 stations)
x_coords = np.linspace(0, 10, 6)
y_coords = np.linspace(0, 8, 5)
xx, yy = np.meshgrid(x_coords, y_coords)
x = xx.flatten()
y = yy.flatten()

# Generate wind components (u: east-west, v: north-south) in knots
u = np.random.uniform(-30, 30, len(x))
v = np.random.uniform(-25, 25, len(x))

# Force calm conditions (< 2.5 knots)
u[0] = 0.5
v[0] = 0.3
u[5] = 1.0
v[5] = -0.8

# Force high winds with pennants (50+ knots)
u[15] = 45
v[15] = 35
u[20] = 55
v[20] = 10

# Calculate wind speed and direction
wind_speed = np.sqrt(u**2 + v**2)
# Direction FROM which wind blows (meteorological convention)
wind_direction_rad = np.arctan2(-u, -v)

# Build wind barb components: staffs, barb flags, pennants, calm circles
staff_records = []
barb_records = []
pennant_records = []
calm_records = []

scale = 0.06  # Scale factor for staff length

for i in range(len(x)):
    speed = wind_speed[i]

    if speed < 2.5:
        calm_records.append({"x": x[i], "y": y[i], "speed": speed})
    else:
        dir_rad = wind_direction_rad[i]
        ux = -np.sin(dir_rad)
        uy = -np.cos(dir_rad)

        staff_len = min(speed * scale, 2.5)
        x2 = x[i] + ux * staff_len
        y2 = y[i] + uy * staff_len
        staff_records.append({"x": x[i], "y": y[i], "xend": x2, "yend": y2, "speed": speed})

        # Perpendicular vector for barb flags (left side, Northern Hemisphere)
        px = -uy
        py = ux

        remaining_speed = speed
        barb_pos = 0.85
        barb_idx = 0

        # Pennants (50 knots each)
        pennant_id = 0
        while remaining_speed >= 50 and barb_idx < 3:
            pos_factor = barb_pos - barb_idx * 0.15
            bx = x[i] + ux * staff_len * pos_factor
            by = y[i] + uy * staff_len * pos_factor

            tri_base = 0.25
            tri_height = 0.35
            tip_x = bx + px * tri_height
            tip_y = by + py * tri_height
            base1_x = bx - ux * tri_base / 2
            base1_y = by - uy * tri_base / 2
            base2_x = bx + ux * tri_base / 2
            base2_y = by + uy * tri_base / 2

            group_id = f"{i}_{pennant_id}"
            pennant_records.append({"x": base1_x, "y": base1_y, "group": group_id, "order": 1})
            pennant_records.append({"x": tip_x, "y": tip_y, "group": group_id, "order": 2})
            pennant_records.append({"x": base2_x, "y": base2_y, "group": group_id, "order": 3})

            remaining_speed -= 50
            barb_idx += 1
            pennant_id += 1

        # Full barbs (10 knots each)
        while remaining_speed >= 10 and barb_idx < 8:
            pos_factor = barb_pos - barb_idx * 0.12
            bx = x[i] + ux * staff_len * pos_factor
            by = y[i] + uy * staff_len * pos_factor
            barb_len = 0.40
            barb_records.append(
                {"x": bx, "y": by, "xend": bx + px * barb_len, "yend": by + py * barb_len, "type": "full"}
            )
            remaining_speed -= 10
            barb_idx += 1

        # Half barb (5 knots)
        if remaining_speed >= 5:
            pos_factor = barb_pos - barb_idx * 0.12
            bx = x[i] + ux * staff_len * pos_factor
            by = y[i] + uy * staff_len * pos_factor
            barb_len = 0.22
            barb_records.append(
                {"x": bx, "y": by, "xend": bx + px * barb_len, "yend": by + py * barb_len, "type": "half"}
            )

# Create DataFrames
staff_df = pd.DataFrame(staff_records) if staff_records else pd.DataFrame(columns=["x", "y", "xend", "yend", "speed"])
barb_df = pd.DataFrame(barb_records) if barb_records else pd.DataFrame(columns=["x", "y", "xend", "yend", "type"])
pennant_df = pd.DataFrame(pennant_records) if pennant_records else pd.DataFrame(columns=["x", "y", "group", "order"])
calm_df = pd.DataFrame(calm_records) if calm_records else pd.DataFrame(columns=["x", "y", "speed"])

# Plot - layer composition using grammar of graphics
plot = (
    ggplot()
    + geom_segment(data=staff_df, mapping=aes(x="x", y="y", xend="xend", yend="yend"), color=BRAND, size=1.5)
    + geom_point(data=staff_df, mapping=aes(x="x", y="y"), color=BRAND, size=3)
)

if len(barb_df) > 0:
    plot = plot + geom_segment(data=barb_df, mapping=aes(x="x", y="y", xend="xend", yend="yend"), color=BRAND, size=1.5)

if len(pennant_df) > 0:
    plot = plot + geom_polygon(
        data=pennant_df, mapping=aes(x="x", y="y", group="group"), fill=BRAND, color=BRAND, size=0.5
    )

if len(calm_df) > 0:
    plot = plot + geom_point(data=calm_df, mapping=aes(x="x", y="y"), color=BRAND, fill=PAGE_BG, size=6, stroke=1.5)

# Legend annotation positioned in the right margin outside the data area
legend_text = "Wind Barb Key:\n○  Calm (< 2.5 kt)\n╲  Half barb = 5 kt\n╲╲ Full barb = 10 kt\n▲  Pennant = 50 kt"

plot = (
    plot
    + annotate(
        "label",
        x=13.8,
        y=4.0,
        label=legend_text,
        size=11,
        ha="right",
        va="center",
        fill=ELEVATED_BG,
        alpha=0.95,
        label_padding=0.5,
        color=INK_SOFT,
    )
    + scale_x_continuous(limits=(-0.5, 14))
    + scale_y_continuous(limits=(-0.5, 8.5))
    + labs(x="Longitude (°E)", y="Latitude (°N)", title="windbarb-basic · python · plotnine · anyplot.ai")
    + theme_minimal()
    + theme(
        figure_size=(16, 9),
        plot_background=element_rect(fill=PAGE_BG, color=PAGE_BG),
        panel_background=element_rect(fill=PAGE_BG),
        panel_border=element_rect(color=INK_SOFT, fill=None),
        text=element_text(size=14, color=INK),
        axis_title=element_text(size=20, color=INK),
        axis_text=element_text(size=16, color=INK_SOFT),
        plot_title=element_text(size=24, color=INK),
        panel_grid_major=element_line(color=INK_SOFT, size=0.3, alpha=0.12),
        panel_grid_minor=element_line(color=INK_SOFT, size=0.15, alpha=0.06),
    )
)

# Save
plot.save(f"plot-{THEME}.png", dpi=300, verbose=False)
Runnable source as JSON, for any HTTP client: https://api.anyplot.ai/specs/windbarb-basic/plotnine/code. Any spec id and library id listed in llms-full.txt fit the same URL shape; every URL below is complete and callable.
{
  "spec_id": "windbarb-basic",
  "language": "python",
  "library": "plotnine",
  "page": "https://anyplot.ai/windbarb-basic/python/plotnine",
  "hub": "https://anyplot.ai/windbarb-basic",
  "code_json": "https://api.anyplot.ai/specs/windbarb-basic/plotnine/code",
  "spec_json": "https://api.anyplot.ai/specs/windbarb-basic",
  "render_light_png": "https://storage.googleapis.com/anyplot-images/plots/windbarb-basic/python/plotnine/plot-light.png",
  "render_dark_png": "https://storage.googleapis.com/anyplot-images/plots/windbarb-basic/python/plotnine/plot-dark.png",
  "quality_score": 86.0,
  "license": "MIT",
  "guide": "https://anyplot.ai/llms.txt"
}
Part of Wind Barb Plot for Meteorological Data on anyplot.ai.