The same plot in 14 other libraries — JavaScript: D3.js, Apache ECharts, Highcharts, MUI X Charts; Python: Altair, Bokeh, lets-plot, Matplotlib, Plotly, plotnine, Pygal, Seaborn; R: ggplot2; Julia: Makie.jl. Compare all 15 side by side: Wind Barb Plot for Meteorological Data in Python, R, Julia and JavaScript.
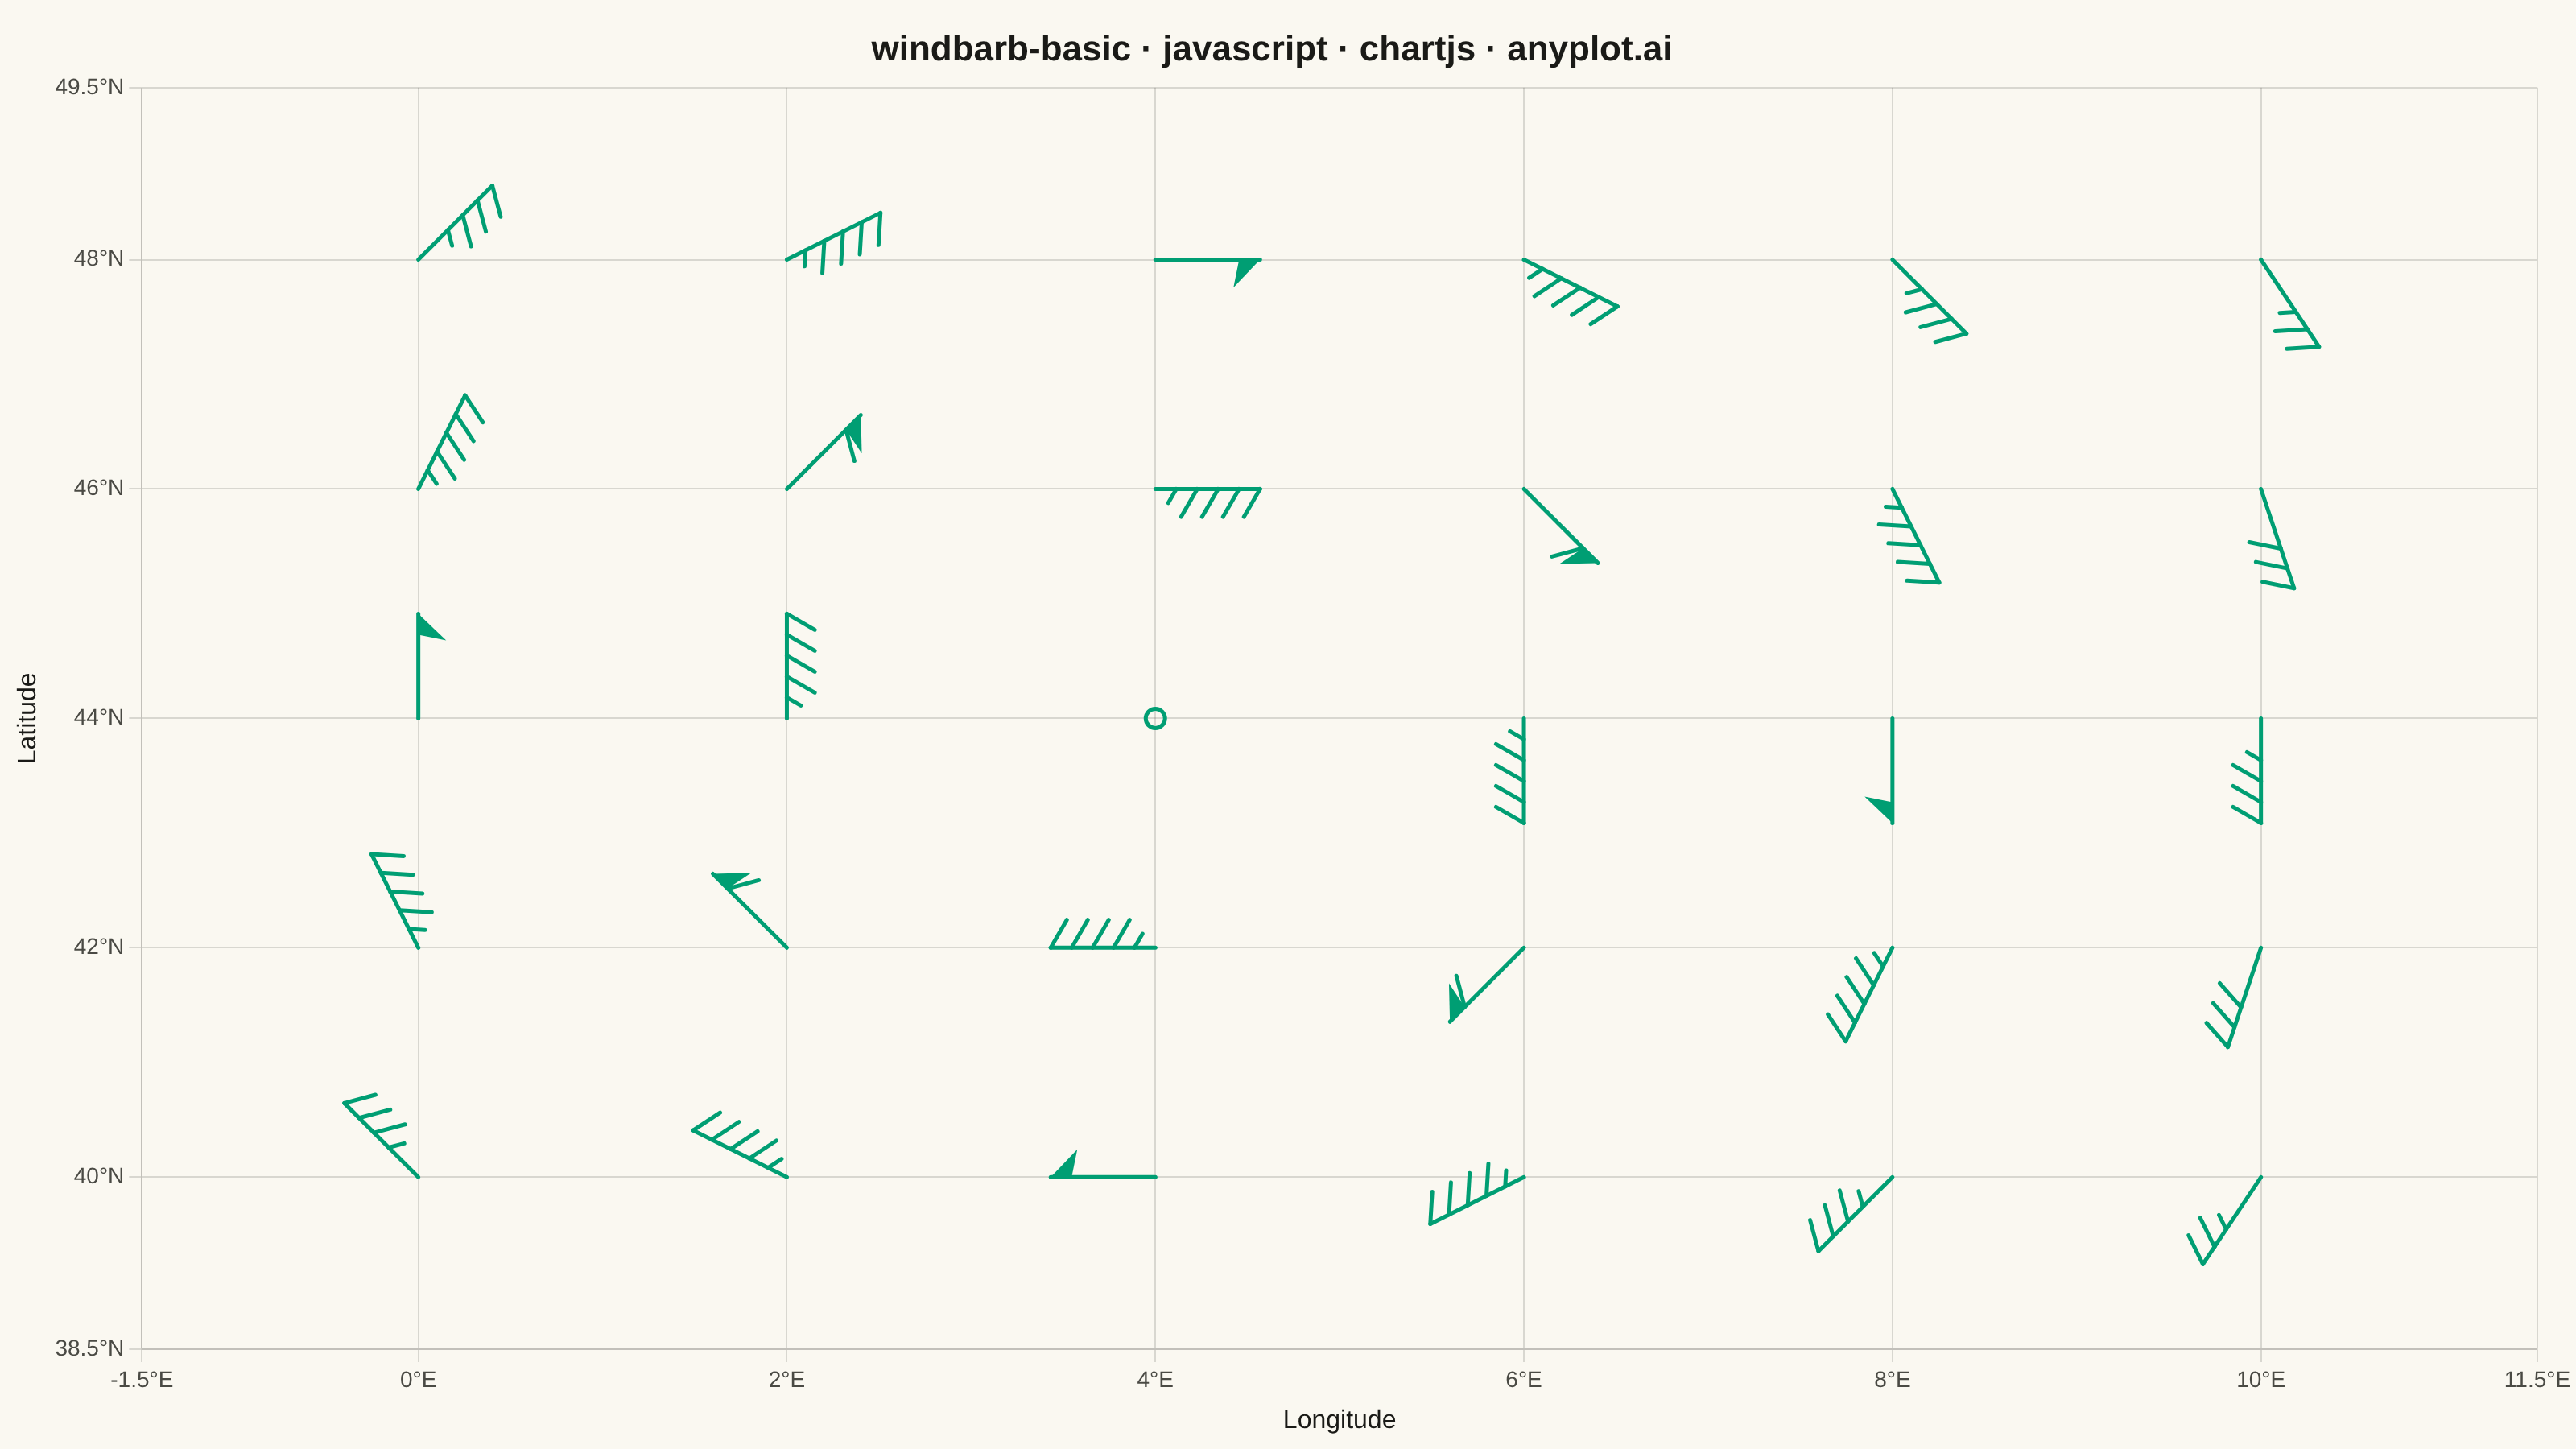
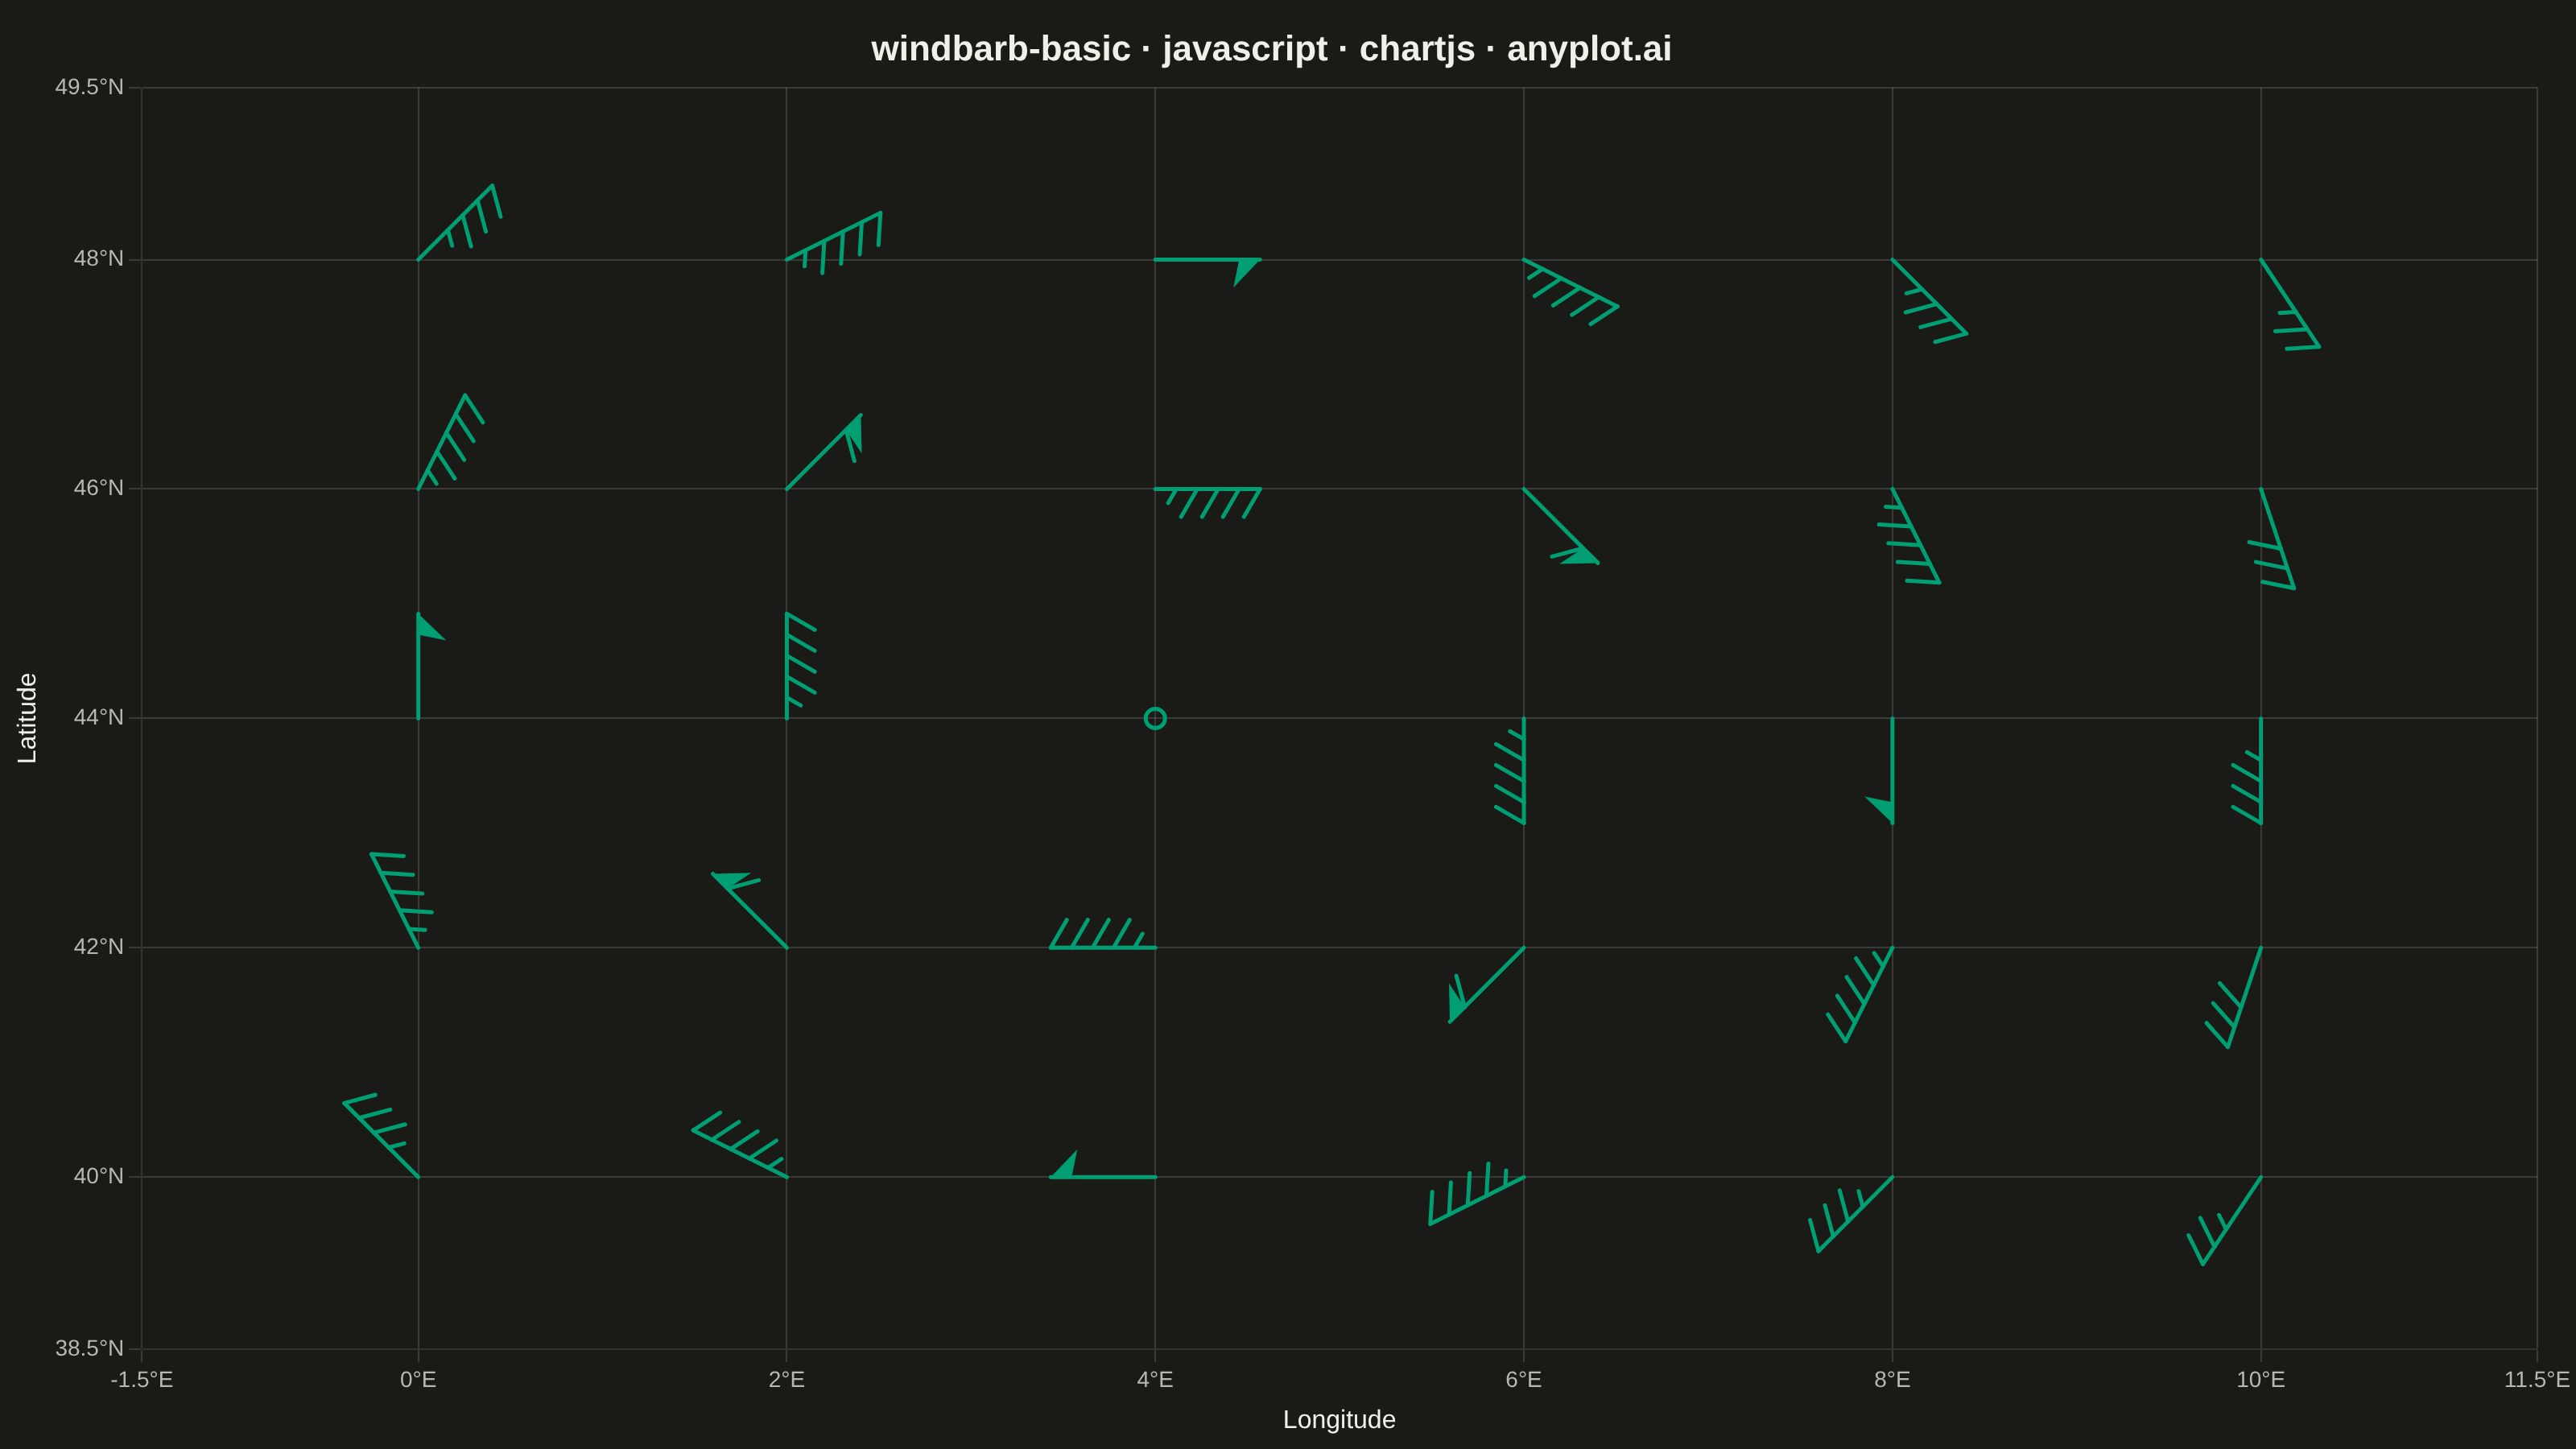
A wind barb plot displays wind speed and direction at specific locations using standard meteorological barb notation. Each barb consists of a staff pointing in the direction from which the wind blows, with short barbs (5 knots), long barbs (10 knots), and triangular pennants (50 knots) attached to indicate speed. This internationally recognized symbology enables rapid interpretation of wind patterns across weather maps and atmospheric data visualizations.
// anyplot.ai
// windbarb-basic: Wind Barb Plot for Meteorological Data
// Library: chartjs 4.4.7 | JavaScript 22.23.2
// Quality: 90/100 | Created: 2026-09-02

const t = window.ANYPLOT_TOKENS;

// --- Data (in-memory, deterministic) ----------------------------------------
// Synthetic surface-station grid over a regional domain, with a low-pressure
// vortex (Rankine profile, counterclockwise / cyclonic — Northern Hemisphere)
// centred on one of the grid points so the demo also exercises the calm case.
const LONS = [0, 2, 4, 6, 8, 10];
const LATS = [40, 42, 44, 46, 48];
const CENTER = { lon: 4, lat: 44 };
const R_MAX = 3; // radius (deg) of peak tangential wind
const V_MAX = 65; // peak tangential speed (knots) — exceeds 50kt so a pennant appears

const stations = [];
for (const lat of LATS) {
  for (const lon of LONS) {
    const dx = lon - CENTER.lon;
    const dy = lat - CENTER.lat;
    const r = Math.sqrt(dx * dx + dy * dy);
    let u = 0;
    let v = 0;
    if (r > 1e-9) {
      const speed = r <= R_MAX ? (V_MAX * r) / R_MAX : (V_MAX * R_MAX) / r;
      // Tangential (counterclockwise) unit vector around the vortex center.
      const tx = -dy / r;
      const ty = dx / r;
      u = speed * tx;
      v = speed * ty;
    }
    stations.push({ x: lon, y: lat, u, v });
  }
}

// --- Mount -------------------------------------------------------------------
const canvas = document.createElement("canvas");
document.getElementById("container").appendChild(canvas);

// --- Wind barb rendering plugin ----------------------------------------------
const STAFF_LEN = 65; // px, station to barb tip
const BARB_LEN = 20; // px, feather length
const BARB_SPACING = 13; // px, spacing between feathers along the staff
const PENNANT_WIDTH = 13; // px, base width of a 50kt pennant along the staff
const CALM_RADIUS = 6; // px, open circle for calm winds

const rotate = (v, deg) => {
  const a = (deg * Math.PI) / 180;
  const cos = Math.cos(a);
  const sin = Math.sin(a);
  return { x: v.x * cos - v.y * sin, y: v.x * sin + v.y * cos };
};

const decomposeKnots = (speed) => {
  let remaining = Math.round(speed / 5) * 5;
  const pennants = Math.floor(remaining / 50);
  remaining -= pennants * 50;
  const fullBarbs = Math.floor(remaining / 10);
  remaining -= fullBarbs * 10;
  const halfBarb = remaining >= 5 ? 1 : 0;
  return { pennants, fullBarbs, halfBarb };
};

const windBarbPlugin = {
  id: "windBarbPlugin",
  afterDatasetsDraw(chart) {
    const ctx = chart.ctx;
    const meta = chart.getDatasetMeta(0);
    const data = chart.data.datasets[0].data;

    ctx.save();
    ctx.strokeStyle = t.palette[0];
    ctx.fillStyle = t.palette[0];
    ctx.lineWidth = 2.5;
    ctx.lineCap = "round";

    data.forEach((point, i) => {
      const cx = meta.data[i].x;
      const cy = meta.data[i].y;
      const speed = Math.sqrt(point.u * point.u + point.v * point.v);

      // Calm winds: open circle, no staff (spec: < 2.5 knots).
      if (speed < 2.5) {
        ctx.beginPath();
        ctx.arc(cx, cy, CALM_RADIUS, 0, 2 * Math.PI);
        ctx.stroke();
        return;
      }

      // Staff points FROM the direction the wind blows (opposite of the
      // (u, v) motion vector). Canvas y grows downward, so a northward (+v)
      // component maps to a negative screen dy.
      const staffDir = { x: -point.u / speed, y: point.v / speed };
      const tip = { x: cx + staffDir.x * STAFF_LEN, y: cy + staffDir.y * STAFF_LEN };

      ctx.beginPath();
      ctx.moveTo(cx, cy);
      ctx.lineTo(tip.x, tip.y);
      ctx.stroke();

      // Feathers swept back from the staff, consistently on one side.
      const barbDir = rotate(staffDir, 120);
      const attach = (dist) => ({
        x: cx + staffDir.x * dist,
        y: cy + staffDir.y * dist,
      });

      const { pennants, fullBarbs, halfBarb } = decomposeKnots(speed);
      let dist = STAFF_LEN;

      for (let p = 0; p < pennants; p += 1) {
        const base1 = attach(dist);
        const base2 = attach(dist - PENNANT_WIDTH);
        const mid = { x: (base1.x + base2.x) / 2, y: (base1.y + base2.y) / 2 };
        const apex = { x: mid.x + barbDir.x * BARB_LEN, y: mid.y + barbDir.y * BARB_LEN };
        ctx.beginPath();
        ctx.moveTo(base1.x, base1.y);
        ctx.lineTo(base2.x, base2.y);
        ctx.lineTo(apex.x, apex.y);
        ctx.closePath();
        ctx.fill();
        dist -= PENNANT_WIDTH;
      }

      for (let b = 0; b < fullBarbs; b += 1) {
        const p0 = attach(dist);
        const p1 = { x: p0.x + barbDir.x * BARB_LEN, y: p0.y + barbDir.y * BARB_LEN };
        ctx.beginPath();
        ctx.moveTo(p0.x, p0.y);
        ctx.lineTo(p1.x, p1.y);
        ctx.stroke();
        dist -= BARB_SPACING;
      }

      if (halfBarb) {
        const p0 = attach(dist);
        const p1 = { x: p0.x + barbDir.x * BARB_LEN * 0.5, y: p0.y + barbDir.y * BARB_LEN * 0.5 };
        ctx.beginPath();
        ctx.moveTo(p0.x, p0.y);
        ctx.lineTo(p1.x, p1.y);
        ctx.stroke();
      }
    });

    ctx.restore();
  },
};

// --- Chart ---------------------------------------------------------------
new Chart(canvas, {
  type: "scatter",
  data: {
    datasets: [
      {
        label: "Surface stations",
        data: stations,
        pointRadius: 0,
        showLine: false,
      },
    ],
  },
  options: {
    responsive: true,
    maintainAspectRatio: false,
    animation: false,
    layout: { padding: { top: 8, right: 24, bottom: 4, left: 4 } },
    plugins: {
      title: {
        display: true,
        text: "windbarb-basic · javascript · chartjs · anyplot.ai",
        color: t.ink,
        font: { size: 22 },
      },
      legend: { display: false },
    },
    scales: {
      x: {
        type: "linear",
        min: -1.5,
        max: 11.5,
        ticks: { color: t.inkSoft, font: { size: 14 }, stepSize: 2, callback: (v) => `${v}°E` },
        grid: { color: t.grid },
        title: { display: true, text: "Longitude", color: t.ink, font: { size: 16 } },
      },
      y: {
        type: "linear",
        min: 38.5,
        max: 49.5,
        ticks: { color: t.inkSoft, font: { size: 14 }, stepSize: 2, callback: (v) => `${v}°N` },
        grid: { color: t.grid },
        title: { display: true, text: "Latitude", color: t.ink, font: { size: 16 } },
      },
    },
  },
  plugins: [windBarbPlugin],
});
Runnable source as JSON, for any HTTP client: https://api.anyplot.ai/specs/windbarb-basic/chartjs/code. Any spec id and library id listed in llms-full.txt fit the same URL shape; every URL below is complete and callable.
{
  "spec_id": "windbarb-basic",
  "language": "javascript",
  "library": "chartjs",
  "page": "https://anyplot.ai/windbarb-basic/javascript/chartjs",
  "hub": "https://anyplot.ai/windbarb-basic",
  "code_json": "https://api.anyplot.ai/specs/windbarb-basic/chartjs/code",
  "spec_json": "https://api.anyplot.ai/specs/windbarb-basic",
  "render_light_png": "https://storage.googleapis.com/anyplot-images/plots/windbarb-basic/javascript/chartjs/plot-light.png",
  "render_dark_png": "https://storage.googleapis.com/anyplot-images/plots/windbarb-basic/javascript/chartjs/plot-dark.png",
  "interactive_light_html": "https://storage.googleapis.com/anyplot-images/plots/windbarb-basic/javascript/chartjs/plot-light.html",
  "interactive_dark_html": "https://storage.googleapis.com/anyplot-images/plots/windbarb-basic/javascript/chartjs/plot-dark.html",
  "quality_score": 90.0,
  "license": "MIT",
  "guide": "https://anyplot.ai/llms.txt"
}
Part of Wind Barb Plot for Meteorological Data on anyplot.ai.