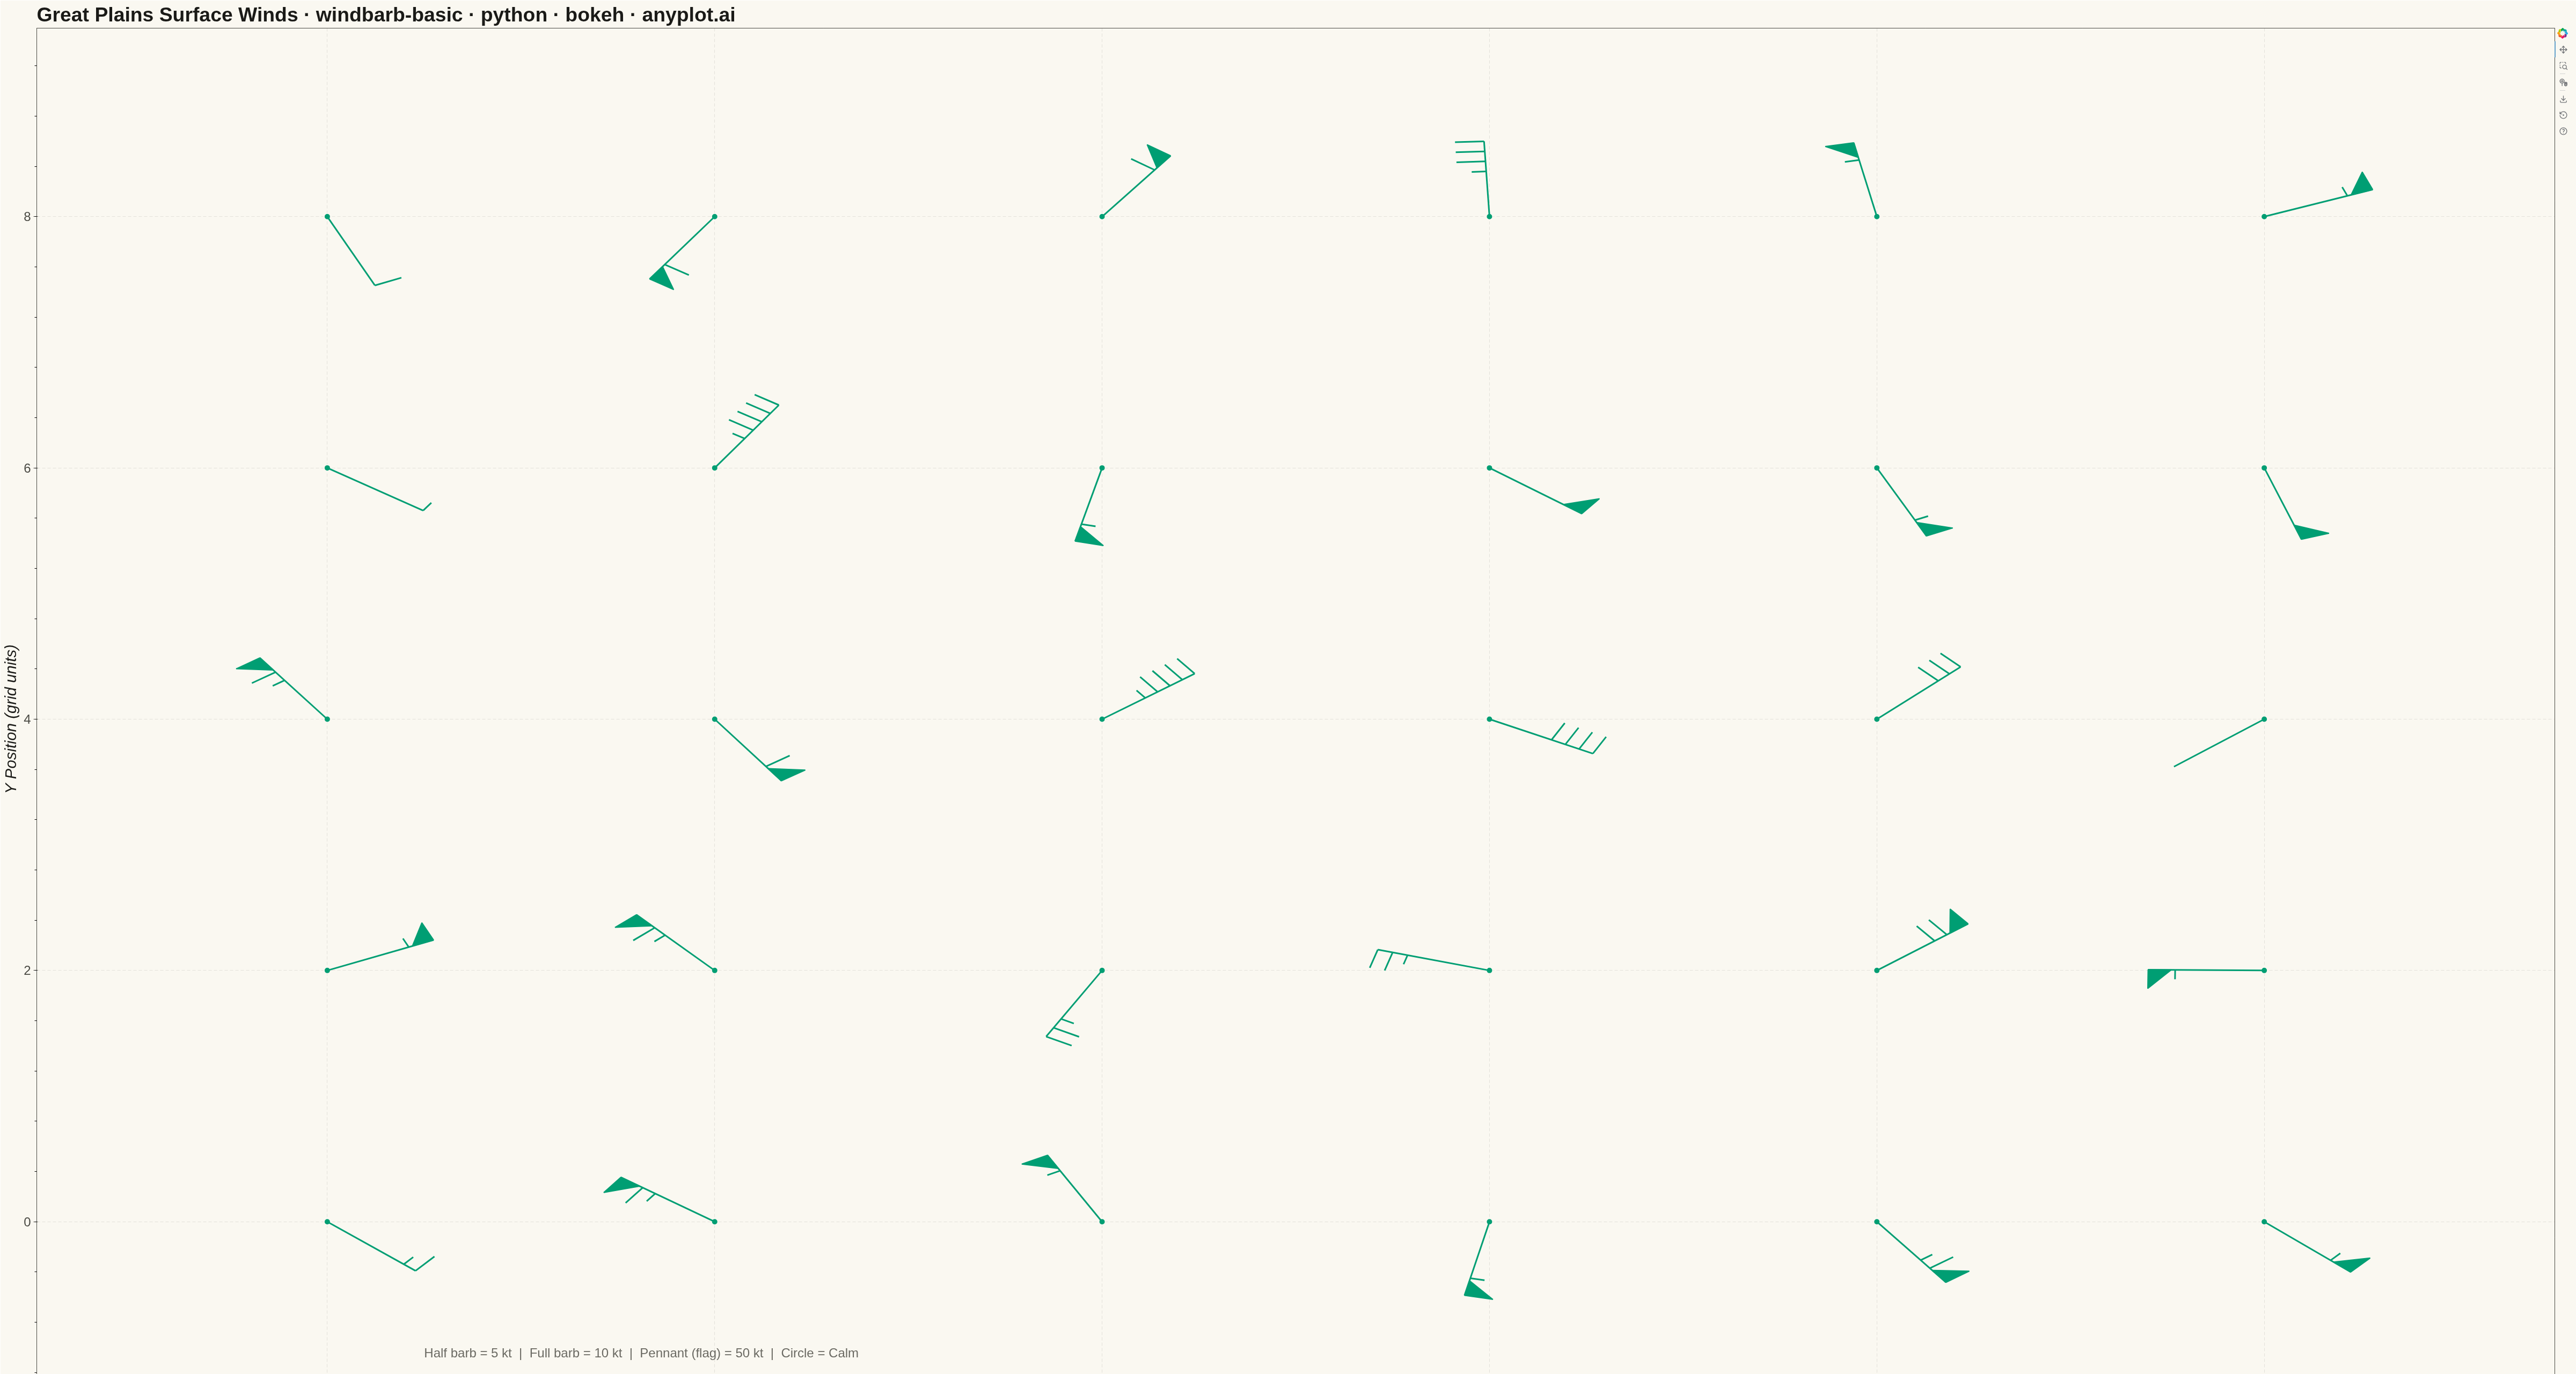
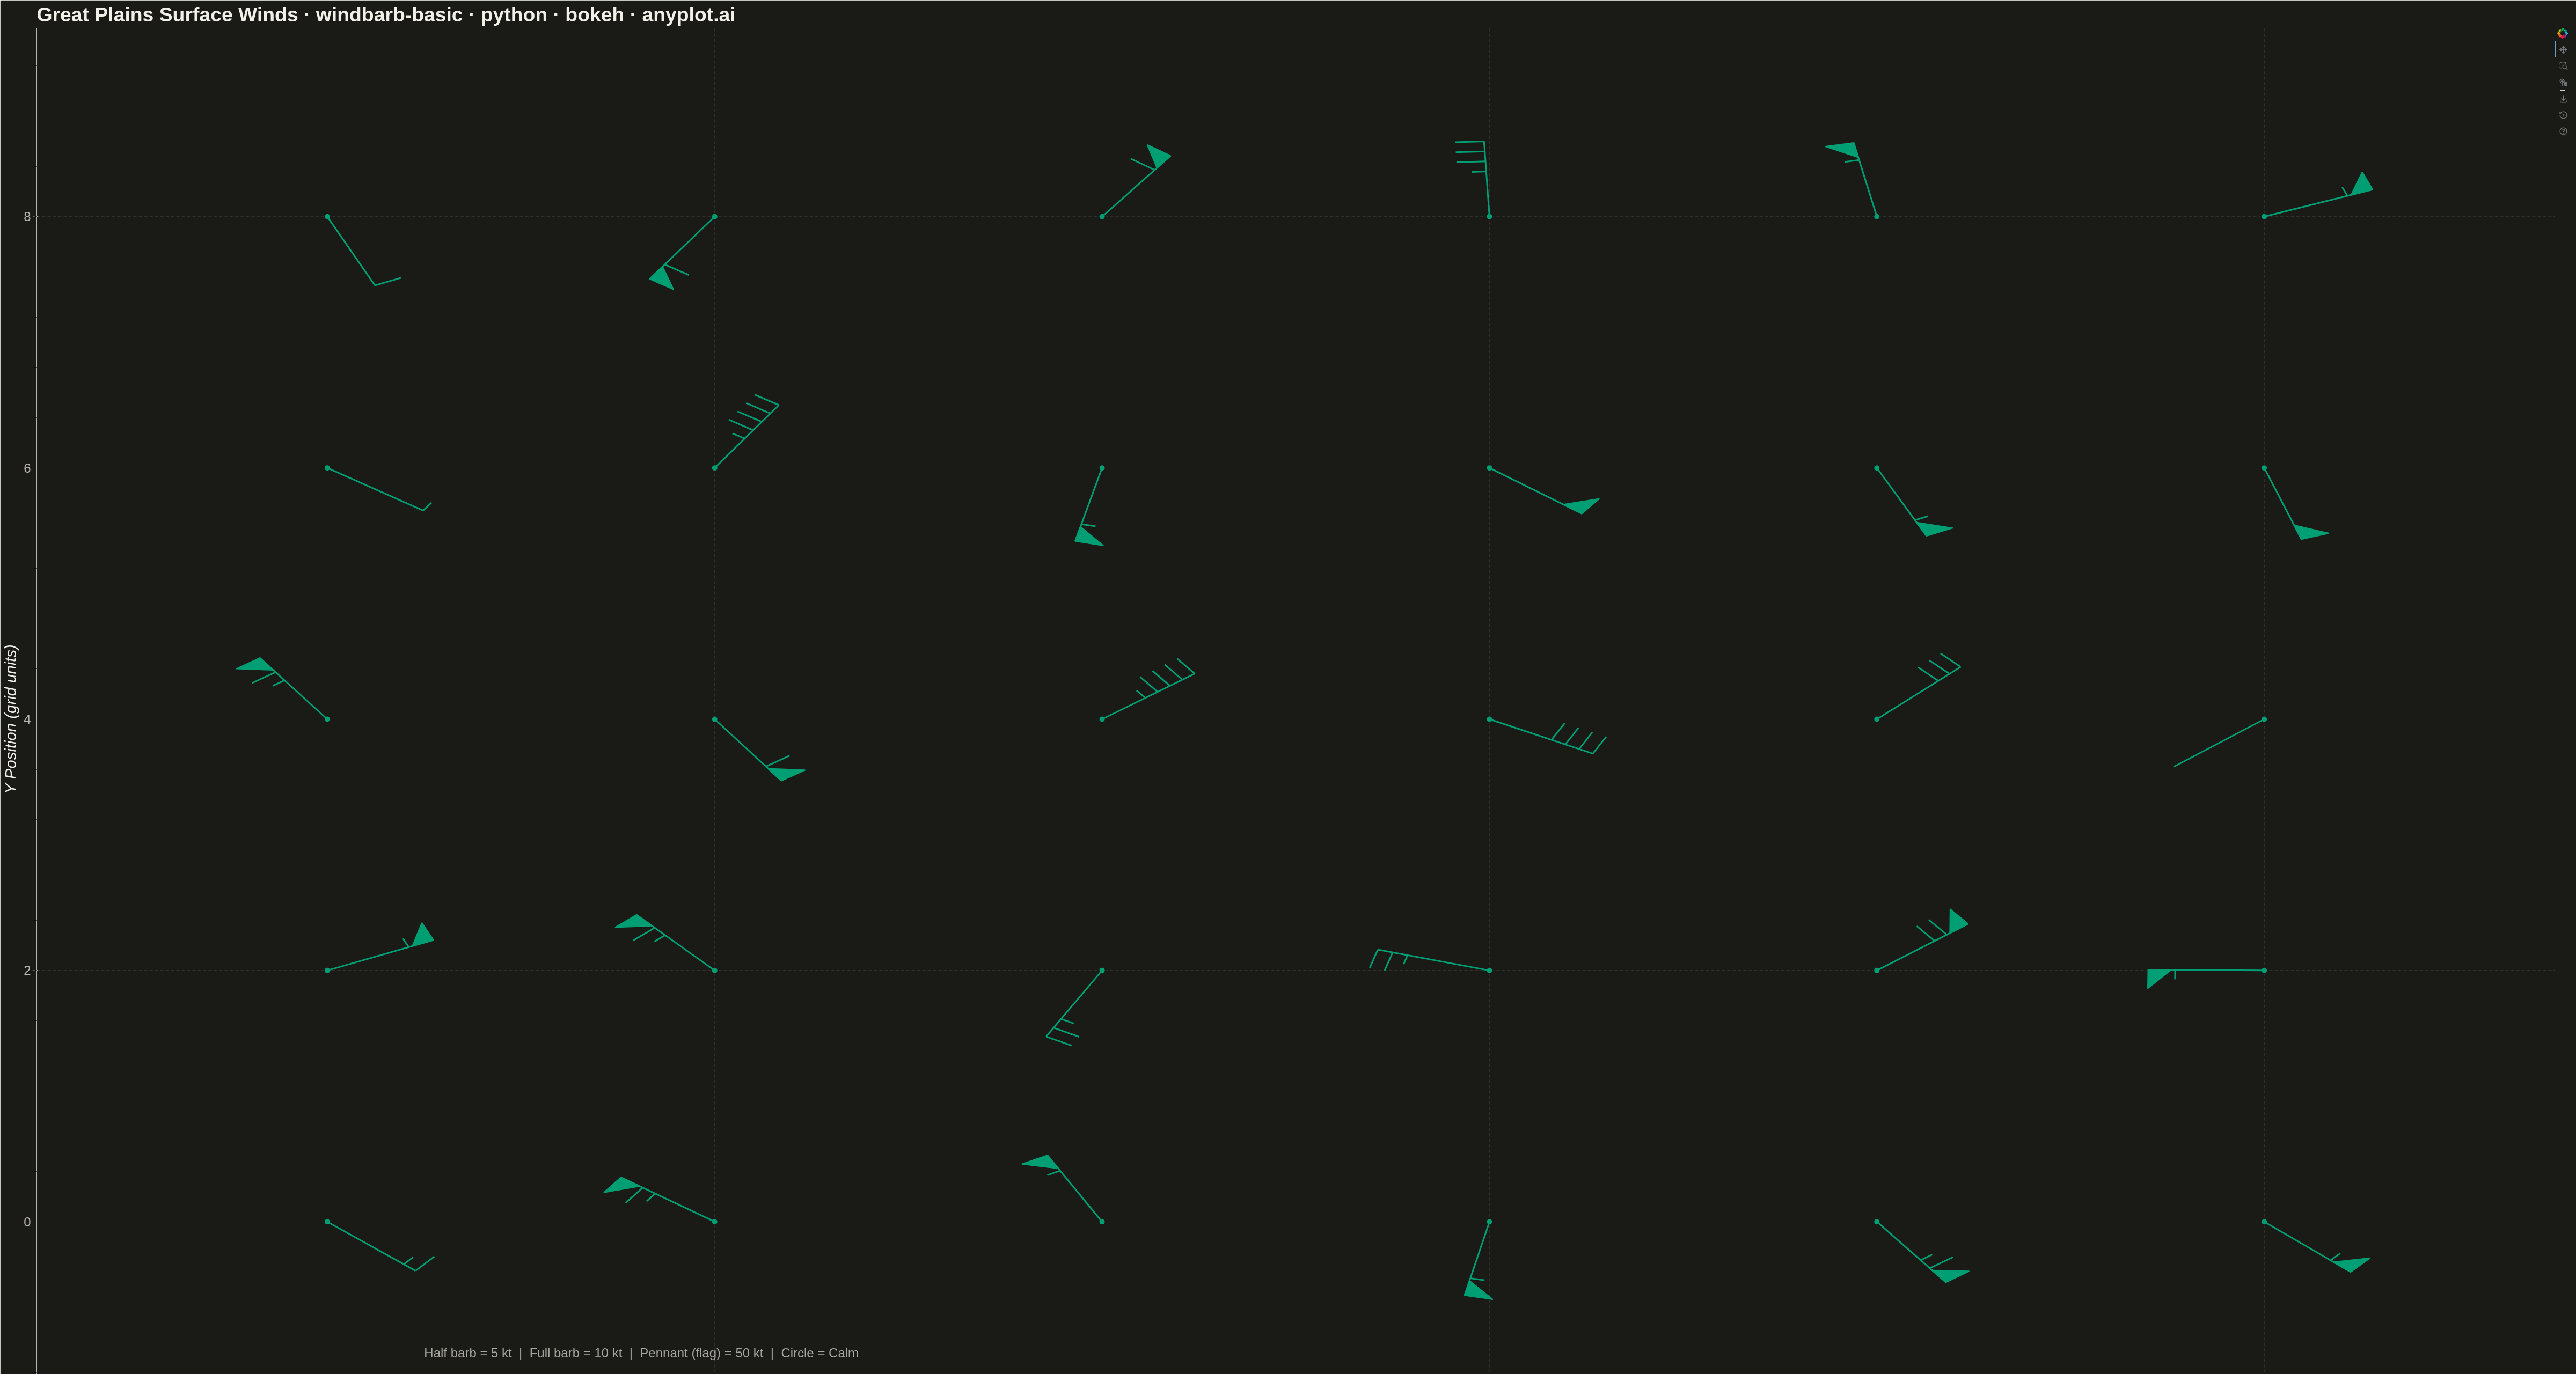
A wind barb plot displays wind speed and direction at specific locations using standard meteorological barb notation. Each barb consists of a staff pointing in the direction from which the wind blows, with short barbs (5 knots), long barbs (10 knots), and triangular pennants (50 knots) attached to indicate speed. This internationally recognized symbology enables rapid interpretation of wind patterns across weather maps and atmospheric data visualizations.
""" anyplot.ai
windbarb-basic: Wind Barb Plot for Meteorological Data
Library: bokeh 3.9.0 | Python 3.13.13
Quality: 82/100 | Updated: 2026-05-19
"""

import numpy as np
from bokeh.io import export_png
from bokeh.models import ColumnDataSource, Label
from bokeh.plotting import figure


# Data - Grid of wind observations
np.random.seed(42)

# Create a 6x5 grid of observation points
x_grid = np.linspace(0, 10, 6)
y_grid = np.linspace(0, 8, 5)
x, y = np.meshgrid(x_grid, y_grid)
x = x.flatten()
y = y.flatten()

# Wind components (u=east-west, v=north-south) in knots
# Create varied wind patterns to demonstrate different barb configurations
u = np.random.uniform(-30, 30, len(x))
v = np.random.uniform(-30, 30, len(x))

# Barb geometry parameters
barb_length = 0.6
barb_spacing = 0.08
barb_len = 0.15
pennant_len = 0.12

# Collect all barb geometry
all_lines_x = []
all_lines_y = []
all_pennants_x = []
all_pennants_y = []
calm_x = []
calm_y = []

# Generate wind barb geometry for each observation point
for i in range(len(x)):
    x_pos, y_pos = x[i], y[i]
    u_comp, v_comp = u[i], v[i]
    spd = np.sqrt(u_comp**2 + v_comp**2)

    # Calm wind - just mark for circle indicator
    if spd < 2.5:
        calm_x.append(x_pos)
        calm_y.append(y_pos)
        continue

    # Wind direction FROM which wind blows (opposite of velocity vector)
    angle = np.arctan2(-v_comp, -u_comp)

    # Staff endpoint
    staff_dx = barb_length * np.cos(angle)
    staff_dy = barb_length * np.sin(angle)
    end_x = x_pos + staff_dx
    end_y = y_pos + staff_dy

    # Add staff line
    all_lines_x.append([x_pos, end_x])
    all_lines_y.append([y_pos, end_y])

    # Calculate barbs - decompose speed into pennants, long barbs, half barbs
    remaining_speed = spd
    pennants = int(remaining_speed // 50)
    remaining_speed -= pennants * 50
    long_barbs = int(remaining_speed // 10)
    remaining_speed -= long_barbs * 10
    half_barbs = 1 if remaining_speed >= 5 else 0

    # Perpendicular direction (barbs on left side looking from origin)
    perp_angle = angle + np.pi / 2

    # Position along staff (start from outer end)
    pos = 0.0

    # Draw pennants (triangular flags for 50 knots)
    for _ in range(pennants):
        base_x = end_x - pos * np.cos(angle)
        base_y = end_y - pos * np.sin(angle)
        tip_x = base_x + barb_len * np.cos(perp_angle)
        tip_y = base_y + barb_len * np.sin(perp_angle)
        back_x = end_x - (pos + pennant_len) * np.cos(angle)
        back_y = end_y - (pos + pennant_len) * np.sin(angle)
        all_pennants_x.append([base_x, tip_x, back_x])
        all_pennants_y.append([base_y, tip_y, back_y])
        pos += pennant_len + 0.02

    # Draw long barbs (10 knots each)
    for _ in range(long_barbs):
        base_x = end_x - pos * np.cos(angle)
        base_y = end_y - pos * np.sin(angle)
        tip_x = base_x + barb_len * np.cos(perp_angle)
        tip_y = base_y + barb_len * np.sin(perp_angle)
        all_lines_x.append([base_x, tip_x])
        all_lines_y.append([base_y, tip_y])
        pos += barb_spacing

    # Draw half barb (5 knots) - shorter
    if half_barbs:
        base_x = end_x - pos * np.cos(angle)
        base_y = end_y - pos * np.sin(angle)
        tip_x = base_x + (barb_len * 0.5) * np.cos(perp_angle)
        tip_y = base_y + (barb_len * 0.5) * np.sin(perp_angle)
        all_lines_x.append([base_x, tip_x])
        all_lines_y.append([base_y, tip_y])

# Create figure
p = figure(
    width=4800,
    height=2700,
    title="windbarb-basic · bokeh · pyplots.ai",
    x_axis_label="X Position (grid units)",
    y_axis_label="Y Position (grid units)",
    x_range=(-1.5, 11.5),
    y_range=(-1.5, 9.5),
)

# Style the figure
p.title.text_font_size = "28pt"
p.xaxis.axis_label_text_font_size = "22pt"
p.yaxis.axis_label_text_font_size = "22pt"
p.xaxis.major_label_text_font_size = "18pt"
p.yaxis.major_label_text_font_size = "18pt"

# Grid styling
p.grid.grid_line_alpha = 0.3
p.grid.grid_line_dash = [6, 4]

# Draw wind barbs using multi_line
barb_source = ColumnDataSource(data={"xs": all_lines_x, "ys": all_lines_y})
p.multi_line(xs="xs", ys="ys", source=barb_source, line_width=3, line_color="#306998")

# Draw pennants (filled triangles)
if all_pennants_x:
    pennant_source = ColumnDataSource(data={"xs": all_pennants_x, "ys": all_pennants_y})
    p.patches(xs="xs", ys="ys", source=pennant_source, fill_color="#306998", line_color="#306998", line_width=2)

# Draw calm wind indicators (open circles)
if calm_x:
    calm_source = ColumnDataSource(data={"x": calm_x, "y": calm_y})
    p.scatter(x="x", y="y", source=calm_source, size=20, fill_color="white", line_color="#306998", line_width=3)

# Draw observation points
obs_source = ColumnDataSource(data={"x": x, "y": y})
p.scatter(x="x", y="y", source=obs_source, size=12, color="#FFD43B", line_color="#306998", line_width=2)

# Add legend annotation
legend_text = Label(
    x=0.5,
    y=-1.0,
    text="Half barb = 5 kt  |  Full barb = 10 kt  |  Pennant (flag) = 50 kt",
    text_font_size="18pt",
    text_color="#444444",
)
p.add_layout(legend_text)

# Save
export_png(p, filename="plot.png")
Runnable source as JSON, for any HTTP client: https://api.anyplot.ai/specs/windbarb-basic/bokeh/code. Any spec id and library id listed in llms-full.txt fit the same URL shape; every URL below is complete and callable.
{
  "spec_id": "windbarb-basic",
  "language": "python",
  "library": "bokeh",
  "page": "https://anyplot.ai/windbarb-basic/python/bokeh",
  "hub": "https://anyplot.ai/windbarb-basic",
  "code_json": "https://api.anyplot.ai/specs/windbarb-basic/bokeh/code",
  "spec_json": "https://api.anyplot.ai/specs/windbarb-basic",
  "render_light_png": "https://storage.googleapis.com/anyplot-images/plots/windbarb-basic/python/bokeh/plot-light.png",
  "render_dark_png": "https://storage.googleapis.com/anyplot-images/plots/windbarb-basic/python/bokeh/plot-dark.png",
  "interactive_light_html": "https://storage.googleapis.com/anyplot-images/plots/windbarb-basic/python/bokeh/plot-light.html",
  "interactive_dark_html": "https://storage.googleapis.com/anyplot-images/plots/windbarb-basic/python/bokeh/plot-dark.html",
  "quality_score": 82.0,
  "license": "MIT",
  "guide": "https://anyplot.ai/llms.txt"
}
Part of Wind Barb Plot for Meteorological Data on anyplot.ai.