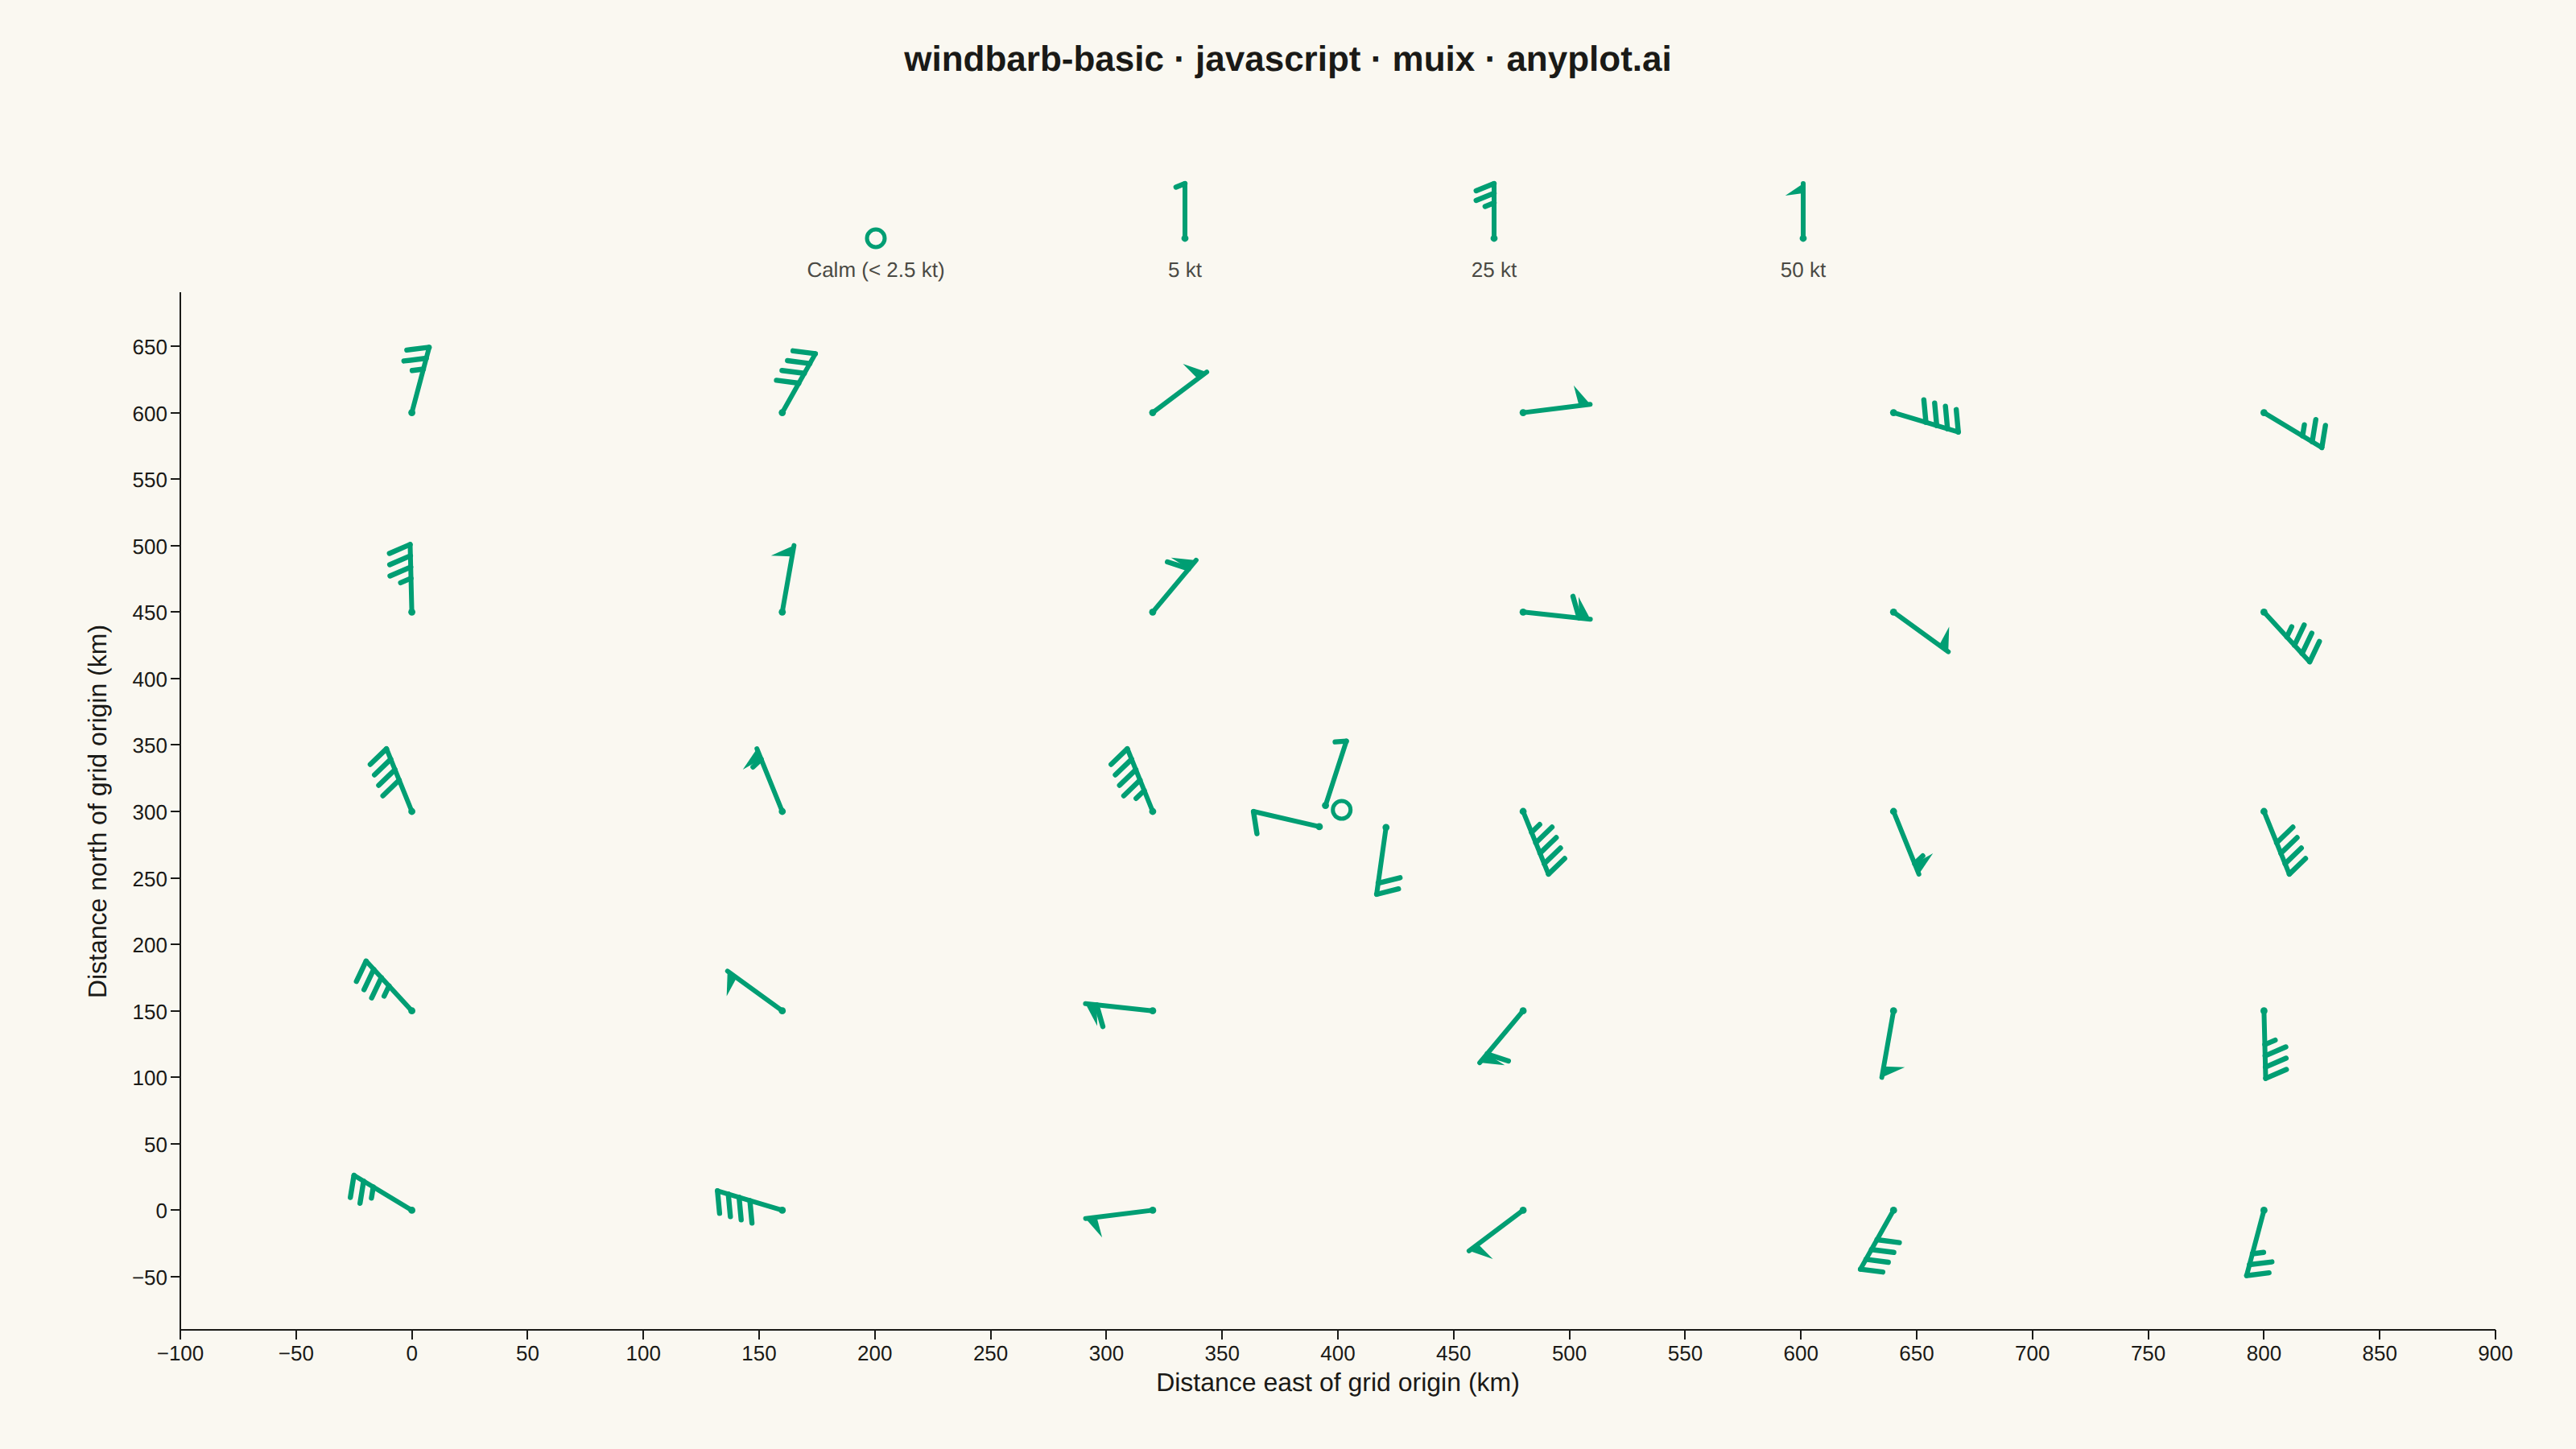
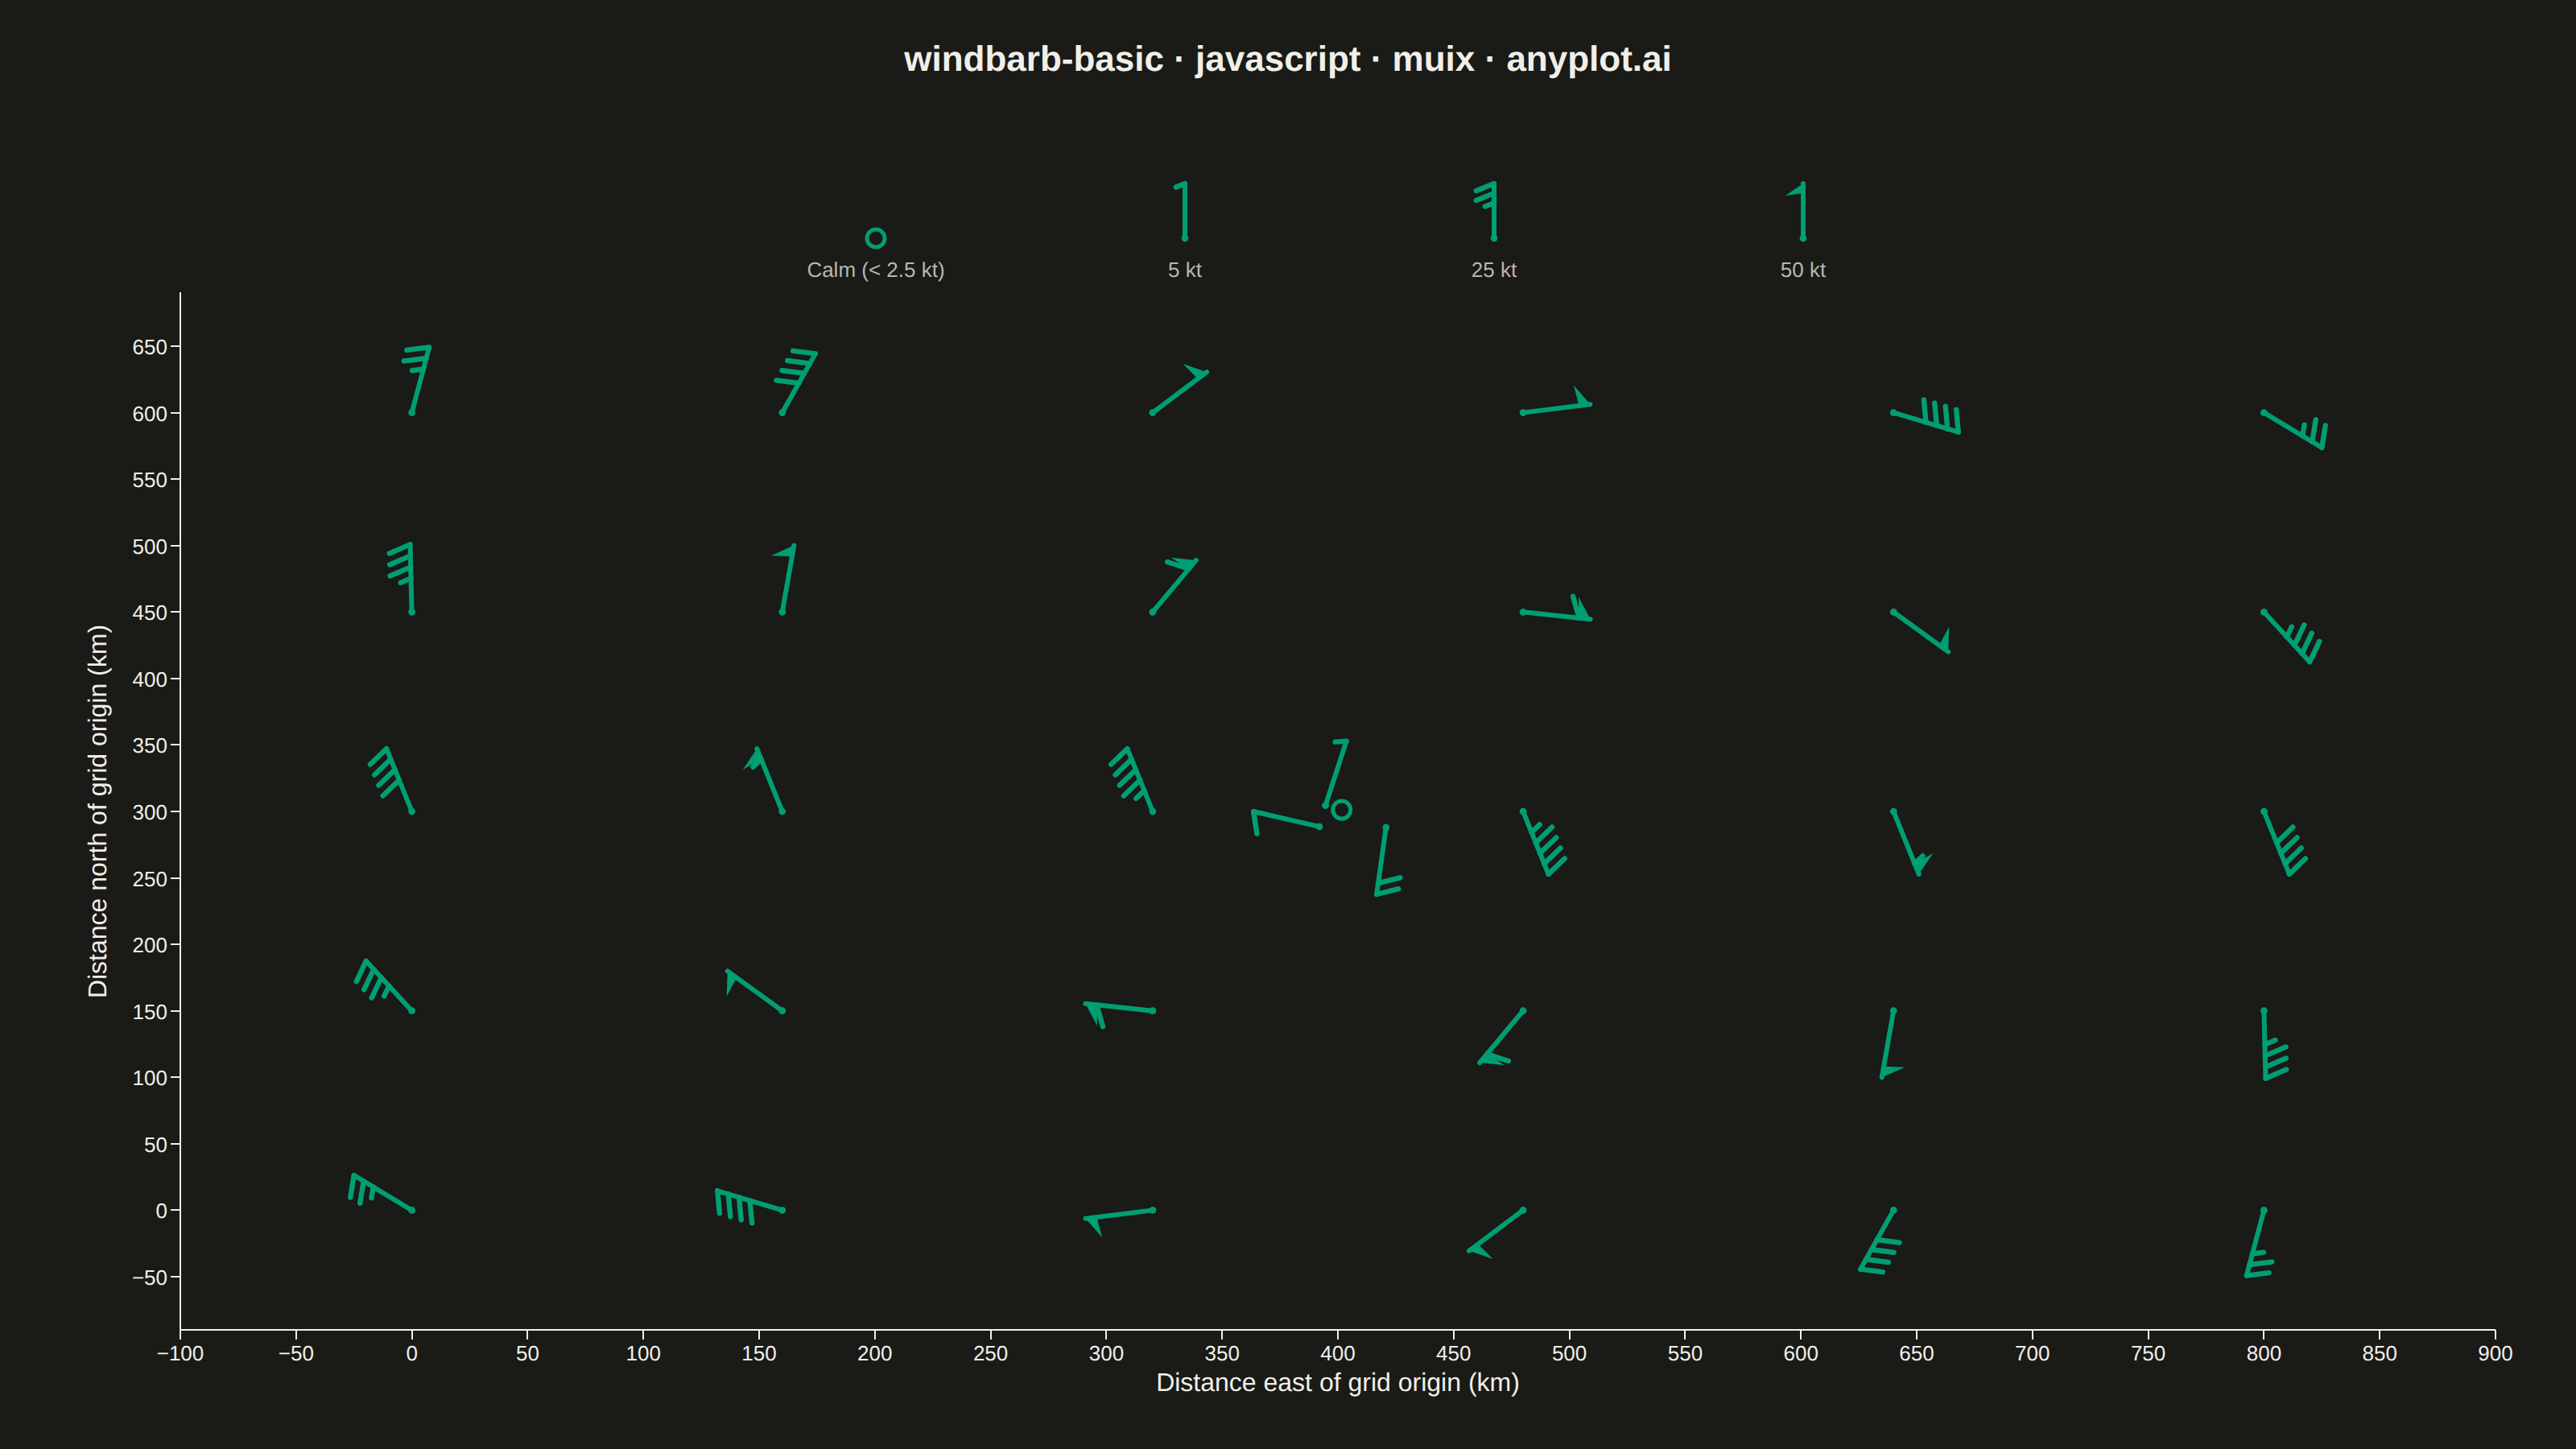
The same plot in 14 other libraries — JavaScript: Chart.js, D3.js, Apache ECharts, Highcharts; Python: Altair, Bokeh, lets-plot, Matplotlib, Plotly, plotnine, Pygal, Seaborn; R: ggplot2; Julia: Makie.jl. Compare all 15 side by side: Wind Barb Plot for Meteorological Data in Python, R, Julia and JavaScript.
A wind barb plot displays wind speed and direction at specific locations using standard meteorological barb notation. Each barb consists of a staff pointing in the direction from which the wind blows, with short barbs (5 knots), long barbs (10 knots), and triangular pennants (50 knots) attached to indicate speed. This internationally recognized symbology enables rapid interpretation of wind patterns across weather maps and atmospheric data visualizations.
// anyplot.ai
// windbarb-basic: Wind Barb Plot for Meteorological Data
// Library: muix 7.29.1 | JavaScript 22.23.2
// Quality: 91/100 | Created: 2026-09-02
//# anyplot-orientation: landscape
// anyplot.ai
// windbarb-basic: Wind Barb Plot for Meteorological Data
// Library: MUI X Charts 7.29 | React 18 | Node 22
// License: @mui/x-charts — MIT (community). Pro/Premium are out of scope.
// Quality: pending | Created: 2026-09-02
import { ChartContainer } from "@mui/x-charts/ChartContainer";
import { ChartsXAxis } from "@mui/x-charts/ChartsXAxis";
import { ChartsYAxis } from "@mui/x-charts/ChartsYAxis";
import { useXScale, useYScale } from "@mui/x-charts/hooks";

const t = window.ANYPLOT_TOKENS;
const FONT = "Roboto, Helvetica, Arial, sans-serif";

// --- Data: synthetic surface wind observations around a low-pressure system --
// (weather-station grid, distances in km, wind components u/v in knots).
// A Rankine-vortex-like tangential profile with a small cross-isobar inflow
// component — the same idealized shape used to teach cyclone wind fields.
const CENTER = { x: 400, y: 300 };
const PEAK_RADIUS_KM = 180;
const PEAK_SPEED_KT = 58;
const INFLOW_DEG = 22;

// Rankine-vortex-like tangential speed profile: 0 at the core, ramping up to
// PEAK_SPEED_KT at PEAK_RADIUS_KM, then decaying outward. Shared by the outer
// station grid and the inner core transect below, so both draw from the same
// physically consistent wind field. Never called with r=0 (a true center
// point has an undefined direction), so no divide-by-zero guard is needed.
function windAt(x, y) {
  const dx = x - CENTER.x;
  const dy = y - CENTER.y;
  const r = Math.hypot(dx, dy);
  const tangentE = -dy / r;
  const tangentN = dx / r;
  const inflowE = -dx / r;
  const inflowN = -dy / r;
  const a = (INFLOW_DEG * Math.PI) / 180;
  const dirE = Math.cos(a) * tangentE + Math.sin(a) * inflowE;
  const dirN = Math.cos(a) * tangentN + Math.sin(a) * inflowN;
  const ratio = r / PEAK_RADIUS_KM;
  const speed = PEAK_SPEED_KT * ratio * Math.exp(1 - ratio);
  return { u: speed * dirE, v: speed * dirN };
}

const stations = [];
for (let x = 0; x <= 800; x += 160) {
  for (let y = 0; y <= 600; y += 150) {
    stations.push({ x, y, ...windAt(x, y) });
  }
}

// Inner core transect: the coarse outer grid never comes closer than ~80 km
// to the vortex center, so every one of its stations lands in the high-wind
// (27-58 kt) band. These four points sample small radii near the core, where
// the same tangential profile ramps up from near-zero, so the real dataset
// (not just the legend) demonstrates the calm circle and the simpler
// half-barb / single-full-barb notations.
const CORE_TRANSECT = [
  { r: 2, angleDeg: 35 }, // ~1.7 kt -> calm circle
  { r: 7, angleDeg: 140 }, // ~5.9 kt -> half barb
  { r: 14, angleDeg: 235 }, // ~11.3 kt -> single full barb
  { r: 24, angleDeg: 330 }, // ~18.4 kt -> two full barbs
];
for (const { r, angleDeg } of CORE_TRANSECT) {
  const angle = (angleDeg * Math.PI) / 180;
  const x = CENTER.x + r * Math.cos(angle);
  const y = CENTER.y + r * Math.sin(angle);
  stations.push({ x, y, ...windAt(x, y) });
}

// --- Wind barb geometry (standard meteorological notation) ------------------
// Staff points toward the direction the wind blows FROM; pennant = 50 kt,
// full barb = 10 kt, half barb = 5 kt, stacked from the staff tip inward.
// Barbs sit on the left of the staff (Northern Hemisphere convention).
const CALM_KT = 2.5;
const CALM_RADIUS = 5.5;
const BARB_ANGLE_DEG = -112;
const STATION_GLYPH = { staffLen: 42, barbLen: 14, barbGap: 7 };
const LEGEND_GLYPH = { staffLen: 34, barbLen: 12, barbGap: 6 };

function rotate(dx, dy, deg) {
  const rad = (deg * Math.PI) / 180;
  const cos = Math.cos(rad);
  const sin = Math.sin(rad);
  return [dx * cos - dy * sin, dx * sin + dy * cos];
}

function barbGlyph(key, px, py, u, v, brand, geom) {
  const speed = Math.hypot(u, v);
  if (speed < CALM_KT) {
    return (
      <circle key={key} cx={px} cy={py} r={CALM_RADIUS} fill="none" stroke={brand} strokeWidth={2.5} />
    );
  }

  const inv = 1 / speed;
  // East/north wind vector -> screen pixels, reversed (staff points upwind).
  const outDx = -u * inv;
  const outDy = v * inv;
  const tipX = px + outDx * geom.staffLen;
  const tipY = py + outDy * geom.staffLen;
  const along = (d) => [tipX - outDx * d, tipY - outDy * d];
  const [rx, ry] = rotate(outDx, outDy, BARB_ANGLE_DEG);

  const rounded = Math.round(speed / 5) * 5;
  let remaining = rounded;
  const pennants = Math.floor(remaining / 50);
  remaining -= pennants * 50;
  const fullBarbs = Math.floor(remaining / 10);
  remaining -= fullBarbs * 10;
  const halfBarb = remaining >= 5;

  const marks = [];
  let pos = 0;
  for (let p = 0; p < pennants; p += 1) {
    const [nx, ny] = along(pos);
    const [fx, fy] = along(pos + geom.barbGap);
    const apexX = (nx + fx) / 2 + rx * geom.barbLen;
    const apexY = (ny + fy) / 2 + ry * geom.barbLen;
    marks.push(
      <polygon key={`${key}-p${p}`} points={`${nx},${ny} ${fx},${fy} ${apexX},${apexY}`} fill={brand} />
    );
    pos += geom.barbGap;
  }
  for (let b = 0; b < fullBarbs; b += 1) {
    const [bx, by] = along(pos);
    marks.push(
      <line
        key={`${key}-b${b}`}
        x1={bx}
        y1={by}
        x2={bx + rx * geom.barbLen}
        y2={by + ry * geom.barbLen}
        stroke={brand}
        strokeWidth={3.2}
        strokeLinecap="round"
      />
    );
    pos += geom.barbGap;
  }
  if (halfBarb) {
    const [bx, by] = along(pos);
    marks.push(
      <line
        key={`${key}-half`}
        x1={bx}
        y1={by}
        x2={bx + rx * geom.barbLen * 0.5}
        y2={by + ry * geom.barbLen * 0.5}
        stroke={brand}
        strokeWidth={3.2}
        strokeLinecap="round"
      />
    );
  }

  return (
    <g key={key}>
      <circle cx={px} cy={py} r={2.2} fill={brand} />
      <line x1={px} y1={py} x2={tipX} y2={tipY} stroke={brand} strokeWidth={3} strokeLinecap="round" />
      {marks}
    </g>
  );
}

// --- Station layer: maps data coordinates to pixels via the chart's own scales
function WindBarbLayer({ brand }) {
  const xScale = useXScale();
  const yScale = useYScale();
  return (
    <g>
      {stations.map((s) =>
        barbGlyph(`s-${s.x}-${s.y}`, xScale(s.x), yScale(s.y), s.u, s.v, brand, STATION_GLYPH)
      )}
    </g>
  );
}

// --- Legend: fixed pixel row under the title, outside the data area ---------
function legendKey(width, brand, ink) {
  const baseY = 148;
  const items = [
    { cx: width * 0.34, u: 0, v: 0, label: "Calm (< 2.5 kt)" },
    { cx: width * 0.46, u: 0, v: -5, label: "5 kt" },
    { cx: width * 0.58, u: 0, v: -25, label: "25 kt" },
    { cx: width * 0.7, u: 0, v: -50, label: "50 kt" },
  ];
  return (
    <g>
      {items.map((it, i) => (
        <g key={`legend-${i}`}>
          {barbGlyph(`legend-glyph-${i}`, it.cx, baseY, it.u, it.v, brand, LEGEND_GLYPH)}
          <text x={it.cx} y={baseY + 24} textAnchor="middle" fontSize={13} fontFamily={FONT} fill={ink}>
            {it.label}
          </text>
        </g>
      ))}
    </g>
  );
}

export default function Chart() {
  const size = window.ANYPLOT_SIZE;
  const brand = t.palette[0];

  return (
    <ChartContainer
      width={size.width}
      height={size.height}
      series={[]}
      margin={{ top: 182, right: 50, bottom: 74, left: 112 }}
      xAxis={[
        {
          scaleType: "linear",
          min: -100,
          max: 900,
          domainLimit: "strict",
          label: "Distance east of grid origin (km)",
          labelStyle: { fontSize: 16, fontFamily: FONT },
          tickLabelStyle: { fontSize: 13, fontFamily: FONT },
        },
      ]}
      yAxis={[
        {
          scaleType: "linear",
          min: -90,
          max: 690,
          domainLimit: "strict",
          label: "Distance north of grid origin (km)",
          labelStyle: { fontSize: 16, fontFamily: FONT },
          tickLabelStyle: { fontSize: 13, fontFamily: FONT },
          // Actual tick text stays 13px (tickLabelStyle above); this
          // deprecated prop is what ChartsYAxis uses to reserve the label
          // offset (labelRefPoint.x = tickFontSize + tickSize + 10), so it
          // must reflect the rendered tick label width to avoid the axis
          // label overlapping the tick numbers.
          tickFontSize: 30,
        },
      ]}
      disableAxisListener
      skipAnimation
    >
      <ChartsXAxis position="bottom" />
      <ChartsYAxis position="left" />
      <text x={size.width / 2} y={44} textAnchor="middle" fontSize={22} fontWeight={600} fontFamily={FONT} fill={t.ink}>
        windbarb-basic · javascript · muix · anyplot.ai
      </text>
      {legendKey(size.width, brand, t.inkSoft)}
      <WindBarbLayer brand={brand} />
    </ChartContainer>
  );
}
Runnable source as JSON, for any HTTP client: https://api.anyplot.ai/specs/windbarb-basic/muix/code. Any spec id and library id listed in llms-full.txt fit the same URL shape; every URL below is complete and callable.
{
  "spec_id": "windbarb-basic",
  "language": "javascript",
  "library": "muix",
  "page": "https://anyplot.ai/windbarb-basic/javascript/muix",
  "hub": "https://anyplot.ai/windbarb-basic",
  "code_json": "https://api.anyplot.ai/specs/windbarb-basic/muix/code",
  "spec_json": "https://api.anyplot.ai/specs/windbarb-basic",
  "render_light_png": "https://storage.googleapis.com/anyplot-images/plots/windbarb-basic/javascript/muix/plot-light.png",
  "render_dark_png": "https://storage.googleapis.com/anyplot-images/plots/windbarb-basic/javascript/muix/plot-dark.png",
  "interactive_light_html": "https://storage.googleapis.com/anyplot-images/plots/windbarb-basic/javascript/muix/plot-light.html",
  "interactive_dark_html": "https://storage.googleapis.com/anyplot-images/plots/windbarb-basic/javascript/muix/plot-dark.html",
  "quality_score": 91.0,
  "license": "MIT",
  "guide": "https://anyplot.ai/llms.txt"
}
Part of Wind Barb Plot for Meteorological Data on anyplot.ai.