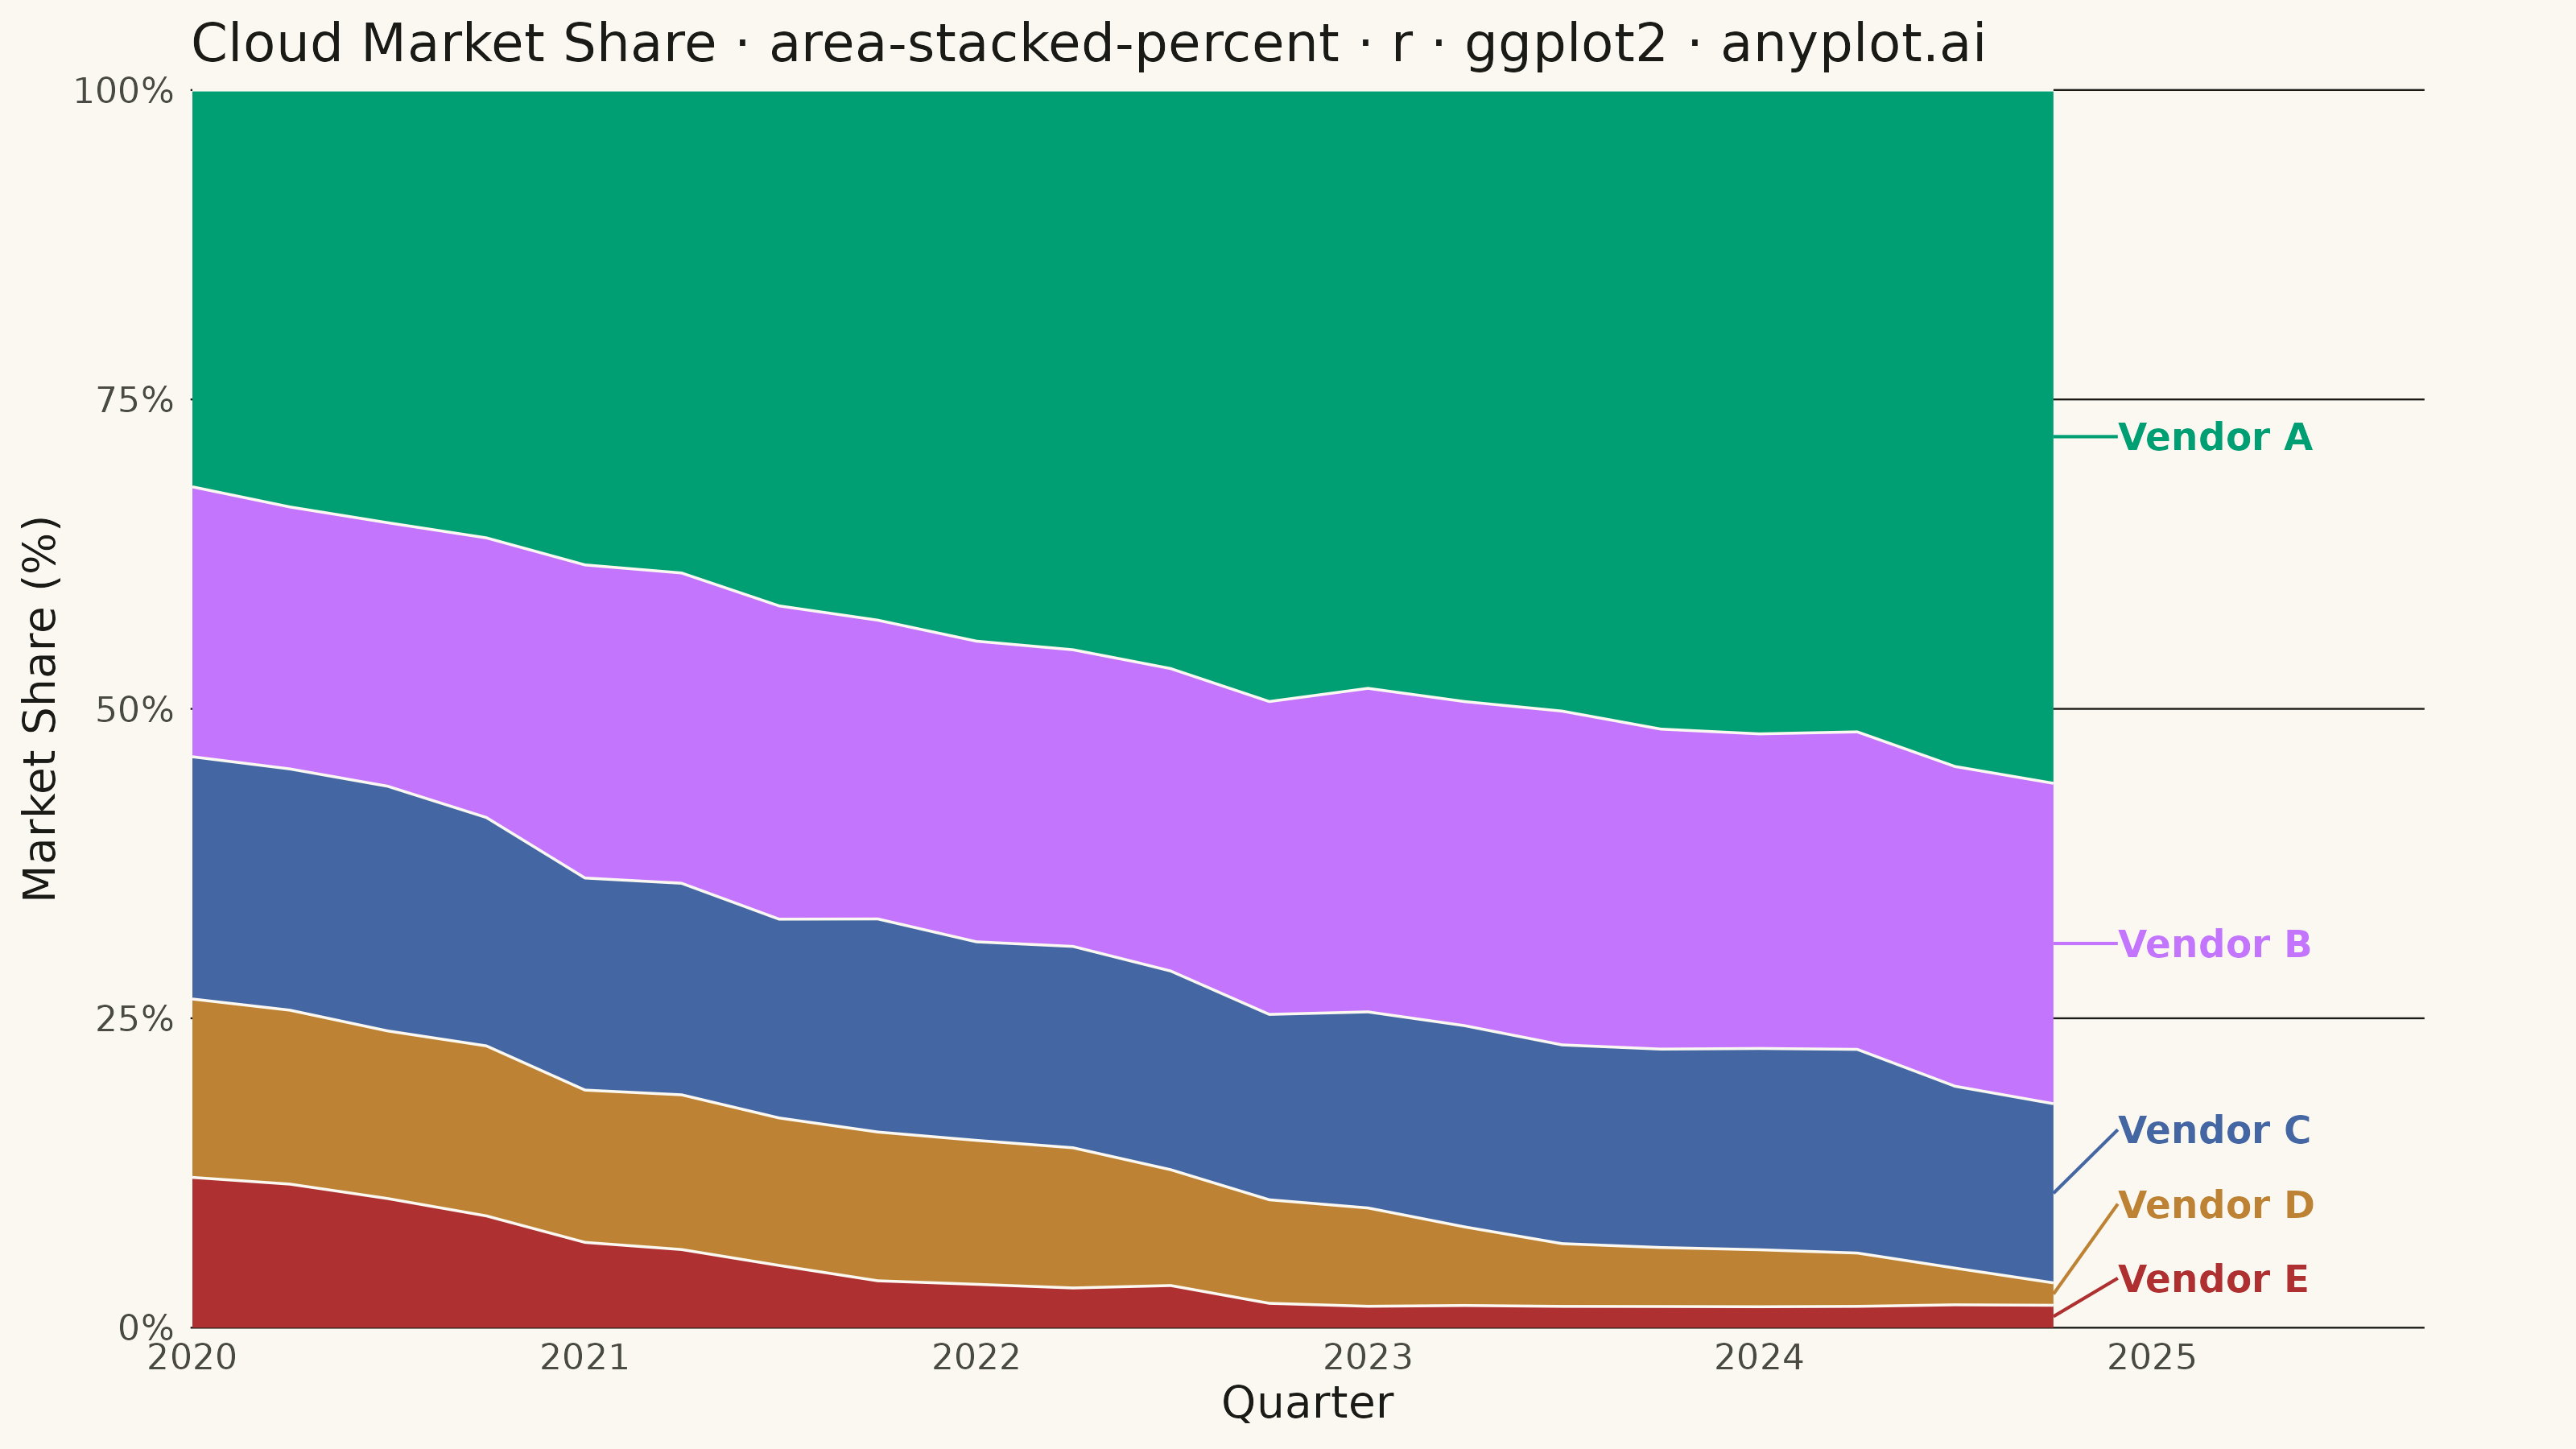
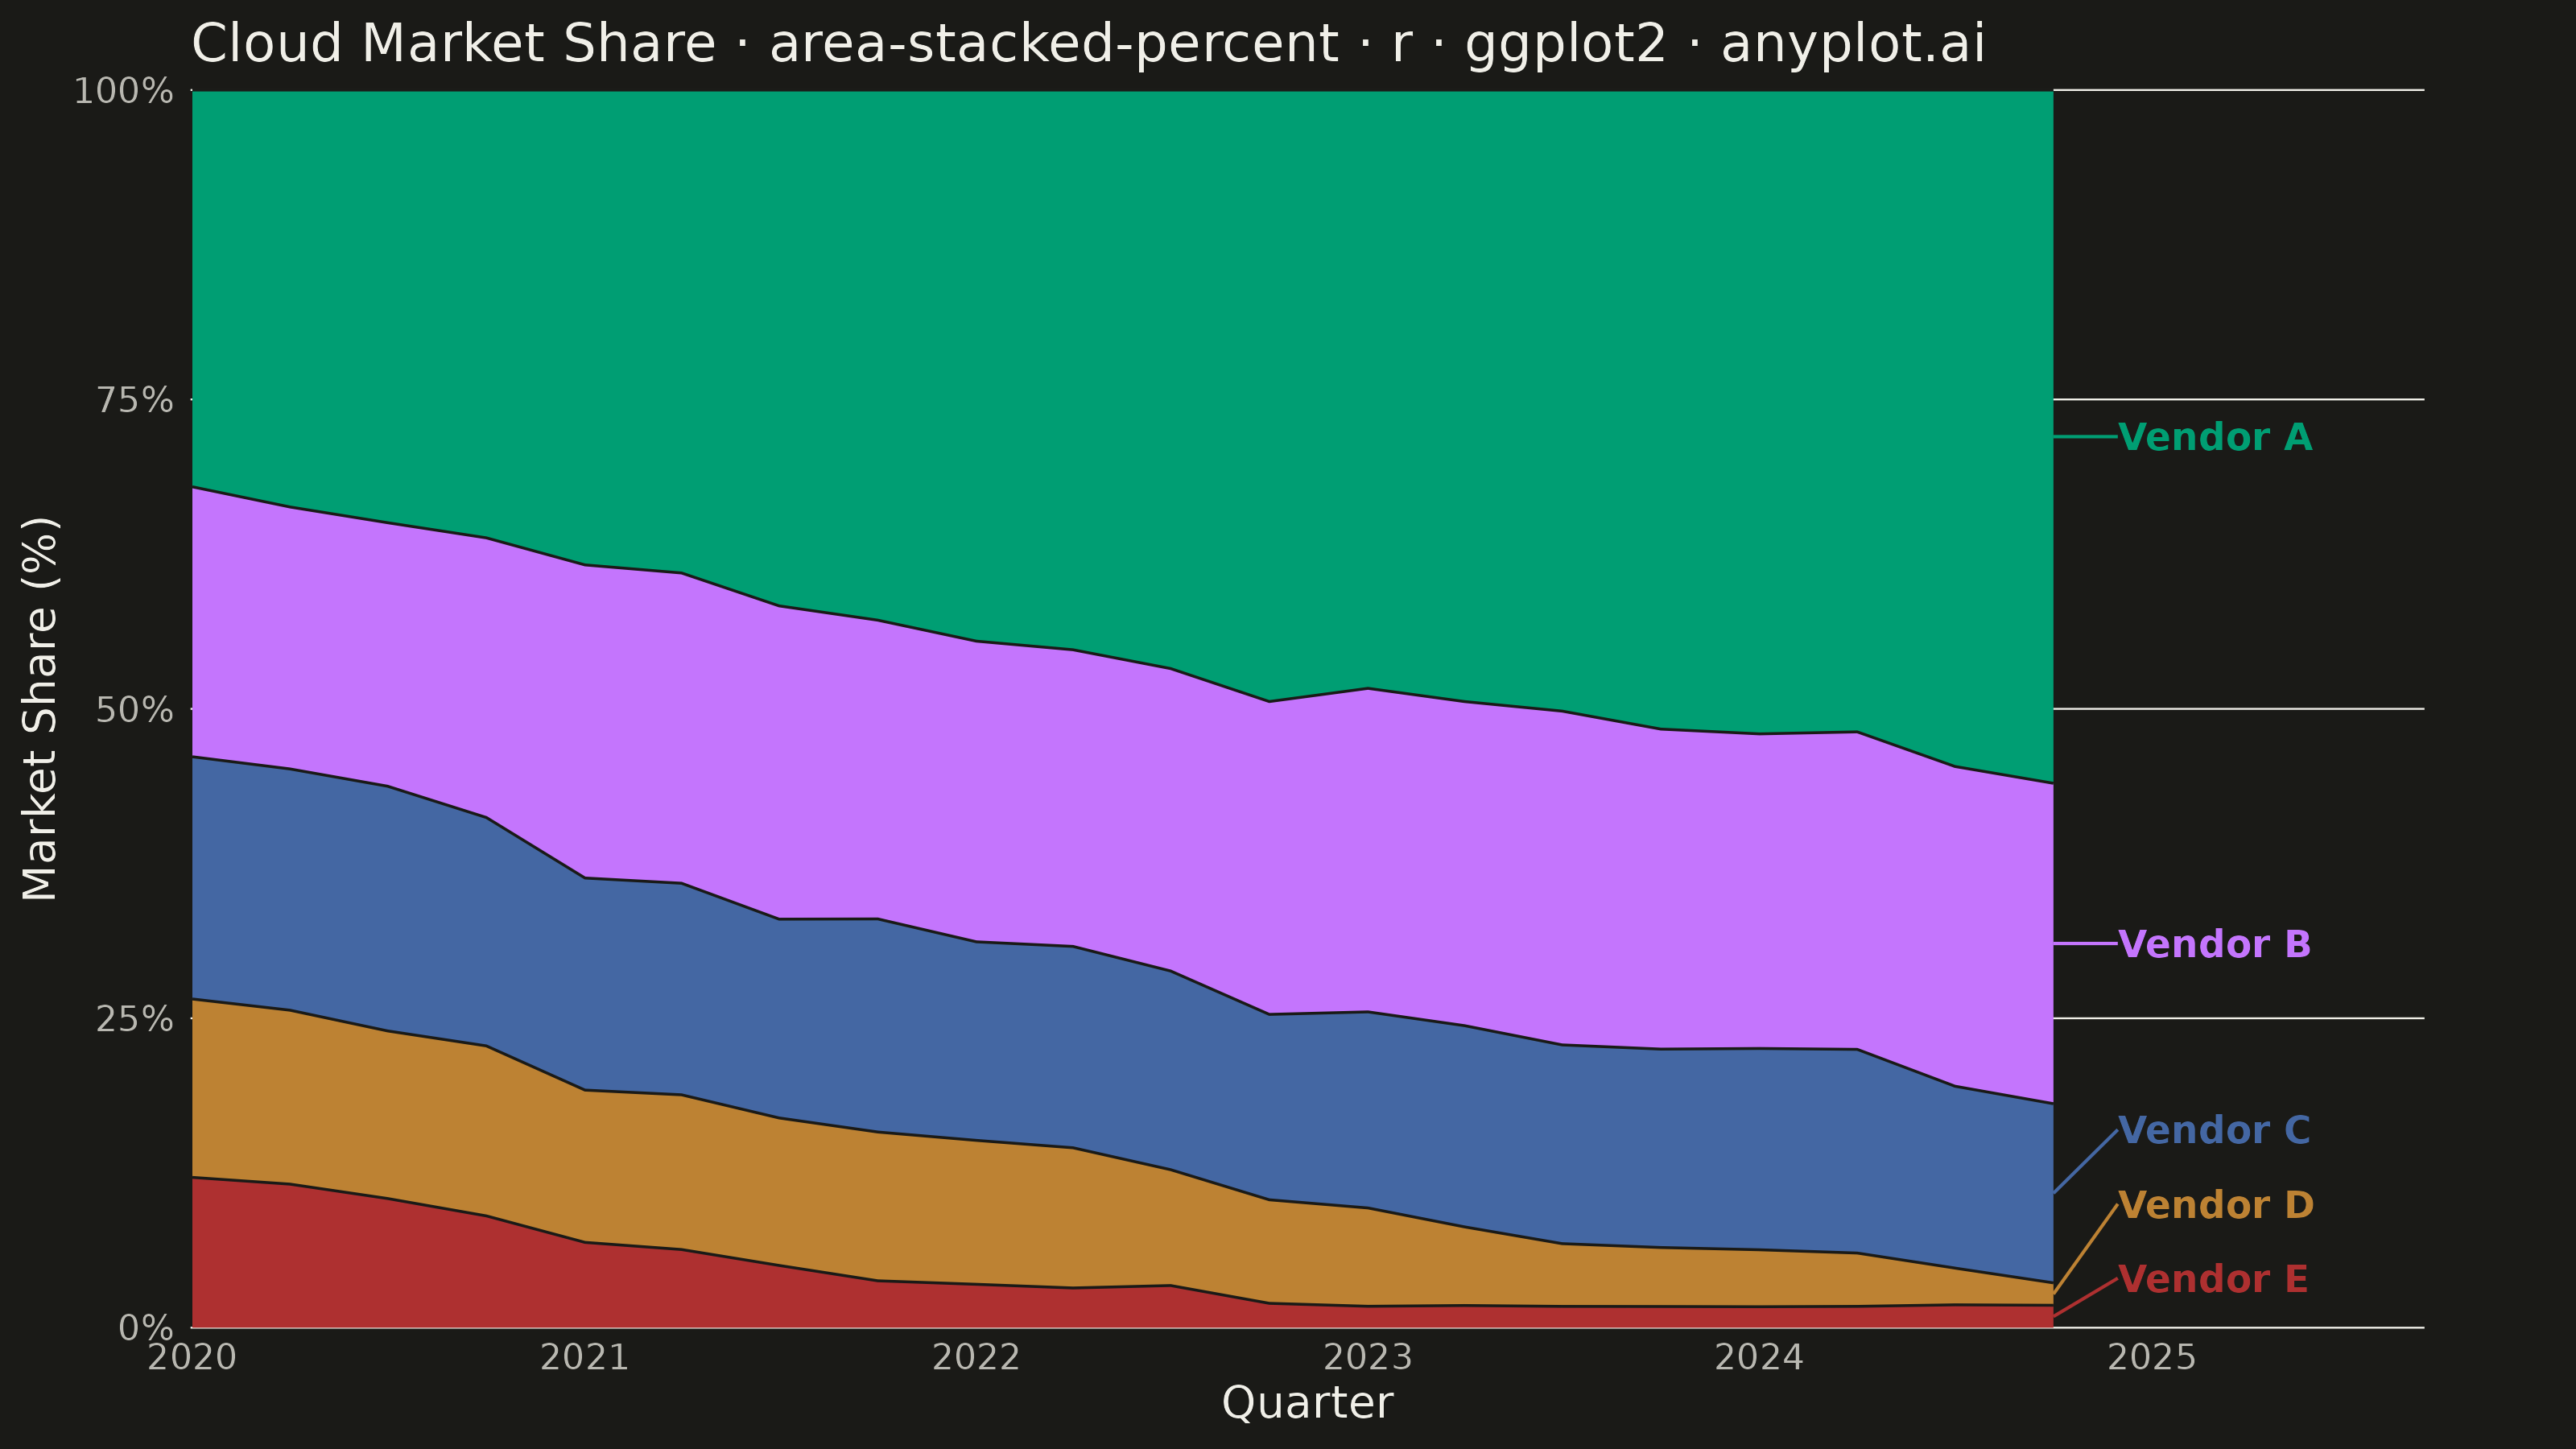
A stacked area chart normalized to 100%, where each area represents the percentage contribution of a category to the total. The combined height always equals 100%, showing proportional changes over time.
Preview render from the ggplot2 implementation.