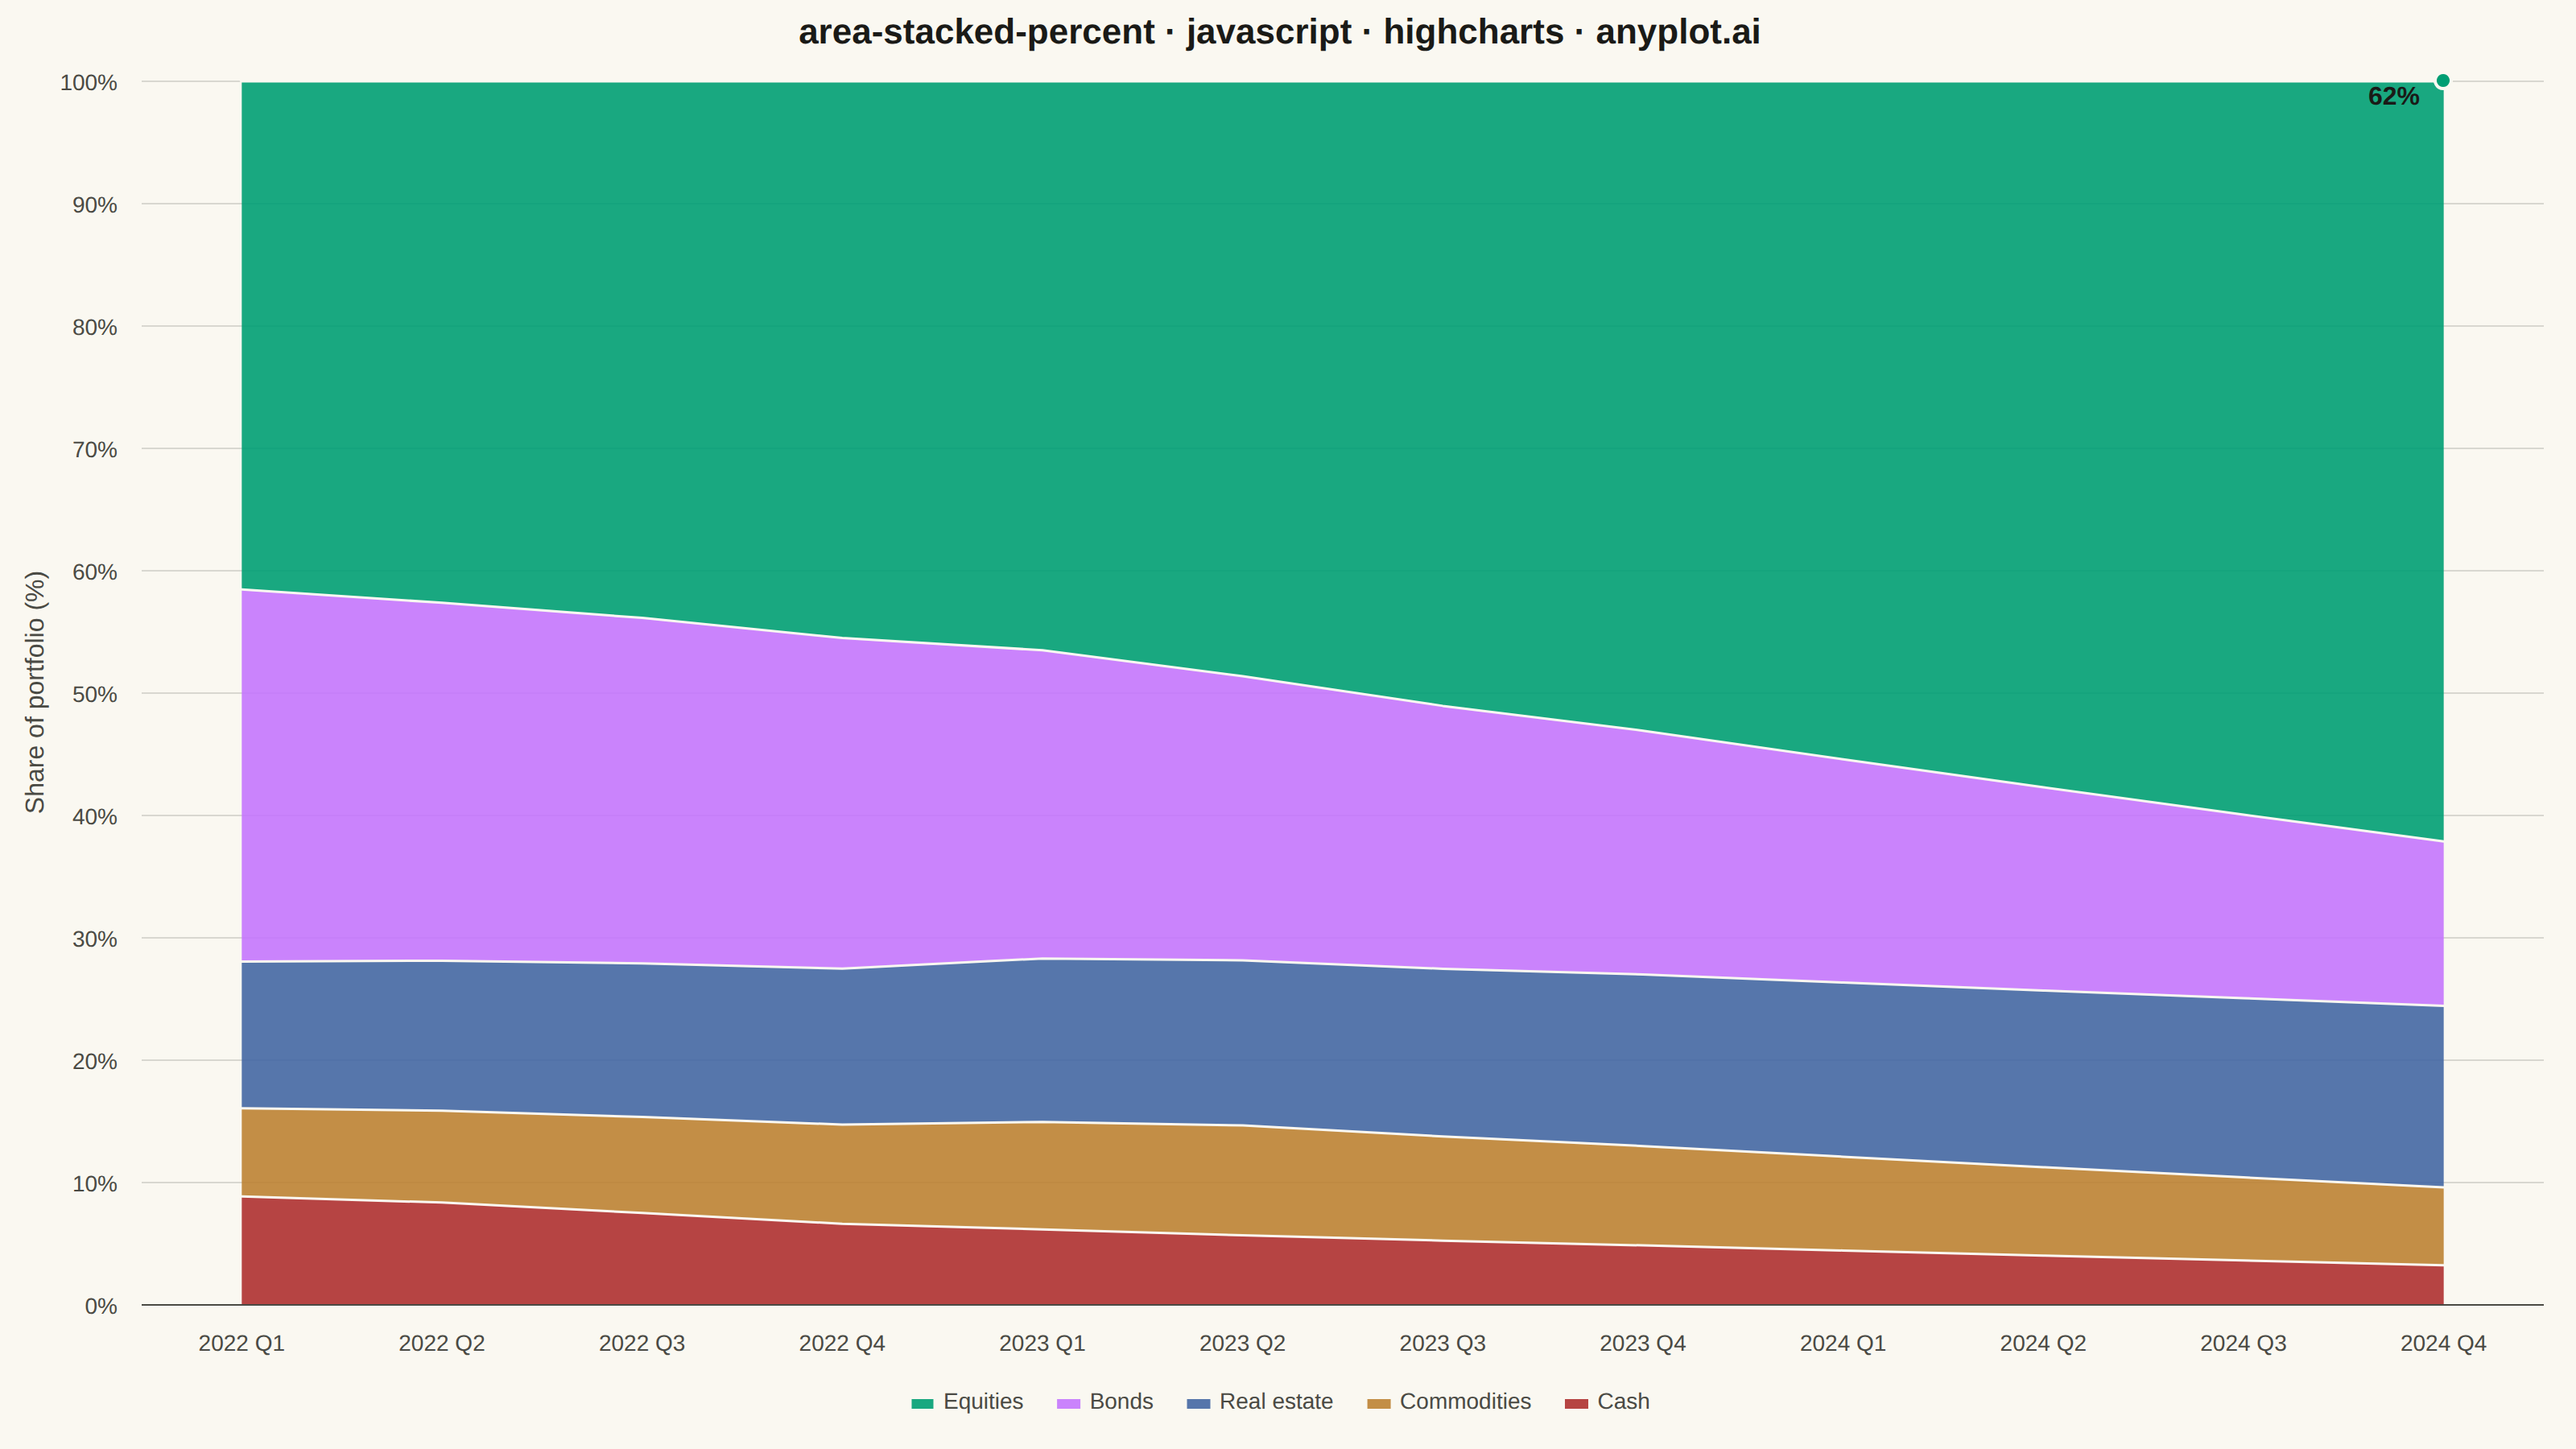
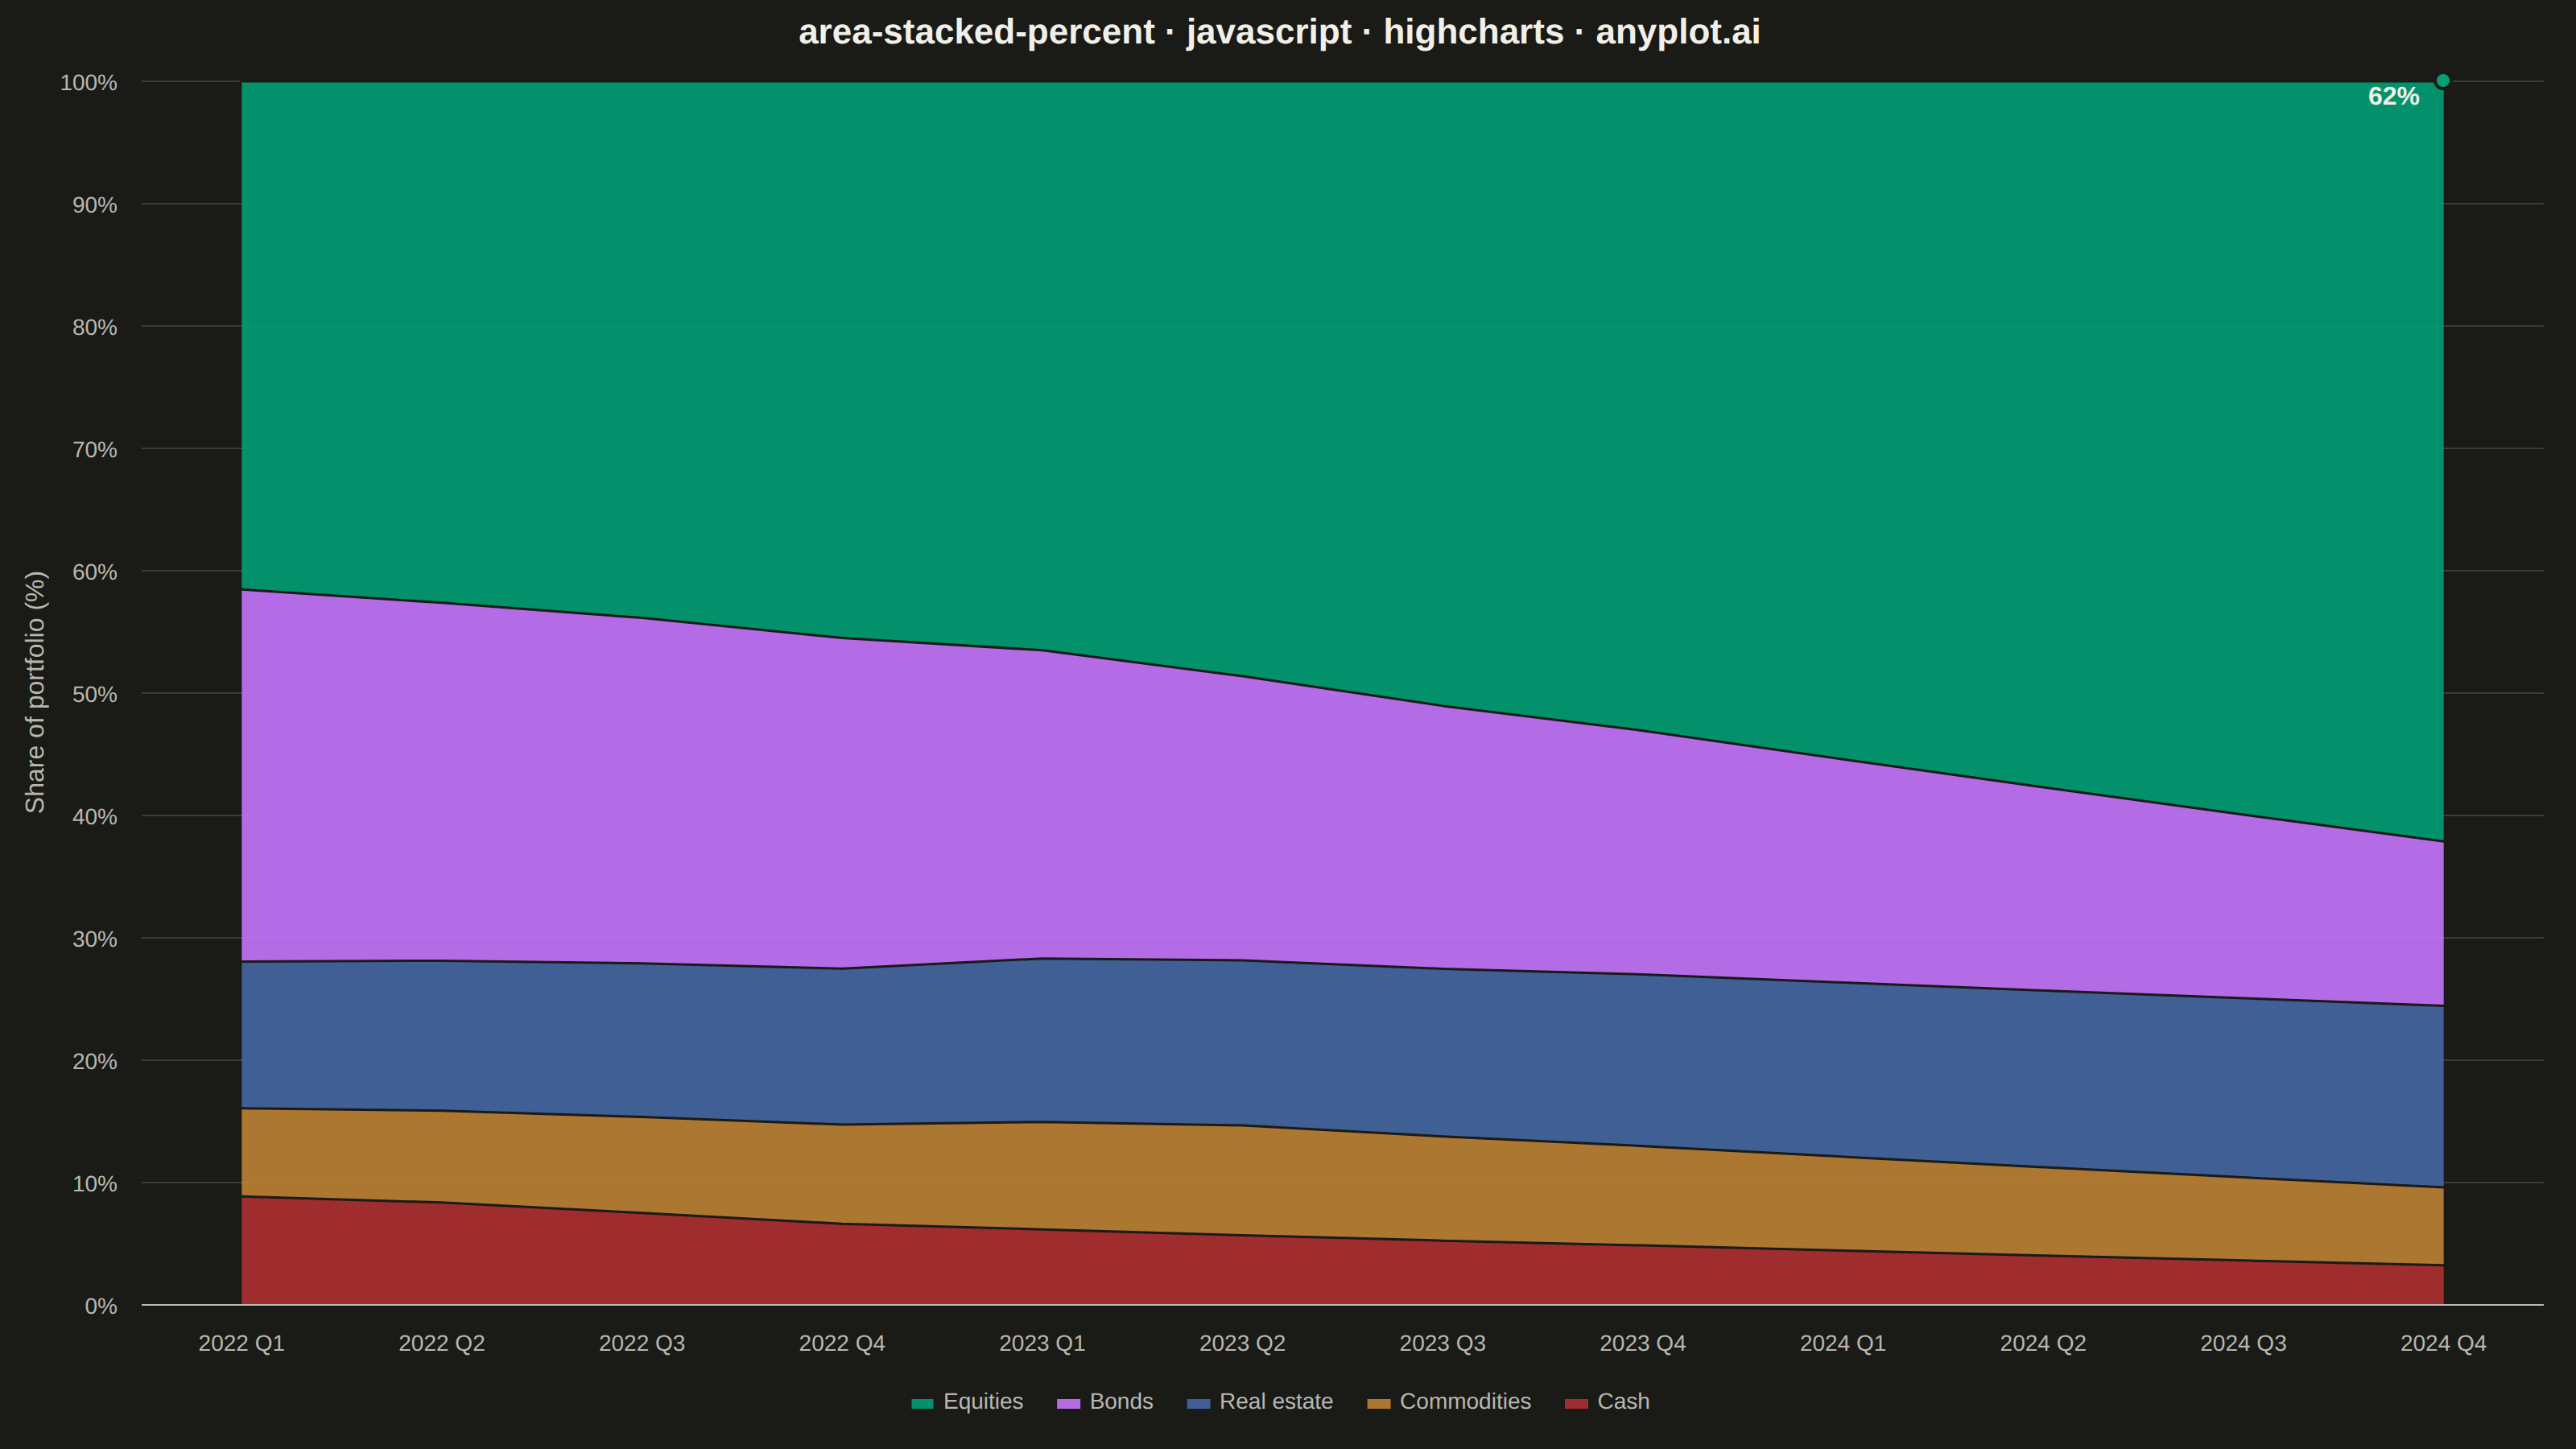
The same plot in 14 other libraries — JavaScript: Chart.js, D3.js, Apache ECharts, MUI X Charts; Python: Altair, Bokeh, lets-plot, Matplotlib, Plotly, plotnine, Pygal, Seaborn; R: ggplot2; Julia: Makie.jl. Compare all 15 side by side: 100% Stacked Area Chart in Python, R, Julia and JavaScript.
A stacked area chart normalized to 100%, where each area represents the percentage contribution of a category to the total. The combined height always equals 100%, showing proportional changes over time.
// anyplot.ai
// area-stacked-percent: 100% Stacked Area Chart
// Library: highcharts 12.6.0 | JavaScript 22.23.2
// Quality: 91/100 | Created: 2026-09-02

const t = window.ANYPLOT_TOKENS;

// --- Data (in-memory, deterministic) ----------------------------------------
// Quarterly portfolio allocation across five asset classes, in $ thousands.
const quarters = [
  "2022 Q1", "2022 Q2", "2022 Q3", "2022 Q4",
  "2023 Q1", "2023 Q2", "2023 Q3", "2023 Q4",
  "2024 Q1", "2024 Q2", "2024 Q3", "2024 Q4",
];

const equities = [520, 540, 560, 590, 610, 650, 690, 720, 760, 800, 840, 880];
const bonds = [380, 370, 360, 350, 330, 310, 290, 270, 250, 230, 210, 190];
const realEstate = [150, 155, 160, 165, 175, 180, 185, 190, 195, 200, 205, 210];
const commodities = [90, 95, 100, 105, 115, 120, 115, 110, 105, 100, 95, 90];
const cash = [110, 105, 95, 85, 80, 75, 70, 65, 60, 55, 50, 45];

// Highlight the equities-share growth story: mark the final quarter with a
// small anchor point and its exact share, using Highcharts' native
// per-point dataLabels/marker override (percentage comes from the
// stacking:"percent" engine via `point.percentage`).
const lastIndex = quarters.length - 1;
const equitiesData = equities.map((y, i) =>
  i === lastIndex
    ? {
        y,
        marker: { enabled: true, radius: 5, fillColor: t.palette[0], lineColor: t.pageBg, lineWidth: 2 },
        dataLabels: {
          enabled: true,
          format: "{point.percentage:.0f}%",
          align: "right",
          verticalAlign: "middle",
          x: -10,
          style: { color: t.ink, fontSize: "16px", fontWeight: "700", textOutline: "none" },
        },
      }
    : y
);

// --- Chart -------------------------------------------------------------------
Highcharts.chart("container", {
  chart: {
    type: "area",
    backgroundColor: "transparent",
    animation: false,
    spacingRight: 20,
    style: { fontFamily: "inherit" },
  },
  credits: { enabled: false },
  colors: t.palette,
  title: {
    text: "area-stacked-percent · javascript · highcharts · anyplot.ai",
    style: { color: t.ink, fontSize: "22px", fontWeight: "600" },
  },
  xAxis: {
    categories: quarters,
    lineColor: t.inkSoft,
    tickColor: t.inkSoft,
    labels: { style: { color: t.inkSoft, fontSize: "14px" } },
  },
  yAxis: {
    title: { text: "Share of portfolio (%)", style: { color: t.inkSoft, fontSize: "16px" } },
    gridLineColor: t.grid,
    labels: {
      style: { color: t.inkSoft, fontSize: "14px" },
      formatter() {
        return this.value + "%";
      },
    },
    min: 0,
    max: 100,
  },
  legend: {
    itemStyle: { color: t.inkSoft, fontSize: "14px" },
    itemHoverStyle: { color: t.ink },
  },
  tooltip: { enabled: false },
  plotOptions: {
    series: { animation: false, marker: { enabled: false } },
    area: {
      stacking: "percent",
      lineWidth: 1.5,
      lineColor: t.pageBg,
      fillOpacity: 0.9,
    },
  },
  series: [
    { name: "Equities", data: equitiesData, lineWidth: 2.5 },
    { name: "Bonds", data: bonds },
    { name: "Real estate", data: realEstate },
    { name: "Commodities", data: commodities },
    { name: "Cash", data: cash },
  ],
});
Runnable source as JSON, for any HTTP client: https://api.anyplot.ai/specs/area-stacked-percent/highcharts/code. Any spec id and library id listed in llms-full.txt fit the same URL shape; every URL below is complete and callable.
{
  "spec_id": "area-stacked-percent",
  "language": "javascript",
  "library": "highcharts",
  "page": "https://anyplot.ai/area-stacked-percent/javascript/highcharts",
  "hub": "https://anyplot.ai/area-stacked-percent",
  "code_json": "https://api.anyplot.ai/specs/area-stacked-percent/highcharts/code",
  "spec_json": "https://api.anyplot.ai/specs/area-stacked-percent",
  "render_light_png": "https://storage.googleapis.com/anyplot-images/plots/area-stacked-percent/javascript/highcharts/plot-light.png",
  "render_dark_png": "https://storage.googleapis.com/anyplot-images/plots/area-stacked-percent/javascript/highcharts/plot-dark.png",
  "interactive_light_html": "https://storage.googleapis.com/anyplot-images/plots/area-stacked-percent/javascript/highcharts/plot-light.html",
  "interactive_dark_html": "https://storage.googleapis.com/anyplot-images/plots/area-stacked-percent/javascript/highcharts/plot-dark.html",
  "quality_score": 91.0,
  "license": "MIT",
  "guide": "https://anyplot.ai/llms.txt"
}
Part of 100% Stacked Area Chart on anyplot.ai.